10-K: Annual report [Section 13 and 15(d), not S-K Item 405]
Published on February 25, 2026
UNITED STATES
SECURITIES AND EXCHANGE COMMISSION
WASHINGTON, D.C. 20549
Form 10-K
(Mark One)
ANNUAL REPORT PURSUANT TO SECTION 13 OR 15(d) OF THE SECURITIES EXCHANGE ACT OF 1934 | |||||
FOR THE FISCAL YEAR ENDED DECEMBER 31 , 2025
| TRANSITION REPORT PURSUANT TO SECTION 13 OR 15(d) OF THE SECURITIES EXCHANGE ACT OF 1934 | |||||
FOR THE TRANSITION PERIOD FROM TO
Commission File Number: 001-41197

(Exact name of registrant as specified in its charter)
| (State or other jurisdiction of incorporation or organization) | (I.R.S. Employer Identification No.) | |||||||
(Address of principal executive offices) (Zip Code)
(212 ) 515-3200
(Registrant’s telephone number, including area code)
Securities registered pursuant to Section 12(b) of the Act:
| Title of each class | Trading Symbol(s) | Name of each exchange on which registered | ||||||||||||
Securities registered pursuant to Section 12(g) of the Act: None
Indicate by check mark if the registrant is a well-known seasoned issuer, as defined in Rule 405 of the Securities Act. Yes x No ☐
Indicate by check mark if the registrant is not required to file reports pursuant to Section 13 or Section 15(d) of the Act. Yes ☐ No x
Indicate by check mark whether the registrant (1) has filed all reports required to be filed by Section 13 or 15(d) of the Securities Exchange Act of 1934 during the preceding 12 months (or for such shorter period that the registrant was required to file such reports), and (2) has been subject to such filing requirements for the past 90 days. Yes x No ☐
Indicate by check mark whether the registrant has submitted electronically every Interactive Data File required to be submitted pursuant to Rule 405 of Regulation S-T (§232.405 of this chapter) during the preceding 12 months (or for such shorter period that the registrant was required to submit such files). Yes x No ☐
Indicate by check mark whether the registrant is a large accelerated filer, an accelerated filer, a non-accelerated filer, a smaller reporting company or an emerging growth company. See the definitions of “large accelerated filer,” “accelerated filer,” “smaller reporting company” and “emerging growth company” in Rule 12b-2 of the Exchange Act.
| Accelerated filer ☐ | Non-accelerated filer ☐ | Smaller reporting company | Emerging growth company | ||||||||||||||||||||||||||||||||||||||
If an emerging growth company, indicate by check mark if the registrant has elected not to use the extended transition period for complying with any new or revised financial accounting standards provided pursuant to Section 13(a) of the Exchange Act. ☐
Indicate by check mark whether the registrant has filed a report on and attestation to its management’s assessment of the effectiveness of its internal control over financial reporting under Section 404(b) of the Sarbanes-Oxley Act (15 U.S.C.7262(b)) by the registered public accounting firm that prepared or issued its audit report. x
If securities are registered pursuant to Section 12(b) of the Act, indicate by check mark whether the financial statements of the registrant included in the filing reflect the correction of an error to previously issued financial statements. ☐
Indicate by check mark whether any of those error corrections are restatements that required a recovery analysis of incentive-based compensation received by any of the registrant’s executive officers during the relevant recovery period pursuant to §240.10D-1(b). ☐
Indicate by check mark whether the registrant is a shell company (as defined in Rule 12b-2 of the Exchange Act). Yes ☐ No x
The aggregate market value of the common stock of the registrant held by non-affiliates as of June 30, 2025 was approximately $58,394,760,022 .
As of February 20, 2026, there were 578,247,338 shares of the registrant’s common stock outstanding.
DOCUMENTS INCORPORATED BY REFERENCE
Portions of the registrant’s proxy statement for the 2026 Annual Meeting of Stockholders are incorporated by reference into Part III of this report to the extent described therein.
| TABLE OF CONTENTS | ||||||||
| Page | ||||||||
| PART I | ||||||||
| Item 1. | ||||||||
| Item 1A. | ||||||||
| Item 1B. | ||||||||
| Item 1C. | ||||||||
| Item 2. | ||||||||
| Item 3. | ||||||||
| Item 4. | ||||||||
| PART II | ||||||||
| Item 5. | ||||||||
| Item 6. | ||||||||
| Item 7. | ||||||||
| Item 7A. | ||||||||
| Item 8. | ||||||||
| Item 8A. | ||||||||
| Item 9. | ||||||||
| Item 9A. | ||||||||
| Item 9B. | ||||||||
| Item 9C. | ||||||||
| PART III | ||||||||
| Item 10. | ||||||||
| Item 11. | ||||||||
| Item 12. | ||||||||
| Item 13. | ||||||||
| Item 14. | ||||||||
| PART IV | ||||||||
| Item 15. | ||||||||
| Item 16. | ||||||||
2
Forward-Looking Statements
This report may contain forward-looking statements that are within the meaning of Section 27A of the Securities Act of 1933, as amended (the “Securities Act”), and Section 21E of the Securities Exchange Act of 1934, as amended (the “Exchange Act”). These statements include, but are not limited to, discussions related to Apollo’s expectations regarding the performance of its business, its liquidity and capital resources and the other non-historical statements in the discussion and analysis. These forward-looking statements are based on management’s beliefs, as well as assumptions made by, and information currently available to, management. When used in this report, the words “believe,” “anticipate,” “estimate,” “expect,” “intend,” “target” or future or conditional verbs, such as “will,” “should,” “could,” or “may,” and variations of such words and similar expressions are intended to identify forward-looking statements. Although management believes that the expectations reflected in these forward-looking statements are reasonable, it can give no assurance that these expectations will prove to have been correct. These statements are subject to certain risks, uncertainties and assumptions, including risks relating to inflation, interest rate fluctuations and market conditions generally, international trade barriers, domestic or international political developments and other geopolitical events, including geopolitical tensions and hostilities, the impact of energy market dislocation, our ability to manage our growth, our ability to operate in highly competitive environments, the performance of the funds we manage, our ability to raise new funds, the variability of our revenues, earnings and cash flow, the accuracy of management’s assumptions and estimates, our dependence on certain key personnel, our use of leverage to finance our businesses and investments by the funds we manage, Athene’s ability to maintain or improve financial strength ratings, the impact of Athene’s reinsurers failing to meet their assumed obligations, Athene’s ability to manage its business in a highly regulated industry, changes in our regulatory environment and tax status, and litigation risks, among others. We believe these factors include but are not limited to those described under the section entitled “Item 1A. Risk Factors” in this report, as such factors may be updated from time to time in our periodic filings with the SEC, which are accessible on the SEC’s website at www.sec.gov. These factors should not be construed as exhaustive and should be read in conjunction with the other cautionary statements that are included in this report and in our other filings with the SEC. We undertake no obligation to publicly update any forward-looking statements, whether as a result of new information, future developments or otherwise, except as required by applicable law.
Risk Factors Summary
The following is only a summary of the principal risks that could materially and adversely affect our business, financial condition, results of operations and cash flows, which should be read in conjunction with the detailed description of these risks in “Item 1A. Risk Factors.” Some of the factors that could materially and adversely affect our business, financial condition, results of operations and cash flows include, but are not limited to, the following:
•Evolving political, market and economic conditions;
•The variability in our revenues, earnings and cash flow;
•Our ability to expand into new investment strategies, geographic markets and businesses and attract new types of investors;
•Our business initiatives to increase the number and type of products offered to individual investors;
•Our operations in highly competitive industries;
•Our dependence on management’s assumptions and estimates;
•Our dependence on certain key personnel;
•Harm caused by actual or alleged misconduct, unethical behavior and other activities by our current and former employees, directors, or others affiliated with us;
•Our reliance on technology and information systems;
•Artificial intelligence increasing competitive, operational, legal and regulatory risks;
•Investments by us and the funds we manage in illiquid assets;
•Reliance by us and the funds we manage on the financing markets;
•Our reliance on our asset management business;
•Our dependence on our retirement services business;
•Our ability to deal appropriately with conflicts of interest;
•Our ability to comply with the extensive regulation of our businesses;
•Increased regulatory focus on our businesses and legislative or regulatory changes;
•Our exposure to third-party litigation;
•The tax treatment of our structure, which is complex and subject to change;
•The impact of a number of new minimum tax regimes and their implementation; and
•We may be subject to U.S. federal income tax in amounts greater than expected.
3
Terms Used in This Report
In this report, references to “Apollo,” “we,” “us,” “our,” and the “Company” refer to Apollo Global Management, Inc. (“AGM”) and its subsidiaries unless the context requires otherwise. References to “AGM common stock” or “common stock” of the Company refer to shares of common stock, par value $0.00001 per share, of AGM and “Mandatory Convertible Preferred Stock” refers to the 6.75% Series A Mandatory Convertible Preferred Stock of AGM.
The use of any defined term in this report to mean more than one entity, person, security or other item collectively is solely for convenience of reference and in no way implies that such entities, persons, securities or other items are one indistinguishable group. For example, notwithstanding the use of the defined terms “Apollo,” “we,” “us,” “our,” and the “Company” in this report to refer to AGM and its subsidiaries, each subsidiary of AGM is a standalone legal entity that is separate and distinct from AGM and any of its other subsidiaries. Any Apollo entity (including any Athene entity) referenced herein is responsible for its own financial, contractual and legal obligations.
| Term or Acronym | Definition | ||||
| AAA | Apollo Aligned Alternatives Aggregator, L.P. | ||||
| AAA Lux | Apollo Aligned Alternatives Lux Aggregator, L.P. | ||||
| AAIA | Athene Annuity and Life Company | ||||
| AAM | Apollo Asset Management, Inc. (f/k/a Apollo Global Management, Inc. prior to the Mergers.) | ||||
| AARe | Athene Annuity Re Ltd., a Bermuda reinsurance subsidiary | ||||
| ABS | Asset-backed securities | ||||
| Accord+ | Apollo Accord+ Fund, L.P., together with its parallel funds and alternative investment vehicles | ||||
| Accord+ II | Apollo Accord+ II Fund, L.P., together with its parallel funds and alternative investment vehicles | ||||
| Accord I | Apollo Accord Master Fund, L.P., together with its feeder funds | ||||
| Accord II | Apollo Accord Master Fund II, L.P., together with its feeder funds | ||||
| Accord III | Apollo Accord Master Fund III, L.P., together with its feeder funds | ||||
| Accord III B | Apollo Accord Master Fund III B, L.P., together with its feeder funds | ||||
| Accord IV | Apollo Accord Fund IV, L.P., together with its parallel funds and alternative investment vehicles | ||||
| Accord V | Apollo Accord Fund V, L.P., together with its parallel funds and alternative investment vehicles | ||||
| Accord VI | Apollo Accord Fund VI, L.P., together with its parallel funds and alternative investment vehicles | ||||
| Accord VII | Apollo Accord Fund VII, L.P., together with its parallel funds and alternative investment vehicles | ||||
| Accord Funds | Accord I, Accord II, Accord III, Accord III B, Accord IV, Accord V and Accord VI | ||||
| Accord+ Funds | Accord+ and Accord+ II | ||||
| ACRA | ACRA 1 and ACRA 2 | ||||
| ACRA 1 | Athene Co-Invest Reinsurance Affiliate Holding Ltd., together with its subsidiaries | ||||
| ACRA 2 | Athene Co-Invest Reinsurance Affiliate Holding 2 Ltd., together with its subsidiaries | ||||
| ADCF | Apollo Diversified Credit Fund | ||||
| ADIP | ADIP I and ADIP II | ||||
| ADIP I | Apollo/Athene Dedicated Investment Program (A), L.P., together with its parallel funds, a series of funds managed by Apollo including third-party capital that, through ACRA 1, invests alongside Athene in certain investments | ||||
| ADIP II | Apollo/Athene Dedicated Investment Program II, L.P., a fund managed by Apollo including third-party capital that, through ACRA 2, invests alongside Athene in certain investments | ||||
| Adjusted Net Income Shares Outstanding, or ANI Shares Outstanding | Consists of total shares of common stock outstanding, RSUs that participate in dividends, and shares of common stock assumed to be issuable upon the conversion of the shares of Mandatory Convertible Preferred Stock | ||||
| ADREF | Apollo Diversified Real Estate Fund | ||||
| ADS | Apollo Debt Solutions BDC | ||||
| AFS | Available-for-sale | ||||
| AIOF I | Apollo Infra Equity US Fund, L.P. and Apollo Infra Equity International Fund, L.P., including their feeder funds and alternative investment vehicles | ||||
| AIOF II | Apollo Infrastructure Opportunities Fund II, L.P., together with its parallel funds and alternative investment vehicles | ||||
| AIOF III | Apollo Infrastructure Opportunities Fund III, L.P., together with its parallel funds and alternative investment vehicles | ||||
| ALRe | Athene Life Re Ltd., a Bermuda reinsurance subsidiary | ||||
4
| Alternative investments | Alternative investments, including investment funds and certain VIEs, adjusted for reinsurance impacts and to include Athene's proportionate share of ACRA alternative investments based on its economic ownership | ||||
| AMH | Apollo Management Holdings, L.P., a Delaware limited partnership, that is an indirect subsidiary of AGM | ||||
| ANRP I | Apollo Natural Resources Partners, L.P., together with its alternative investment vehicles | ||||
| ANRP II | Apollo Natural Resources Partners II, L.P., together with its alternative investment vehicles | ||||
| ANRP III | Apollo Natural Resources Partners III, L.P., together with its parallel funds and alternative investment vehicles | ||||
| AOCI | Accumulated other comprehensive income (loss) | ||||
| AOG Units | Units of the Apollo Operating Group | ||||
| Apollo DAF | The donor-advised fund established by Apollo | ||||
| Apollo funds, our funds and references to the funds we manage | The funds (including the parallel funds and alternative investment vehicles of such funds), partnerships, accounts, including strategic investment accounts or “SIAs,” alternative asset companies and other entities for which subsidiaries of Apollo provide investment management or advisory services. | ||||
| Apollo Operating Group | (i) The entities through which we currently operate our asset management business and (ii) one or more entities formed for the purpose of, among other activities, holding certain of our gains or losses on our principal investments in the funds, which we refer to as our “principal investments.” | ||||
| Apollo TRA | The tax receivable agreement entered into by and among APO Corp., the Former Managing Partners, the Contributing Partners, and other parties thereto | ||||
| ARI | Apollo Commercial Real Estate Finance, Inc. | ||||
| ARIS | Apollo Realty Income Solutions, Inc. | ||||
| Assets Under Management, or AUM | The assets of the funds, partnerships and accounts to which Apollo provides investment management, advisory, or certain other investment-related services, including, without limitation, capital that such funds, partnerships and accounts have the right to call from investors pursuant to capital commitments. Our AUM equals the sum of: 1. the NAV, plus used or available leverage and/or capital commitments, or gross assets plus capital commitments, of the credit and certain equity funds, partnerships and accounts for which we provide investment management or advisory services, other than certain CLOs, CDOs, and certain perpetual capital vehicles, which have a fee-generating basis other than the mark-to-market value of the underlying assets; for certain perpetual capital vehicles in credit, gross asset value plus available financing capacity; 2. the fair value of the investments of the equity and certain credit funds, partnerships and accounts Apollo manages or advises, plus the capital that such funds, partnerships and accounts are entitled to call from investors pursuant to capital commitments, plus portfolio level financings; 3. the gross asset value associated with the reinsurance investments of the portfolio company assets Apollo manages or advises; and 4. the fair value of any other assets that Apollo manages or advises for the funds, partnerships and accounts to which Apollo provides investment management, advisory, or certain other investment-related services, plus unused credit facilities, including capital commitments to such funds, partnerships and accounts for investments that may require pre-qualification or other conditions before investment plus any other capital commitments to such funds, partnerships and accounts available for investment that are not otherwise included in the clauses above. Apollo’s AUM measure includes Assets Under Management for which Apollo charges either nominal or zero fees. Apollo’s AUM measure also includes assets for which Apollo does not have investment discretion, including certain assets for which Apollo earns only investment-related service fees, rather than management or advisory fees. Apollo’s definition of AUM is not based on any definition of Assets Under Management contained in its governing documents or in any management agreements of the funds Apollo manages. Apollo considers multiple factors for determining what should be included in its definition of AUM. Such factors include but are not limited to (1) Apollo’s ability to influence the investment decisions for existing and available assets; (2) Apollo’s ability to generate income from the underlying assets in the funds it manages; and (3) the AUM measures that Apollo uses internally or believes are used by other investment managers. Given the differences in the investment strategies and structures among other alternative investment managers, Apollo’s calculation of AUM may differ from the calculations employed by other investment managers and, as a result, this measure may not be directly comparable to similar measures presented by other investment managers. Apollo’s calculation also differs from the manner in which its affiliates registered with the SEC report “Regulatory Assets Under Management” on Form ADV and Form PF in various ways. Apollo uses AUM, Gross capital deployment and Dry powder as performance measurements of its investment activities, as well as to monitor fund size in relation to professional resource and infrastructure needs. | ||||
| Athene | Athene Holding Ltd. (“Athene Holding” or “AHL”, together with its subsidiaries, “Athene”), a leading financial services company specializing in retirement services that issues, reinsures and acquires retirement savings products designed for the increasing number of individuals and institutions seeking to fund retirement needs, and to which Apollo, through its consolidated subsidiary ISG, provides asset management and advisory services. | ||||
5
| Athora | Athora Holding, Ltd. (“Athora Holding”, together with its subsidiaries, “Athora”), a strategic liabilities platform that acquires or reinsures blocks of insurance business in the German and broader European life insurance market (collectively, the “Athora Accounts”). Apollo, through ISGI, provides investment advisory services to Athora. Athora Non-Sub-Advised Assets includes the Athora assets which are managed by Apollo but not sub-advised by Apollo nor invested in Apollo funds or investment vehicles. Athora Sub-Advised includes assets which the Company explicitly sub-advises as well as those assets in the Athora Accounts which are invested directly in funds and investment vehicles Apollo manages. | ||||
| Atlas | An equity investment of AAA and refers to certain subsidiaries of Atlas Securitized Products Holdings LP | ||||
| AUM with Future Management Fee Potential | The committed uninvested capital portion of total AUM not currently earning management fees. The amount depends on the specific terms and conditions of each fund. | ||||
| AUSA | Athene USA Corporation | ||||
| Bermuda RBC | The risk-based capital ratio of Athene’s non-U.S. reinsurance subsidiaries calculated using Bermuda Capital and applying NAIC risk-based capital factors on an aggregate basis, excluding U.S. subsidiaries which are included within Athene’s U.S. RBC Ratio. | ||||
| BMA | Bermuda Monetary Authority | ||||
| Bridge | Bridge Investment Group Holdings Inc. | ||||
| Bridge funds | Funds, vehicles and accounts managed by subsidiaries of Bridge | ||||
| Bridge TRA | The tax receivable agreement with certain equity holders of Bridge | ||||
| Capital solutions fees and other, net | Primarily includes transaction fees earned by Apollo Capital Solutions (“ACS”) related to underwriting, structuring, arrangement and placement of debt and equity securities, and syndication for funds managed by Apollo, portfolio companies of funds managed by Apollo, and third parties. Capital solutions fees and other, net also includes advisory fees for the ongoing monitoring of portfolio operations, directors' fees, as well as fees and earnings related to property management activities. These fees also include certain offsetting amounts, including reductions in management fees related to a percentage of these fees recognized (“management fee offset”), and other additional revenue sharing arrangements, including with certain subsidiaries and other affiliates. | ||||
| CDO | Collateralized debt obligation | ||||
| CIBC | Canadian Imperial Bank of Commerce | ||||
| Class A shares | Class A common stock, $0.00001 par value per share, of AAM prior to the Mergers. | ||||
| CLO | Collateralized loan obligation | ||||
| CMBS | Commercial mortgage-backed securities | ||||
| CML | Commercial mortgage loan | ||||
| Contributing Partners | Partners and their related parties (other than Messrs. Leon Black, Joshua Harris and Marc Rowan, our co-founders) who indirectly beneficially owned AOG units. | ||||
| Consolidated RBC | The consolidated risk-based capital ratio of Athene’s non-U.S. reinsurance and U.S. insurance subsidiaries calculated by aggregating U.S. RBC and Bermuda RBC, with immaterial adjustments for net assets at the holding company. | ||||
| Cost of funds | Cost of funds includes liability costs related to cost of crediting on deferred annuities, including, with respect to Athene's indexed annuities, option costs, and institutional costs related to institutional products, as well as other liability costs, but does not include the proportionate share of the ACRA cost of funds associated with the non-controlling interests. Other liability costs include DAC, DSI and VOBA amortization, certain market risk benefit costs, the cost of liabilities on products other than deferred annuities and institutional products, premiums, product charges, excluding market value adjustments, and certain other revenues. Athene includes the costs related to business added through assumed reinsurance transactions but excludes the costs on business related to ceded reinsurance transactions. Cost of funds is computed as the total liability costs divided by the average net invested assets for the relevant period, presented on an annualized basis for interim periods. | ||||
| Credit Strategies | Apollo Credit Strategies Master Fund Ltd., together with its feeder funds | ||||
| CS | Credit Suisse AG | ||||
| DAC | Deferred acquisition costs | ||||
| Deferred annuities | Fixed indexed annuities, annual reset annuities, multi-year guaranteed annuities and registered index-linked annuities | ||||
| Dry Powder | The amount of capital available for investment or reinvestment subject to the provisions of the applicable limited partnership agreements or other governing agreements of the funds, partnerships and accounts we manage. Dry powder excludes uncalled commitments which can only be called for fund fees and expenses and commitments from perpetual capital vehicles. | ||||
| DSI | Deferred sales inducement | ||||
| EPF Funds | Apollo European Principal Finance Fund, L.P., Apollo European Principal Finance Fund II (Dollar A), L.P., EPF III, and EPF IV, together with their parallel funds and alternative investment vehicles | ||||
| EPF III | Apollo European Principal Finance Fund III (Dollar A), L.P., together with its parallel funds and alternative investment vehicles | ||||
| EPF IV | Apollo European Principal Finance Fund IV (Dollar A), L.P., together with its parallel funds and alternative investment vehicles | ||||
6
| Equity Plan | Refers collectively to the Company’s 2019 Omnibus Equity Incentive Plan and the Company’s 2019 Omnibus Equity Incentive Plan for Estate Planning Vehicles. | ||||
| FABN | Funding agreement backed notes | ||||
| FABR | Funding agreement backed repurchase agreement | ||||
| FASB | Financial Accounting Standards Board | ||||
| FCI Funds | Financial Credit Investment I, L.P., Financial Credit Investment II, L.P., together with its feeder funds, Financial Credit Investment Fund III L.P., and Financial Credit Investment IV, L.P., together with its feeder funds | ||||
| Fee-Generating AUM | Fee-Generating AUM consists of assets of the funds, partnerships and accounts to which we provide investment management, advisory, or certain other investment-related services and on which we earn management fees, monitoring fees or other investment-related fees pursuant to management or other fee agreements on a basis that varies among the Apollo funds, partnerships and accounts. Management fees are normally based on “net asset value,” “gross assets,” “adjusted par asset value,” “adjusted cost of all unrealized portfolio investments,” “capital commitments,” “adjusted assets,” “stockholders’ equity,” “invested capital” or “capital contributions,” each as defined in the applicable management agreement. Monitoring fees, also referred to as advisory fees, with respect to the structured portfolio company investments of the funds, partnerships and accounts we manage or advise, are generally based on the total value of such structured portfolio company investments, which normally includes leverage, less any portion of such total value that is already considered in Fee-Generating AUM. | ||||
| Fee Related Earnings, or FRE | Component of Segment Income that is used to assess the performance of the Asset Management segment. FRE is the sum of (i) management fees, (ii) capital solutions and other related fees, (iii) fee-related performance fees from indefinite term vehicles, that are measured and received on a recurring basis and not dependent on realization events of the underlying investments, excluding performance fees from Athene and performance fees from origination platforms dependent on capital appreciation, and (iv) other income, net, less (a) fee-related compensation, excluding equity-based compensation, (b) non-compensation expenses incurred in the normal course of business, (c) placement fees and (d) non-controlling interests in the management companies of certain funds the Company manages. | ||||
| FIA | Fixed indexed annuity, which is an insurance contract that earns interest at a crediting rate based on a specified index on a tax-deferred basis | ||||
| Fixed annuities | FIAs together with fixed rate annuities | ||||
| Former Managing Partners | Messrs. Leon Black, Joshua Harris and Marc Rowan collectively and, when used in reference to holdings of interests in Apollo or AP Professional Holdings, L.P. includes certain related parties of such individuals | ||||
| Freedom Parent Holdings | Freedom Parent Holdings, L.P. | ||||
| GDP | Gross Domestic Product | ||||
Gross capital deployment | The gross capital that has been invested by the funds and accounts we manage during the relevant period, but excludes certain investment activities primarily related to hedging and cash management functions at the firm. Gross capital deployment is not reduced or netted down by sales or refinancings, and takes into account leverage used by the funds and accounts we manage in gaining exposure to the various investments that they have made. | ||||
| GLWB | Guaranteed lifetime withdrawal benefit | ||||
| GMDB | Guaranteed minimum death benefit | ||||
| Gross IRR of accord series, ADIP funds and the European principal finance funds | The annualized return of a fund based on the actual timing of all cumulative fund cash flows before management fees, performance fees allocated to the general partner and certain other expenses. Calculations may include certain investors that do not pay fees. The terminal value is the net asset value as of the reporting date. Non-U.S. dollar denominated (“USD”) fund cash flows and residual values are converted to USD using the spot rate as of the reporting date. In addition, gross IRRs at the fund level will differ from those at the individual investor level as a result of, among other factors, timing of investor-level inflows and outflows. Gross IRR does not represent the return to any fund investor. | ||||
| Gross IRR of a traditional private equity or hybrid value fund | The cumulative investment-related cash flows (i) for a given investment for the fund or funds which made such investment, and (ii) for a given fund, in the relevant fund itself (and not any one investor in the fund), in each case, on the basis of the actual timing of investment inflows and outflows (for unrealized investments assuming disposition on December 31, 2025 or other date specified) aggregated on a gross basis quarterly, and the return is annualized and compounded before management fees, performance fees and certain other expenses (including interest incurred by the fund itself) and measures the returns on the fund’s investments as a whole without regard to whether all of the returns would, if distributed, be payable to the fund’s investors. In addition, gross IRRs at the fund level will differ from those at the individual investor level as a result of, among other factors, timing of investor-level inflows and outflows. Gross IRR does not represent the return to any fund investor. | ||||
7
| Gross IRR of infrastructure funds | The cumulative investment-related cash flows in the fund itself (and not any one investor in the fund), on the basis of the actual timing of cash inflows and outflows (for unrealized investments assuming disposition on December 31, 2025 or other date specified) starting on the date that each investment closes, and the return is annualized and compounded before management fees, performance fees, and certain other expenses (including interest incurred by the fund itself) and measures the returns on the fund’s investments as a whole without regard to whether all of the returns would, if distributed, be payable to the fund’s investors. Non-USD fund cash flows and residual values are converted to USD using the spot rate as of the reporting date. In addition, gross IRRs at the fund level will differ from those at the individual investor level as a result of, among other factors, timing of investor-level inflows and outflows. Gross IRR does not represent the return to any fund investor. | ||||
| HoldCo | Apollo Global Management, Inc. (f/k/a Tango Holdings, Inc.) | ||||
| HVF I | Apollo Hybrid Value Fund, L.P., together with its parallel funds and alternative investment vehicles | ||||
| HVF II | Apollo Hybrid Value Fund II, L.P., together with its parallel funds and alternative investment vehicles | ||||
| HVF III | Apollo Hybrid Value Fund III, L.P., together with its parallel funds and alternative investment vehicles | ||||
| Inflows | (i) At the individual strategy level, subscriptions, commitments, and other increases in available capital, such as acquisitions or leverage, net of inter-strategy transfers, and (ii) on an aggregate basis, the sum of inflows across the credit and equity investing strategies. | ||||
| IPO | Initial Public Offering | ||||
| ISG | Apollo Insurance Solutions Group LP | ||||
| ISGI | Refers collectively to Apollo Asset Management Europe LLP, a subsidiary of AAM (“AAME”) and Apollo Asset Management PC LLP, a wholly-owned subsidiary of AAME (“AAME PC”) | ||||
| Management Fee Offset | Under the terms of the limited partnership agreements for certain funds, the management fee payable by the funds may be subject to a reduction based on a certain percentage of such advisory and transaction fees, net of applicable broken deal costs. | ||||
| Market risk benefits | Guaranteed lifetime withdrawal benefits and guaranteed minimum death benefits | ||||
| Mergers | Completion of the previously announced merger transactions pursuant to the Merger Agreement | ||||
| Merger Agreement | The Agreement and Plan of Merger dated as of March 8, 2021 by and among AAM, AGM, AHL, Blue Merger Sub, Ltd., a Bermuda exempted company, and Green Merger Sub, Inc., a Delaware corporation. | ||||
| Merger Date | January 1, 2022 | ||||
| MFIC | MidCap Financial Investment Corporation (f/k/a Apollo Investment Corporation or “AINV”) | ||||
| MidCap FinCo | MidCap FinCo LLC, together with its subsidiaries | ||||
| Modco | Modified coinsurance | ||||
| NAIC | National Association of Insurance Commissioners | ||||
| NAV | Net Asset Value | ||||
| Net invested assets | Represent the investments that directly back Athene's net reserve liabilities as well as surplus assets. Net invested assets include Athene’s (a) total investments on the consolidated statements of financial condition, with available-for-sale securities, trading securities and mortgage loans at cost or amortized cost, excluding derivatives, (b) cash and cash equivalents and restricted cash, (c) investments in related parties, (d) accrued investment income, (e) VIE and VOE assets, liabilities and non-controlling interest adjustments, (f) net investment payables and receivables, (g) policy loans ceded (which offset the direct policy loans in total investments) and (h) an adjustment for the allowance for credit losses. Net invested assets exclude the derivative collateral offsetting the related cash positions. Athene includes the investments supporting assumed funds withheld and modco agreements and excludes the investments related to ceded reinsurance transactions in order to match the assets with the income received. Net invested assets include Athene’s economic ownership of ACRA investments but do not include the investments associated with the non-controlling interests. | ||||
| Net investment earned rate | Computed as income from Athene’s net invested assets, excluding the proportionate share of the ACRA net investment income associated with the non-controlling interests, divided by the average net invested assets for the relevant period, presented on an annualized basis for interim periods. | ||||
| Net investment spread | Net investment spread measures Athene’s investment performance plus its strategic capital management fees less its total cost of funds, presented on an annualized basis for interim periods. | ||||
| Net IRR of accord series, ADIP funds and the European principal finance funds | The annualized return of a fund after management fees, performance fees allocated to the general partner and certain other expenses, calculated on investors that pay such fees. The terminal value is the net asset value as of the reporting date. Non-USD fund cash flows and residual values are converted to USD using the spot rate as of the reporting date. In addition, net IRR at the fund level will differ from that at the individual investor level as a result of, among other factors, timing of investor-level inflows and outflows. Net IRR does not represent the return to any fund investor. | ||||
8
| Net IRR of a traditional private equity or the hybrid value funds | The gross IRR applicable to a fund, including returns for related parties which may not pay fees or performance fees, net of management fees, certain expenses (including interest incurred or earned by the fund itself) and realized performance fees all offset to the extent of interest income, and measures returns at the fund level on amounts that, if distributed, would be paid to investors of the fund. The timing of cash flows applicable to investments, management fees and certain expenses, may be adjusted for the usage of a fund’s subscription facility. To the extent that a fund exceeds all requirements detailed within the applicable fund agreement, the estimated unrealized value is adjusted such that a percentage of up to 20.0% of the unrealized gain is allocated to the general partner of such fund, thereby reducing the balance attributable to fund investors. In addition, net IRR at the fund level will differ from that at the individual investor level as a result of, among other factors, timing of investor-level inflows and outflows. Net IRR does not represent the return to any fund investor. | ||||
| Net IRR of infrastructure funds | The cumulative cash flows in a fund (and not any one investor in the fund), on the basis of the actual timing of cash inflows received from and outflows paid to investors of the fund (assuming the ending net asset value as of the reporting date or other date specified is paid to investors), excluding certain non-fee and non-performance fee bearing parties, and the return is annualized and compounded after management fees, performance fees, and certain other expenses (including interest incurred by the fund itself) and measures the returns to investors of the fund as a whole. Non-USD fund cash flows and residual values are converted to USD using the spot rate as of the reporting date. In addition, net IRR at the fund level will differ from that at the individual investor level as a result of, among other factors, timing of investor-level inflows and outflows. Net IRR does not represent the return to any fund investor. | ||||
| Net reserve liabilities | Represent Athene's policyholder and institutional liability obligations net of reinsurance and used to analyze the costs of its liabilities. Net reserve liabilities include Athene’s (a) interest sensitive contract liabilities, (b) future policy benefits, (c) net market risk benefits, (d) long-term repurchase obligations, (e) dividends payable to policyholders and (f) other policy claims and benefits, offset by reinsurance recoverable, excluding policy loans ceded. Net reserve liabilities include Athene’s economic ownership of ACRA reserve liabilities but do not include the reserve liabilities associated with the non-controlling interests. Net reserve liabilities are net of the ceded liabilities to third-party reinsurers as the costs of the liabilities are passed to such reinsurers and, therefore, Athene has no net economic exposure to such liabilities, assuming its reinsurance counterparties perform under the agreements. Net reserve liabilities include the underlying liabilities assumed through modco reinsurance agreements in order to match the liabilities with the expenses incurred. | ||||
| Non-Fee-Generating AUM | AUM that does not produce management fees or monitoring fees. This measure generally includes the following: (i) fair value above invested capital for those funds that earn management fees based on invested capital; (ii) net asset values related to general partner and co-investment interests; (iii) unused credit facilities; (iv) available commitments on those funds that generate management fees on invested capital; (v) structured portfolio company investments that do not generate monitoring fees; and (vi) the difference between gross asset and net asset value for those funds that earn management fees based on net asset value. | ||||
| NYC UBT | New York City Unincorporated Business Tax | ||||
| NYSE | New York Stock Exchange | ||||
Origination | Represents (i) capital that has been invested in new equity, debt or debt-like investments by Apollo's equity and credit strategies (whether purchased by funds and accounts managed by Apollo, or syndicated to third parties) where Apollo or one of Apollo's origination platforms has sourced, negotiated, or significantly affected the commercial terms of the investment; (ii) new capital pools formed by debt issuances, including CLOs; and (iii) net purchases of certain assets by the funds and accounts we manage that we consider to be private, illiquid, and hard to access assets and which the funds and accounts otherwise may not be able to meaningfully access. Origination generally excludes any issuance of debt or debt-like investments by the portfolio companies of the funds we manage. | ||||
| Other operating expenses within the Principal Investing segment | Expenses incurred in the normal course of business and includes allocations of non-compensation expenses related to managing the business. | ||||
| Other operating expenses within the Retirement Services segment | Expenses incurred in the normal course of business inclusive of compensation and non-compensation expenses, excluding the proportionate share of the ACRA operating expenses associated with the non-controlling interests. | ||||
| Payout annuities | Annuities with a current cash payment component, which consist primarily of single premium immediate annuities, supplemental contracts and structured settlements. | ||||
| PCD | Purchased Credit Deteriorated Investments | ||||
| Performance allocations, Performance fees, Performance revenues, Incentive fees and Incentive income | The interests granted to Apollo by a fund managed by Apollo that entitle Apollo to receive allocations, distributions or fees which are based on the performance of such fund or its underlying investments. | ||||
9
| Performance Fee-Eligible AUM | AUM that may eventually produce performance fees. All funds for which we are entitled to receive a performance fee allocation or incentive fee are included in Performance Fee-Eligible AUM, which consists of the following: (i) “Performance Fee-Generating AUM”, which refers to invested capital of the funds, partnerships and accounts we manage, advise, or to which we provide certain other investment-related services, that is currently above its hurdle rate or preferred return, and profit of such funds, partnerships and accounts is being allocated to, or earned by, the general partner in accordance with the applicable limited partnership agreements or other governing agreements; (ii) “AUM Not Currently Generating Performance Fees”, which refers to invested capital of the funds, partnerships and accounts we manage, advise, or to which we provide certain other investment-related services, that is currently below its hurdle rate or preferred return; and (iii) “Uninvested Performance Fee-Eligible AUM”, which refers to capital of the funds, partnerships and accounts we manage, advise, or to which we provide certain other investment-related services, that is available for investment or reinvestment subject to the provisions of applicable limited partnership agreements or other governing agreements, which capital is not currently part of the NAV or fair value of investments that may eventually produce performance fees allocable to, or earned by, the general partner. | ||||
| Perpetual capital | Assets under management of certain vehicles with an indefinite duration, which assets may only be withdrawn under certain conditions or subject to certain limitations, including satisfying required hold periods or percentage limits on the amounts that may be redeemed over a particular period. The investment management, advisory or other service agreements with our perpetual capital vehicles may be terminated under certain circumstances. | ||||
| Principal Investing Income, or PII | Component of Segment Income that is used to assess the performance of the Principal Investing segment. For the Principal Investing segment, PII is the sum of (i) realized performance fees, including certain realizations received in the form of equity, (ii) realized investment income, less (x) realized principal investing compensation expense, excluding expense related to equity-based compensation, and (y) certain corporate compensation and non-compensation expenses. | ||||
| Principal investing compensation | Realized performance compensation, distributions related to investment income and dividends, and includes allocations of certain compensation expenses related to managing the business. | ||||
| Policy loan | A loan to a policyholder under the terms of, and which is secured by, a policyholder’s policy. | ||||
| Realized Value | All cash investment proceeds received by the relevant Apollo fund, including interest and dividends, but does not give effect to management fees, expenses, incentive compensation or performance fees to be paid by such Apollo fund. | ||||
| Redding Ridge | Redding Ridge Asset Management, LLC and its subsidiaries, which is a standalone, self-managed asset management business established in connection with risk retention rules that manages CLOs and retains the required risk retention interests. | ||||
| Redding Ridge Holdings | Redding Ridge Holdings LP | ||||
| Remaining Cost | Total Invested Capital, reduced for any return of capital proceeds received to date. | ||||
| RMBS | Residential mortgage-backed securities | ||||
| RML | Residential mortgage loan | ||||
| RSUs | Restricted share units | ||||
| SIA | Strategic investment account | ||||
| SPACs | Special purpose acquisition companies | ||||
| Spread Related Earnings, or SRE | Component of Segment Income that is used to assess the performance of the Retirement Services segment, excluding certain market volatility, which consists of investment gains (losses), net of offsets and non-operating change in insurance liabilities and related derivatives, and certain expenses related to integration, restructuring, and equity-based compensation, as well as other items. For the Retirement Services segment, SRE equals the sum of (i) the net investment earnings on Athene’s net invested assets and (ii) management fees received on business managed for others, less (x) cost of funds, (y) operating expenses excluding equity-based compensation and (z) financing costs, including interest expense and preferred dividends, if any, paid to Athene preferred stockholders. | ||||
| Surplus assets | Assets in excess of Athene’s policyholder and institutional obligations, determined in accordance with the applicable domiciliary jurisdiction’s statutory accounting principles. | ||||
| S3 Equity and Hybrid Solutions | Apollo S3 Equity and Hybrid Solutions Fund, L.P. | ||||
| Total Invested Capital | The aggregate cash invested by the relevant Apollo fund and includes capitalized costs relating to investment activities, if any, but does not give effect to cash pending investment or available for reserves and excludes amounts, if any, invested on a financed basis with leverage facilities | ||||
| Total Value | The sum of the total Realized Value and Unrealized Value of investments | ||||
10
| Traditional private equity funds | Apollo Investment Fund I, L.P. (“Fund I”), AIF II, L.P. (“Fund II”), a mirrored investment account established to mirror Fund I and Fund II for investments in debt securities (“MIA”), Apollo Investment Fund III, L.P. (together with its parallel funds, “Fund III”), Apollo Investment Fund IV, L.P. (together with its parallel fund, “Fund IV”), Apollo Investment Fund V, L.P. (together with its parallel funds and alternative investment vehicles, “Fund V”), Apollo Investment Fund VI, L.P. (together with its parallel funds and alternative investment vehicles, “Fund VI”), Apollo Investment Fund VII, L.P. (together with its parallel funds and alternative investment vehicles, “Fund VII”), Apollo Investment Fund VIII, L.P. (together with its parallel funds and alternative investment vehicles, “Fund VIII”), Apollo Investment Fund IX, L.P. (together with its parallel funds and alternative investment vehicles, “Fund IX”) and Apollo Investment Fund X, L.P. (together with its parallel funds and alternative investment vehicles, “Fund X”). | ||||
| U.S. GAAP | Generally accepted accounting principles in the United States of America | ||||
| U.S. RBC | The CAL RBC ratio for AAIA, Athene's U.S. insurance company | ||||
| U.S. Treasury | United States Department of the Treasury | ||||
| Unlocking | Assumption unlocking is the annual process of revising current assumptions that impact the projection of benefits to align with recent experience. This may result in an immediate impact that may be favorable, resulting in a reduction in reserves or an increase in VOBA, or unfavorable, resulting in an increase in reserves or a decrease in VOBA. | ||||
| Unrealized Value | The fair value consistent with valuations determined in accordance with GAAP, for investments not yet realized and may include payments in kind, accrued interest and dividends receivable, if any, and before the effect of certain taxes. In addition, amounts include committed and funded amounts for certain investments. | ||||
| Venerable | Venerable Holdings, Inc., together with its subsidiaries | ||||
| VIAC | Venerable Insurance and Annuity Company | ||||
| VIE | Variable interest entity | ||||
| Vintage Year | The year in which a fund’s final capital raise occurred, or, for certain funds, the year of a fund’s effective date or the year in which a fund’s investment period commences pursuant to its governing agreements. | ||||
| VOBA | Value of business acquired | ||||
| VOE | Voting interest entity | ||||
| WACC | Weighted average cost of capital | ||||
11
PART I
ITEM 1. BUSINESS
Index to Business
12
Overview
Founded in 1990, Apollo is a high-growth, global alternative asset manager and a retirement services provider. Apollo conducts its business primarily in the U.S. through the following three reportable segments: Asset Management, Retirement Services and Principal Investing. These business segments are differentiated based on the investment services they provide as well as varying investing strategies.
Our Businesses
Asset Management
Our Asset Management segment focuses on credit and equity investing strategies. These strategies reflect the range of investment capabilities across our platform based on relative risk and return. As an asset manager, we earn fees for providing investment management services and expertise to our client base. The amount of fees charged for managing these assets depends on the underlying investment strategy, liquidity profile, and, ultimately, our ability to generate returns for our clients. We also earn capital solutions fees as part of our growing capital solutions business and as part of monitoring and deployment activity alongside our sizable private equity franchise. After expenses, we call the resulting earning stream “Fee Related Earnings” or “FRE”, which represents the primary performance measure for the Asset Management segment. As of December 31, 2025, we had total AUM of $938.4 billion.
Our Asset Management segment had a team of approximately 4,130 employees, including 600 employees of Bridge as of December 31, 2025, with offices throughout the world. This team possesses a broad range of transaction, financial, managerial and investment skills. We operate our asset management business in a highly integrated manner, which we believe distinguishes us from other alternative asset managers. Our investment teams frequently collaborate across disciplines and we believe that this collaboration enables our clients to more successfully invest across a company’s capital structure. Our objective is to achieve superior long-term risk-adjusted returns for our clients. The majority of the investment funds we manage are designed to invest capital over a period of several years from inception, thereby allowing us to seek to generate attractive long-term returns throughout economic cycles. We have a contrarian, value-oriented investment approach, emphasizing downside protection, and the preservation of capital. We believe our contrarian investment approach is reflected in a number of ways, including:
•our willingness to pursue investments in industries that our competitors typically avoid;
•the often complex structures employed in some of the investments of our funds;
•our experience investing during periods of uncertainty or distress in the economy or financial markets; and
•our willingness to undertake transactions that have substantial business, regulatory or legal complexity.
We have applied this investment philosophy to identify what we believe are attractive investment opportunities, deploy capital across the balance sheet of industry leading, or “franchise,” businesses and create value throughout economic cycles.
Credit
Credit is our largest asset management strategy with $749.2 billion of AUM as of December 31, 2025. Our credit strategy spans third-party strategies and Apollo’s retirement services business across four main investment pillars: direct origination, asset-backed finance, opportunistic credit and multi-credit. Our credit strategy focuses on generating excess returns through high-quality credit underwriting and origination. Beyond participation in the traditional issuance and secondary credit markets, through our origination platforms and corporate solutions capabilities we seek to originate attractive and safe-yielding assets for the investors in the funds we manage. The investment portfolios of the credit-oriented funds Apollo manages include several asset classes as described below as of December 31, 2025:
•Direct Origination ($302.1 billion of AUM), includes large corporate direct origination, middle-market direct lending, and investment grade and performing credit mandates across managed accounts and CLOs. Apollo’s direct origination platform is built to offer companies a variety of financing solutions across investment grade and below investment grade, and public and private markets. The strategy is focused on first lien senior secured investments and is diversified across fixed and floating rate issuance, issuer type and sector;
13
•Asset-Backed Finance ($282.7 billion of AUM), includes instruments that are supported first by the contractual cash flows of a pool of assets, and second by the liquidation value of those assets. Asset-backed finance encompasses diverse credit types, such as mortgages, consumer credit, receivables, aircraft lending, and inventory finance, in both whole loan and bond format across the capital structure;
•Opportunistic Credit ($50.0 billion of AUM), seeks to optimize both near- and longer-term relative value across market cycles by capitalizing on investment opportunities across the credit spectrum, spanning private and public markets as well as corporate and asset-backed credit. Using a flexible approach, the objective of the opportunistic credit strategy is to identify market inefficiencies and unique opportunities to generate excess returns; and
•Multi-Credit ($40.9 billion of AUM), targets investment grade and high yield performing credit, including income-oriented, senior loan and bond corporate credit, as well as asset-backed finance investments. The multi-credit strategy allocates capital across both public and private markets, seeking to generate enhanced yield and attractive risk-adjusted returns while prioritizing downside protection.
Equity
Our equity strategy represents $189.2 billion of AUM as of December 31, 2025. Across our equity strategy, we focus on creative structuring and sourcing while working with the management teams of the portfolio companies of Apollo managed funds to help transform and grow their businesses. Our flexible mandate and purchase price discipline allow us to embrace complexity and seek attractive outcomes for our stakeholders. Our equity team has experience across sectors, industries, and geographies spanning its private equity, hybrid value, secondaries equity, AAA, real estate equity, infrastructure and clean transition equity strategies. We have consistently produced attractive long-term investment returns in the traditional private equity funds we manage, generating a 39% gross IRR and a 24% net IRR on a compound annual basis from inception through December 31, 2025. Our equity strategy focuses on several investing strategies as described below as of December 31, 2025:
•Corporate Private Equity ($78.8 billion of AUM), which refers to our investment strategy focused on creating investment opportunities with attractive risk-adjusted returns across industries and geographies and throughout market cycles, utilizing our value-oriented investment approach. Through this strategy, we seek to build portfolios of investments that are created at meaningful discounts to comparable market multiples, thereby resulting in what we believe are portfolios focused on capital preservation. The transactions in this strategy include opportunistic buyouts, corporate carveouts and deleveraging investments. Corporate Private Equity also includes our secondaries equity strategy (“Secondaries”), which offers a comprehensive set of secondary and liquidity solutions;
•Hybrid Value ($17.7 billion of AUM), which refers to our strategy that focuses on investments that share features with both private credit and traditional private equity investments. Hybrid Value offers creative, partnership-driven solutions to counterparties seeking to fund growth initiatives, acquisitions, liquidity events for shareholders and balance sheet deleveraging. By employing a comprehensive and flexible investment approach, the hybrid value strategy aims to generate equity-like returns with credit-like downside protection across market cycles;
•AAA ($25.6 billion of AUM), which offers investors access to Apollo’s flagship private market strategy in a perpetual capital, semi-liquid structure. The strategy seeks to deliver consistent, equity-like returns with lower risk and more downside protection than both public equity and traditional private equity buyout strategies. AAA’s portfolio encompasses several investment strategies, such as core private equity, structured equity, traditional private equity, private credit, secondaries, and real assets;
•Real Estate Equity ($47.9 billion of AUM), which refers to our real estate income strategies encompassing core plus and net lease investments in the non-traded REIT and public and private real estate funds we manage, as well as our value add and opportunistic investments strategies that target investments in real estate assets, portfolios and platforms in regionally focused private funds in both the U.S. and Asia. In September 2025, we completed the acquisition of Bridge, a real estate fund manager with a core focus on residential and industrial properties in the U.S., further expanding our real estate equity product offerings. Our real estate strategy is supported by our vertically integrated approach to asset management, which provides a full suite of services spanning investment management and transaction advisory services, as well as property management, leasing, development and construction management functions and is led by specialized and experienced real estate professionals who bring deep sector knowledge across economic cycles; and
14
•Infrastructure and Clean Transition Equity ($21.6 billion of AUM), which refers to the investment strategy of certain funds managed by Apollo that focus on investing in a broad range of infrastructure assets, including digital infrastructure, energy transition, transportation/logistics and sustainable living, as well as our clean transition equity strategy, our dedicated energy transition and decarbonization-focused private equity strategy. This investing strategy also includes the legacy natural resources-focused private equity funds we manage.
Perpetual Capital
Included within our investing strategies above is $535.6 billion of perpetual capital, out of the $938.4 billion of AUM as of December 31, 2025. Perpetual capital includes, without limitation, certain assets in our credit strategy, including assets relating to publicly traded and non-traded vehicles, certain origination platform assets and assets managed for certain of our retirement services clients. Perpetual capital assets may be withdrawn under certain circumstances and utilize a range of investment strategies, including those described previously.
Athene
Apollo’s asset management business, through its consolidated subsidiary, ISG, provides a full suite of services for Athene’s investment portfolio, including direct investment management, asset allocation, mergers and acquisitions asset diligence, and certain operational support services, including investment compliance, tax, legal and risk management support. See “Item 1. Business—Our Businesses—Retirement Services” for further details regarding Athene’s retirement services business. As of December 31, 2025, Apollo managed or advised $392.2 billion of AUM, of which $386.5 billion was Fee-Generating AUM, in accounts owned by or related to Athene (“Athene Accounts”).
Athora
Apollo’s asset management business, through its consolidated subsidiary, ISGI, provides investment advisory services to certain portfolio companies of Apollo funds and Athora, a strategic liabilities platform that acquires or reinsures blocks of insurance business in the German and broader European life insurance market (collectively, the “Athora Accounts”). As of December 31, 2025, Apollo, through its subsidiaries, managed or advised $57.2 billion of AUM and $55.2 billion of Fee-Generating AUM in Athora Accounts. See note 18 to our consolidated financial statements for details regarding the fee arrangements between the Company and Athora.
Athora Non-Sub-Advised Assets
This category includes the Athora assets that Apollo manages but are not sub-advised by Apollo nor invested in Apollo funds or investment vehicles. We refer to these assets collectively as “Athora Non-Sub-Advised Assets.” Our AUM within the Athora Non-Sub-Advised category totaled $34.7 billion as of December 31, 2025, of which $32.3 billion was Fee-Generating AUM.
Origination
Apollo’s integrated approach to origination is designed to provide scaled, long-term capital across market cycles. Our origination capabilities span asset classes, geographies, and multiple levels of the capital structure enabling us to structure solutions to our clients, including the funds we manage, Athene and third parties.
We originate assets through multiple channels including core credit, origination platforms, high grade capital solutions, and hybrid and equity strategies. For the year ended December 31, 2025, origination volumes were $309 billion, of which core credit and origination platforms represented approximately 45% and 40%, respectively, of total origination volumes.
Core credit origination at Apollo primarily consists of directly originated, predominantly investment-grade assets, including corporate lending and asset-backed finance. We also generate assets through a diversified ecosystem of 16 origination platforms across corporate credit, asset-backed finance, real estate, infrastructure and other private market asset classes. Our origination activities are primarily focused on investment-grade and high-quality credit exposures, with transactions evaluated and structured using Apollo’s disciplined underwriting and risk management frameworks.
15
Origination supports our asset management and retirement services businesses primarily by facilitating capital deployment and portfolio construction. In our asset management business, origination enhances our ability to source assets in line with targeted returns. In our retirement services business, origination supports the creation of assets aligned with the long-duration liabilities. These integrated capabilities allow Apollo to provide flexible, bespoke capital solutions to support evolving financing needs across a range of capital formation clients.
Capital Solutions
Our capital solutions business focuses on (i) sourcing investment opportunities for asset management clients and their respective portfolio investments, (ii) maintaining relationships with the capital markets community in an effort to help clients and their respective portfolio investments to raise debt and equity capital, provide secondary market support and optimize capital structures through creative financing solutions, and (iii) structuring capital solutions in an effort to enhance our ability to syndicate, place, trade or otherwise transfer loans, securities and other financial instruments arising from financings in an effort to drive positive outcomes for our asset management clients and their respective portfolio investments. Our capital solutions business also provides a variety of services with respect to both security and non-security financial instruments, including loans, such as originating, arranging, structuring, syndicating and trading loans and private debt, as well as providing corporate finance advisory services and other similar services.
Capital Formation
Capital formation serves as the foundation to our asset management and retirement services businesses and origination activities. Within our asset management business, over the last 35 years, our capital formation has historically been focused on serving institutional investors through their respective alternatives portfolio allocation. Over time, our capabilities have expanded to address new sources of demand through discrete pools of capital, each encapsulating specific investment objectives, liquidity and other considerations. Capital formation aligns origination and structuring capabilities to support credit and equity investment opportunities for a diverse range of buyers.
We view the capital formation opportunity across the following discrete buyer pools:
•Institutional investors (alternative allocation)
In addition, we are increasingly focused on expanding to:
• Institutional investors (fixed income and equity replacement)
• Individuals
• Insurance (Athene and third-party clients)
• Traditional asset managers
• Defined contribution / 401(k)
Across these pools of capital, we raise, allocate and manage capital across a range of structures, including closed-end funds, open-ended and evergreen vehicles, perpetual capital vehicles, publicly listed entities, insurance and retirement solutions and separately managed accounts. Capital deployment requirements may vary by vehicle structure. For closed-end funds we manage, investors generally provide capital through capital calls once investment opportunities are identified. Open-ended and evergreen vehicles we manage typically accept subscriptions and process redemptions in accordance with their respective governing documents. Perpetual capital vehicles, which represent nearly 60% of total AUM and over 70% of total fee-generating AUM, are highly scalable with the ability to deploy capital on an ongoing basis.
We source capital from a diverse base that includes public and private pension funds, sovereign wealth funds, endowments and foundations, insurance companies, private wealth platforms, family offices, high net worth individuals, other institutional investors, as well as public market investors through certain perpetual capital vehicles. A significant portion of capital raised across our closed-ended strategies has historically come from existing investors.
We maintain a centralized and rigorous investment governance framework that applies across our capital base. This framework includes processes for sourcing and evaluating investment opportunities, conducting due diligence, structuring and negotiating transactions, monitoring portfolio positions and managing investment exits. We have established allocation policies and governance mechanisms designed to allocate investment opportunities among funds, vehicles and managed accounts in a
16
manner consistent with applicable governing documents and investment objectives. Investment committees for the relevant funds, vehicles or accounts we manage review and approve investment decisions.
Our investment professionals are responsible for the end-to-end investment process and, where applicable, may commit capital alongside investors. We seek to align our economic interests with those of investors through investment terms, co-investment and governance arrangements. The design and management of each pool of capital reflects its investor base, regulatory constraints, liquidity profile and the investment strategy.
Within our retirement services business, capital formation is driven by the origination of long-duration, regulated capital aligned with liability profiles, liquidity characteristics and regulatory capital requirements. Athene generates recurring premium inflows through the issuance of retirement and savings products designed to reflect their long-term nature, regulatory requirements and targeted risk and return objectives. These activities are supported by Apollo’s origination, structuring and investment capabilities.
To support growth, flexibility and capital deployment at scale, Athene supplements its capital with dedicated, long-duration third-party capital through ACRA. Capital deployment across Athene’s balance sheet and third-party capital vehicles is subject to Athene’s internal capital models, regulatory requirements and transaction approval processes, and is governed under a centralized framework intended to align policyholder interests and third-party investor capital with Athene and Apollo’s investment discipline.
General Partner and Professionals Investments and Co-Investments
General Partner Investments
Certain management companies, general partners and co-invest vehicles are committed to contribute to the funds we manage and their affiliates. As a limited partner, general partner and manager of the Apollo funds, Apollo had unfunded capital commitments as of December 31, 2025 of $553 million.
Professionals Investments
To further align our interests with those of investors in the funds we manage, certain of our professionals have invested their own capital in the funds. Our professionals will either re-invest their performance fees to fund these investments or use cash on hand or funds borrowed from third parties. We generally have not historically charged management fees or performance fees on capital invested by our professionals directly in the funds.
Co-Investments
Investors in many of the funds we manage, as well as certain other investors, may have the opportunity to make co-investments with the funds. Co-investments are investments in portfolio companies or other fund assets generally on the same terms and conditions as those to which the applicable fund is subject.
Retirement Services
Our retirement services business is conducted by Athene, a leading financial services company that specializes in issuing, reinsuring and acquiring retirement savings products designed for the increasing number of individuals and institutions seeking to fund retirement needs. Athene is led by a highly skilled management team with extensive industry experience and has its corporate headquarters located in West Des Moines, Iowa. Our asset management business provides a full suite of services for Athene’s investment portfolio, including direct investment management, asset allocation, mergers and acquisitions asset diligence, and certain operational support services including investment compliance, tax, legal and risk management support. As of December 31, 2025, approximately 2,010 employees supported our Retirement Services segment.
Our retirement services business focuses on generating spread income by combining the two core competencies of (1) sourcing long-term, persistent liabilities and (2) using the global scale and reach of our asset management business to actively source or originate assets with Athene’s preferred risk and return characteristics. Athene’s investment philosophy is to invest a portion of its assets in securities that earn an incremental yield by taking measured liquidity and complexity risk and capitalize on its long-dated, persistent liability profile to prudently achieve higher net investment earned rates, rather than assuming incremental credit risk. A cornerstone of Athene’s investment philosophy is that given the operating leverage inherent in its business,
17
modest investment outperformance can translate to outsized return performance. Because Athene maintains discipline in underwriting attractively priced liabilities, it has the ability to invest in a broad range of high-quality assets to generate attractive earnings.
Our asset management expertise supports the sourcing and underwriting of assets for Athene’s portfolio. Athene is invested in a diverse array of primarily high-grade fixed income assets including corporate bonds, structured securities, and commercial and residential real estate loans, among others. Athene establishes risk thresholds which in turn define risk tolerance across a wide range of factors, including credit risk, liquidity risk, concentration risk and caps on specific asset classes. In addition to other efforts, Athene manages the risk of rising interest rates by strategically allocating a meaningful portion of its investment portfolio into floating rate securities. Athene manages its interest rate risk in a declining rate environment through hedging activity or the issuance of additional floating rate liabilities to lower its overall net floating rate position. Athene also maintains holdings in less interest rate-sensitive investments, including CLOs, non-agency RMBS and various types of structured products, consistent with its strategy of pursuing incremental yield by assuming liquidity and complexity risk, rather than assuming incremental credit risk.
Rather than increase its allocation to higher risk securities to increase yield, Athene pursues the direct origination of high-quality, predominantly senior secured assets, which it believes possess greater alpha-generating qualities than securities that would otherwise be readily available in public markets. These direct origination strategies include investments sourced by (1) affiliated platforms that originate loans to third parties and in which Athene gains exposure directly to the loan or indirectly through its ownership of the origination platform and/or securitizations of assets originated by the origination platform, and (2) our asset management team’s extensive network of direct relationships with predominantly investment-grade counterparties.
Athene uses, and may continue to use, derivatives, including swaps, options, futures and forward contracts, and reinsurance contracts, to hedge risks such as current or future changes in the fair value of assets and liabilities, current or future changes in cash flows and changes in interest rates, equity markets, currency fluctuations and longevity.
Products
Athene principally offers two product lines: annuities and funding agreements.
Annuities
Athene’s primary product line is annuities, which include fixed rate, indexed, payout and group annuities issued in connection with pension group annuity transactions and defined contribution plans.
Fixed Rate Annuities. Fixed rate annuities include annual reset annuities and multi-year guarantee annuities (“MYGA”). Fixed rate annuities earn interest at a set rate (or declared crediting rate), rather than at a rate that may vary based on an index. Fixed rate annual reset annuities have a crediting rate that is typically guaranteed for one year. After such period, Athene has the ability to change the crediting rate at its discretion, generally once annually, to any rate at or above a guaranteed minimum rate. MYGAs are similar to annual reset annuities except that the initial crediting rate is guaranteed for a specified number of years, rather than just one year, before it may be changed at Athene’s discretion. After the initial crediting period, MYGAs can generally be reset annually.
Fixed Indexed Annuities. FIAs are the largest percentage of Athene’s net reserve liabilities. FIAs are a type of insurance contract in which the policyholder makes one or more premium deposits that earn interest, on a tax deferred basis, at a crediting rate based on a specified market index, subject to a contractually specified cap, spread or participation rate. FIAs allow policyholders the possibility of earning interest without significant risk to principal, unless the contract is surrendered during a surrender charge period. A market index tracks the performance of a specific group of stocks or other assets representing a particular segment of the market, or in some cases, an entire market. Athene generally buys options on the indices to which the FIAs are tied to hedge the associated market risk. The cost of the option is priced into the overall economics of the product as an option budget.
Registered Index-Linked Annuities (“RILAs”). RILAs are similar to FIAs in offering the policyholder the opportunity for tax-deferred growth based in part on the performance of a market index. Compared to an FIA, RILAs have the potential for higher returns but also have the potential for risk of loss to principal and related earnings. RILAs provide the ability for the policyholder to participate in the positive performance of certain market indices during a term, limited by a contractually specified cap or adjusted for a contractually specified participation rate. Negative performance of the market indices during a
18
term can result in negative policyholder returns, with contractually specified downside protection typically provided in the form of either a “buffer” or a “floor” to limit the policyholder’s exposure to market loss. A “buffer” is protection from negative exposure up to a certain percentage, such as 10 or 20 percent. A “floor” is protection from negative exposure less than a stated percentage (i.e., the policyholder risks exposure of loss up to the “floor,” but is protected against any loss in excess of this amount).
Payout Annuities. Payout annuities primarily consist of single premium immediate annuities (“SPIA”), supplemental contracts and structured settlements. Payout annuities provide a series of periodic payments for a fixed period of time or for the life of the policyholder, based upon the policyholder’s election at the time of issuance. The amounts, frequency and length of time of the payments are fixed at the outset of the annuity contract. SPIAs are often purchased by persons at or near retirement age who desire a steady stream of payments over a future period of years. Supplemental contracts are typically created upon the conversion of a death claim or the annuitization of a deferred annuity. Structured settlements generally relate to legal settlements.
Athene generates income on fixed rate, indexed and payout annuity products by earning an investment spread, based on the difference between (1) income earned on the investments supporting the liabilities and (2) the cost of funds, including fixed interest credited to customers, option costs on indexed products, the cost of providing guarantees (net of rider fees) and policy issuance, maintenance and distribution costs.
Private Placement Variable Annuities (“PPVA”). PPVAs are not registered with the SEC and currently are only offered by private placement to purchasers meeting the requirements as a qualified purchaser and/or an accredited investor under applicable federal securities laws. Variable annuities allow policyholders to participate directly in the investment experience of the underlying investment vehicles offered through the product. In a variable annuity, the policyholder assumes the full investment risk of the investment options chosen. The product allows the policyholder to allocate their money to a variety of variable separate account divisions that invest in a suite of underlying investment options and the potential to accumulate cash value on a tax-deferred basis. Athene’s PPVA products provide access to a suite of Apollo managed funds and other product offerings with no surrender charges and no GLWB or GMDB features. Athene generates income on its PPVA products by collecting a fee that is a function of the policyholder’s account value.
Income Riders to Fixed Annuity Products. The income riders on Athene’s deferred annuities can be broadly categorized as either guaranteed or participating. Guaranteed income riders provide policyholders with a guaranteed lifetime withdrawal benefit, which permits policyholders to elect to receive guaranteed payments for life from their contract without having to annuitize their policies. Participating income riders tend to have lower levels of guaranteed income than guaranteed income riders but provide policyholders the opportunity to receive greater levels of income if the policies’ indexed crediting strategies perform well. As of December 31, 2025, approximately 24% of Athene’s deferred annuity account value contained rider benefits.
Withdrawal Options for Deferred Annuities. After the first year following the issuance of a deferred annuity, the policyholder is typically permitted to make withdrawals up to 5% or 10% (depending on the contract) of the prior year’s value without a surrender charge or market value adjustment (“MVA”), subject to certain limitations. Withdrawals in excess of the allowable amounts are assessed a surrender charge and MVA if such withdrawals are made during the surrender charge period of the policy, which generally ranges from 3 to 20 years. The surrender charge for most Athene products at contract inception is generally between 7% and 15% of the contract value and typically decreases by approximately half a percentage point to one percentage point per year during the surrender charge period. The weighted average base surrender charge (excluding the impact of MVAs) was 6% for Athene’s deferred annuities as of December 31, 2025.
At maturity, the policyholder may elect to receive proceeds in the form of a single payment or an annuity. If the annuity option is selected, the policyholder will receive a series of payments over the policyholder’s lifetime or over a fixed number of years, depending upon the terms of the contract. Some contracts permit annuitization prior to maturity.
Group Annuities. Group annuities issued in connection with pension group annuity transactions usually involve a single premium group annuity contract issued to discharge certain pension plan liabilities. The group annuities that Athene issues are nonparticipating contracts. The assets supporting the guaranteed benefits for each contract may be held in a separate account. Group annuity benefits may be purchased for current, retired and/or terminated employees and their beneficiaries covered under terminating or continuing pension plans. Both immediate and deferred annuity certificates may be issued pursuant to a single group annuity contract. Immediate annuity certificates cover those retirees and beneficiaries currently receiving payments, whereas deferred annuity certificates cover those participants who have not yet begun receiving benefit payments. Immediate
19
annuity certificates have no cash surrender rights, whereas deferred annuity certificates may include an election to receive a lump sum payment, exercisable by the participant upon either the participant achieving a specified age or the occurrence of a specified event, such as termination of the participant’s employment.
Athene earns income on group annuities based upon the spread between the return on the assets received in connection with the pension group annuity transaction and the cost of the pension obligations assumed. Group annuities expose Athene to longevity risk, which would be realized if plan participants live longer than assumed in underwriting the transaction, resulting in aggregate payments that exceed Athene’s expectations. However, Athene’s conservative underwriting process makes use of a wealth of reliable pre- and post-selection participant data, including mortality experience data, particularly for mid- to large-sized transactions, to mitigate this risk.
To better position Athene to expand distribution of annuities to defined contribution plans, it acquired Advantage Retirement Solutions, which was rebranded to Vitera, and made enhancements to its annuity offering with Vitera in 2025. Group fixed indexed annuities are issued as part of Vitera’s guaranteed lifetime income solution for defined contribution plans. This involves the use of a target date fund, which can serve as a defined contribution plan’s qualified default investment alternative. The target date fund provides guaranteed lifetime income by purchasing group fixed indexed annuities with guaranteed lifetime withdrawal benefits that Athene issues to the target date fund. The fixed indexed annuities are an asset class within the target date fund’s asset allocation. The allocation to fixed indexed annuities begins, on average, at age 47 for each vintage of the target date fund and gradually increases with incremental purchases of group fixed indexed annuities to provide a pre-defined level of guaranteed income starting at age 65.
Athene generates income on group fixed indexed annuity products distributed to defined contribution target date funds in a similar manner to its fixed indexed annuities sold through the retail distribution channel. Specifically, Athene earns an investment spread, based on the difference between (1) income earned on the investments supporting the liabilities and (2) the cost of funds, including option costs, the cost of providing guarantees and institutional policy issuance, maintenance and distribution costs.
Funding Agreements
Funding agreements include those issued to institutions via direct issuances, those issued to the Federal Home Loan Bank (“FHLB”) and those issued to special-purpose unaffiliated trusts in connection with Athene’s FABN and FABR programs. Funding agreements are issued opportunistically to institutional investors at attractive risk-adjusted funding costs. They are designed to provide an agreement holder with a guaranteed return of principal and periodic interest payments, while offering competitive yields and predictable returns. The interest rate can be fixed or floating. Athene also includes repurchase agreements with a term that exceeds one year at the time of execution within the funding agreement product category.
Life and Other
Life and other products include life insurance policies assumed through reinsurance transactions, guaranteed investment contracts issued in connection with defined contribution plans, other retail products, including legacy run-off or ceded business, and statutory closed blocks.
Guaranteed investment contracts are designed similar to funding agreements, where the contract holder is guaranteed a return of principal plus interest.
Distribution Channels
Athene has developed four dedicated distribution channels to address the retirement services market: retail, flow reinsurance, institutional, and acquisitions and block reinsurance, which support opportunistic origination across different market environments. Additionally, Athene believes these distribution channels enable it to achieve stable asset growth while maintaining attractive returns.
Retail
Athene has built a scalable platform that allows it to originate and rapidly grow its business in deferred annuity products. Athene has developed a suite of retirement savings products, distributed through its network of 41 independent marketing organizations (“IMOs”), 18 banks and 163 broker-dealers, collectively representing approximately 152,000 independent agents
20
in all 50 states. Additionally, Athene distributes structured settlements through its network of specialized structured settlement annuity brokers. Athene is focused in every aspect of its retail channel on providing high quality products and service to its policyholders and maintaining appropriate financial protection over the life of their policies.
Flow Reinsurance
Flow reinsurance provides another channel for Athene to source liabilities with attractive crediting rates and offers insurance companies the opportunity to improve their product offerings and enhance their financial results. As in the retail channel, Athene does not pursue flow volume growth at the expense of profitability and will respond rapidly to adjust pricing for changes in asset yields.
Reinsurance is an arrangement under which an insurance company, the reinsurer, agrees to indemnify another insurance company, the ceding company or cedant, for all or a portion of certain insurance risks underwritten by the ceding company. Reinsurance is designed to (1) reduce the net amount at risk on individual risks, thereby enabling the ceding company to increase the volume of business it can underwrite, as well as increase the maximum risk it can underwrite on a single risk, (2) stabilize operating results by reducing volatility in the ceding company’s loss experience, (3) assist the ceding company in meeting applicable regulatory requirements and (4) enhance the ceding company’s financial strength and surplus position.
Within its flow reinsurance channel, Athene conducts third-party flow reinsurance transactions through its insurance subsidiaries. Flow reinsurance also includes recurring premium from block reinsurance transactions. As a reinsurer, Athene partners with insurance companies to develop solutions to their capital requirements, enhance their presence in the retirement market and improve their financial results. Athene targets reinsuring spread-based liabilities which can include FIAs, MYGAs, traditional one-year guarantee fixed deferred annuities, immediate annuities, whole life insurance, universal life insurance, indexed universal life insurance and institutional products.
Institutional
Athene’s institutional channel includes funding agreements, guaranteed investment contracts, pension group annuity transactions and group fixed indexed annuities issued in connection with defined contribution plans.
Funding Agreements. Funding agreements are comprised of funding agreements issued under Athene’s FABN program, secured and other funding agreements, which include Athene’s FABR program and direct funding agreements, funding agreements issued to the FHLB and long-term repurchase agreements. Athene’s FABN program allows its special-purpose, unaffiliated statutory trust to offer its senior secured medium-term notes. The notes are underwritten and marketed by major investment banks’ broker-dealer operations and are sold to institutional investors. The net proceeds from each sale are used to purchase one or more funding agreements from Athene subsidiaries with matching interest and maturity payment terms. Athene also established a secured FABR program in which a special-purpose, unaffiliated entity enters into a repurchase agreement with a bank and the proceeds of the repurchase agreement are used by the special-purpose entity to purchase funding agreements from Athene subsidiaries. In addition to the funding agreements issued to special-purpose unaffiliated trusts or other unaffiliated entities, Athene engages in direct issuances with various institutions. Athene is also a member of the Federal Home Loan Bank of Des Moines and, through membership, has issued funding agreements to the FHLB in exchange for cash advances. Athene is required to provide collateral in excess of the funding agreement amounts outstanding, considering any discounts to the securities posted and prepayment penalties. Long-term repurchase agreements with a term that exceeds one year at the time of execution are also included within the funding agreement product category.
Guaranteed Investment Contracts. Guaranteed investment contracts are marketed to stable value fund managers to support stable value investment options within defined contribution plans.
Pension Group Annuities. Athene partners with institutions seeking to transfer and thereby reduce their obligation to pay future pension benefits to retirees and deferred participants through pension group annuities. Athene works with advisors, brokers and consultants to source pension group annuity transactions and design solutions that meet the needs of prospective pension group annuity counterparties and their participants, with a focus on medium- and large-sized deals involving retirees and/or deferred participants that are structured as either a buyout or a buy-in transaction.
Group Fixed Indexed Annuities. Group fixed indexed annuities are issued as part of Vitera’s guaranteed lifetime income solution through a target date fund within defined contribution plans. The defined contribution market involves several stakeholders, including asset managers and plan record-keepers. Vitera partners with select asset managers and plan record-
21
keepers to market the guaranteed lifetime income target date fund to institutions that sponsor defined contribution plans to have these institutions add the guaranteed lifetime income target fund to their fund offering with a particular focus in having the target date fund deemed as the qualified default investment alternative. Vitera also has direct outreach efforts to larger institutions to market the product.
Acquisitions and Block Reinsurance
Acquisitions. Acquisitions are a complementary source of growth for our retirement services business. Athene has a proven ability to acquire businesses in complex transactions at favorable terms, manage the liabilities acquired and reinvest the associated assets.
Block Reinsurance. Through block reinsurance transactions, Athene partners with life and annuity companies to decrease their exposure to one or more products or to divest of lower-margin or non-core segments of their businesses. Unlike acquisitions in which Athene acquires the assets or stock of a target company, block reinsurance allows Athene to contractually assume assets and liabilities associated with a certain book of business. In doing so, Athene contractually assumes responsibility for only that portion of the business that it deems desirable, without assuming additional liabilities.
As Athene continues to expand into new markets and geographies, it has been disciplined in only retaining liabilities that are core to its strategy and competitive advantages. This can be accomplished through structural solutions, including mortality and longevity reinsurance.
Capital
Athene believes it has a strong capital position and is well positioned to meet policyholder and other obligations. Athene measures capital sufficiency using various internal capital metrics which reflect management’s view on the various risks inherent to its business, the amount of capital required to support its core operating strategies and the amount of capital necessary to maintain its current ratings in a recessionary environment. The amount of capital required to support Athene’s core operating strategies is determined based upon internal modeling and analysis of economic risk, as well as inputs from rating agency capital models and consideration of both NAIC risk-based capital (“RBC”) and Bermuda capital requirements. Capital in excess of this required amount is considered excess equity capital, which is available to deploy.
Deployable Capital
Athene’s deployable capital is comprised of capital from three sources: excess equity capital, untapped leverage capacity and available undrawn capital commitments from ACRA. As of December 31, 2025, Athene estimates that it had approximately $8.6 billion in capital available to deploy, consisting of approximately $3.2 billion in excess equity capital, $2.6 billion in untapped leverage capacity (assuming an adjusted leverage ratio of not more than 30%, subject to maintaining a sufficient level of capital required to maintain Athene’s desired financial strength ratings from rating agencies), and $2.8 billion in available undrawn capital at ACRA.
ACRA
To support growth strategies and capital deployment opportunities, Athene established ACRA 1 as a long-duration, on-demand capital vehicle. Athene directly owns 37% of the economic interests in ACRA 1 and all of ACRA 1’s voting interests, with ADIP I owning the remaining 63% of the economic interests. During the commitment period, ACRA 1 participated in certain transactions by drawing a portion of the required capital for such transactions from third-party investors equal to ADIP I’s proportionate economic interests in ACRA 1. The commitment period for ACRA 1 expired in August 2023.
To further support its growth and capital deployment opportunities following the deployment of capital by ACRA 1, Athene funded ACRA 2 in December 2022 as another long-duration, on-demand capital vehicle. Athene directly owns 37% of the economic interests in ACRA 2 and all of ACRA 2’s voting interests, with ADIP II owning the remaining 63% of the economic interests. ACRA 2 participates in certain transactions by drawing a portion of the required capital for such transactions from third-party investors equal to ADIP II’s proportionate economic interests in ACRA 2.
These strategic capital solutions are designed to provide Athene the flexibility to simultaneously deploy capital across multiple accretive avenues and sustain a profitable growth strategy at scale in a capital efficient manner, while maintaining a strong financial position.
22
Uses of Capital
Athene’s capital deployment includes the payment for a business opportunity, such as the payment of a ceding commission to enter into a block reinsurance transaction, and the retention of capital based on Athene’s internal capital model. Currently, Athene deploys capital in four primary ways: (1) supporting organic growth, (2) supporting inorganic growth, (3) making dividend payments to AGM, and (4) retaining capital to support financial strength ratings upgrades. Athene generally seeks mid-teen or higher returns on its capital deployment.
Reinsurance
Internal Ceded Reinsurance
Subject to quota shares generally ranging from 80% to 100%, substantially all of the existing deposits held and new deposits generated by Athene’s U.S. insurance subsidiaries are reinsured to its Bermuda reinsurance subsidiaries. Athene maintains the same reserving principles for its Bermuda reinsurance subsidiaries as it does for its U.S. insurance subsidiaries. Athene also retrocedes certain organic and inorganic business to ACRA. Athene’s internal reinsurance structure provides it with several strategic and operational advantages, including the aggregation of regulatory capital, which makes the aggregate capital of its Bermuda reinsurance subsidiaries available to support the risks assumed by each entity, and enhanced operating efficiencies. As a result of its internal reinsurance structure and third-party direct to Bermuda business, a significant majority of Athene’s aggregate capital is held by its Bermuda reinsurance subsidiaries.
Third-Party Ceded Reinsurance
In addition, from time to time, Athene may opportunistically cede certain of its business from its U.S. insurance subsidiaries, or Bermuda reinsurance subsidiaries, to third party reinsurers, to generate capital and/or limit exposure to certain risks.
Ratings
As of December 31, 2025, each of Athene’s significant insurance subsidiaries is rated “A+” or “A1” by the four rating agencies that evaluate the financial strength of such subsidiaries. To achieve its financial strength ratings aspirations, Athene may choose to retain additional capital above the level required by the rating agencies to support operating needs. Athene believes there are numerous benefits to achieving stronger ratings over time, including increased recognition of and confidence in its financial strength by prospective business partners, particularly within product distribution, as well as potential profitability improvements in certain organic channels through lower funding costs. Financial strength and credit ratings directly affect Athene’s ability to access funding and the related cost of borrowing, the attractiveness of certain Athene products to customers, its attractiveness as a reinsurer to potential ceding companies and the requirements for collateral posting on its derivatives. These ratings are periodically reviewed by the rating agencies.
Credit ratings represent the opinions of rating agencies regarding an entity’s ability to repay its indebtedness. Financial strength ratings represent the opinions of rating agencies regarding the financial ability of an insurer or reinsurer to meet its obligations under an insurance policy or reinsurance arrangement and generally involve quantitative and qualitative evaluations by rating agencies of a company’s financial condition and operating performance. Generally, rating agencies base their financial strength ratings upon information furnished to them by the respective company and upon their own investigations, studies and assumptions. Financial strength ratings are based upon factors of concern to policyholders, agents, intermediaries and ceding companies and are not directed toward the protection of investors. Credit and financial strength ratings are not recommendations to buy, sell or hold securities and they may be revised or revoked at any time at the sole discretion of the rating organization.
Principal Investing
Our Principal Investing segment is comprised of our realized performance fee income, realized investment income earned from our balance sheet investments, and certain allocable expenses related to corporate functions supporting the entire company. The Principal Investing segment also includes our growth capital and liquidity resources at AGM. Over time, we may deploy capital into strategic investments that help accelerate the growth of our Asset Management segment, by broadening our investment management and/or product distribution capabilities or increasing the scalability and/or efficiency of our existing operations. We believe these investments may translate into greater compounded annual growth of Fee Related Earnings.
23
Given the cyclical nature of realized performance fees, earnings from our Principal Investing segment, or PII, are inherently more volatile in nature than earnings from the Asset Management and Retirement Services segments. We earn fees based on the investment performance of the funds, partnerships, and accounts we manage and compensate our employees, primarily investment professionals, with a meaningful portion of these proceeds to align our team with investors whose capital we manage and incentivize them to deliver strong investment performance over time. To enhance this alignment, we have increased the proportion of performance fee income we pay to our employees over time.
Competition
Asset Management
Within the asset management business, Apollo operates in an intensely competitive industry, and expects it to remain so. We compete globally and on a regional, industry and niche basis.
We face competition both in the pursuit of investor capital and in making investments on behalf of funds and accounts we manage across credit and equity asset classes. We compete for investor capital based on a variety of factors, including:
•investment performance as a metric for assessing excess return per unit of risk;
•investor perception of investment managers’ drive, focus and alignment of interest;
•quality of service provided to and duration of relationship with investors;
•business reputation; and
•the level of fees and expenses charged for services.
We have seen capital demand increasing over six discrete markets on a global basis: institutional investor alternative allocations, individuals, insurance, traditional asset managers, institutional investors for fixed income and equity replacement, and defined contribution/401(k). With the growing demand for capital, we expect the composition of competition may shift and evolve over time.
Competition is also intense for the attraction and retention of qualified employees. Our ability to continue to compete effectively within our industry will depend upon our ability to attract new employees and retain and motivate our existing employees.
Retirement Services
Athene faces competition from a variety of large and small industry participants, including diversified financial institutions and insurance and reinsurance companies. These companies compete in one form or another for the growing pool of retirement assets driven by a number of external factors such as the continued aging of the population and the reduction in safety nets provided by governments and private employers. In the markets in which Athene operates, scale and the ability to provide value-added services and build long-term relationships are important factors to compete effectively. Athene believes that its leading presence in the retirement services market, diverse range of capabilities and broad distribution network uniquely position it to effectively serve consumers’ increasing demand for retirement solutions.
Athene experiences competition in the annuity market from traditional carriers and new entrants. Principal competitive factors for fixed annuities are initial crediting rates, reputation for renewal crediting action, product features, brand recognition, customer service, distribution capabilities and financial strength ratings of the provider. Competition may affect, among other matters, both business growth and the pricing of products and services.
Reinsurance markets are highly competitive, as well as cyclical by product and market. Within the reinsurance market, Athene competes with other insurance and reinsurance companies based on many factors, including, among other things, financial strength, pricing and other terms and conditions of reinsurance agreements, reputation, service, and experience in the types of business underwritten. The impact of these and other factors is generally not consistent across lines of business, domestic and international geographical areas, and distribution channels.
Athene encounters strong competition within its institutional channel. With respect to funding agreements, namely those issued in connection with its FABN program, Athene competes with other insurers that have active FABN programs. Within the funding agreement market, Athene competes primarily on the basis of financial strength and interest rates. With respect to
24
guaranteed investment contracts, Athene competes with other insurers that have an active guaranteed investment contract program primarily on the basis of interest rates. With respect to group annuities, Athene competes with other insurers that offer such annuities. Within the pension group annuities market, it competes primarily on the basis of participant security, price, underwriting, investment capabilities and its ability to provide quality service to the corporate sponsor’s pension participants. Within the group annuity market for defined contribution plans, Athene competes primarily on overall product features and design, brand recognition and financial strength ratings.
Finally, Athene experiences competition in the market for acquisition targets and profitable blocks of insurance. Such competition has intensified as insurance businesses become more attractive acquisition targets for both other insurance companies and financial institutions and as the already substantial consolidation in the financial services industry continues. Athene competes for potential acquisition and block reinsurance opportunities based on a number of factors including perceived financial strength, brand recognition, reputation and the pricing it is able to offer, which, to the extent Athene determines to finance a transaction, is in turn dependent on its ability to do so on suitable terms. Athene has demonstrated patience in only pursuing transactions that meet its internal risk and return objectives. With the backdrop of increasing competition, Athene believes its demonstrated ability to source and consummate large and complex transactions and its inroads in other adjacent markets, including the Japanese savings market, is a competitive advantage over other potential acquirers.
For additional information concerning the competitive risks that we face, see “Item 1A. Risk Factors—Operating Risks—We operate in highly competitive industries, which could limit our ability to achieve our growth strategies and could materially and adversely affect our businesses, financial condition, results of operations, cash flows and prospects.”
Human Capital
Apollo’s talent is instrumental to our success as a global alternative asset manager and retirement services provider. Investing in and fostering a modern and inclusive high-performance culture is core to operating our business and delivering positive outcomes for our shareholders and fund investors, and our employee value proposition is designed to engage and develop our talent to deliver maximum impact. We believe our commitment to expanding opportunity across our ecosystem is central to the Apollo business model, an integrated platform which fosters strong collaboration across businesses and functions. Rooted in our core values, we strive to build a culture where all of our people can excel and grow in their careers.
Talent Development
We believe that ongoing professional development is a critical part of our culture at Apollo and an important enabler of our investment process. Because of our entrepreneurial culture, the breadth of our integrated platform, and our reputation for strong investment performance, we believe we can attract, develop and retain top talent. We have development programs in place across a variety of levels which demonstrate our commitment to developing, engaging and retaining our employees. In addition to our training and annual review programs, we have instituted annual employee surveys that measure employee satisfaction and engagement and help evaluate and guide human capital decision-making. We work in partnership with our employees to maintain a strong culture which prioritizes excellence and outperforming expectations to advance our goal of being a modern high-performance workplace that is also great place to work.
Compensation and Benefits
We work to offer a compelling employee value proposition to reward strong performance and support our employees’ professional development and well-being. Our pay for performance compensation philosophy is designed to reward employees for performance and to align employee interests with the firm’s long-term growth and with our shareholders. All of our employees are granted stock through a range of equity-based compensation programs, including our One Apollo stock program. Our benefits programs are intended to support our employees and their families, and include healthcare, wellness initiatives, retirement programs, paid time off and family leave.
Expanding Opportunity
Apollo is committed to championing opportunity and fostering a culture of excellence where everyone has an opportunity to thrive. We make talent decisions based on the qualities necessary to succeed in our modern high-performance workplace, focusing on skills, experience, and performance that drive results, rather than demographic characteristics or preferences. Reducing individuals to a single trait – whether gender, race, or ethnicity – misses the full picture of their capabilities, contributions, and potential impact. At the same time, we believe that a workforce of extraordinary people from a wide range of
25
backgrounds and viewpoints helps us solve complex problems, drive innovation, and achieve great results over the long term. We are committed to expanding opportunity across our ecosystem – our workplace, in our marketplace, and in the communities where we live and work – to ensure that we attract and grow the best talent and business partners from a wide range of backgrounds, perspectives, and experiences who can perform at the highest levels for Apollo.
Citizenship
Apollo seeks to actively invest in our communities and engage our employees and other stakeholders in meaningful and impactful Citizenship Programs. Apollo offers its employees philanthropic, volunteer, and other forms of engagement to strengthen communities and expand opportunity around the globe. To empower employees to give back, Apollo hosts volunteer events and provides Citizenship Grants for matching gifts and volunteer rewards each year. Apollo is proud to amplify the efforts of employees, supporting the communities in which they live and the causes and organizations of greatest importance to them.
Foundations
The Apollo Opportunity Foundation and the Athene Charitable Foundation are committed to strengthening the communities where our employees live and work by creating lasting, positive impact through purposeful engagement and investment.
The Apollo Opportunity Foundation was launched in February 2022 to expand opportunity in communities where our employees live and work around the globe by deploying our capital and engaging our people to invest in career education, workforce development and economic empowerment for all. Leading with an employee-driven approach, the Apollo Opportunity Foundation partners with organizations that are championed by Apollo employees to advance economic prosperity and expand opportunity.
The Athene Charitable Foundation is deeply committed to making a meaningful difference in the communities where Athene employees live and work. Through hands-on volunteerism, strategic philanthropic giving, and purposeful community outreach, the Athene Charitable Foundation strives to create lasting, positive impact. Guided by four core pillars, education, human services, health and well-being, and environmental sustainability, the Athene Charitable Foundation’s efforts reflect a shared belief that strong communities are built when opportunity, compassion, and responsibility come together.
Regulatory and Compliance Matters
Our businesses, as well as the financial services and insurance industries generally, are subject to extensive regulation in the U.S. and around the world. Virtually all aspects of our business are subject to various laws and regulations, some of which are summarized below. Under these laws and regulations, agencies that regulate investment advisers, investment funds, insurance businesses, broker-dealers and other individuals and entities have broad administrative powers, including the power to limit, restrict or prohibit the regulated entity or person from carrying on business if it fails to comply with such laws and regulations.
Failure to comply with applicable regulatory and compliance requirements may result in a variety of consequences, including fines, administrative measures, suspension of voting rights, suspension of individual employees, limitations on engaging in certain lines of business for specified periods of time or mandatory disposal of interests in any affected regulated entity, revocation of investment adviser, insurance, broker-dealer and other registrations, licenses or charters, censures and other regulatory sanctions.
The legal and regulatory requirements applicable to our business are ever evolving and may become more restrictive, which may make compliance with applicable requirements more difficult or expensive or otherwise restrict our ability to conduct our business activities in the manner in which they are now conducted. Our businesses have operated for many years within a legal framework that requires us being able to monitor and comply with a broad range of legal and regulatory developments that affect our activities. However, additional legislation, changes in rules promulgated by self-regulatory organizations or changes in the interpretation or enforcement of existing laws and rules, either in the U.S. or elsewhere, may directly affect our mode of operation and profitability.
The complex regulatory frameworks governing financial institutions, insurance companies, insurance distributors and their respective holding companies and subsidiaries, as well as those with investments in them, are very detailed and technical. Accordingly, the discussion below is general in nature, does not purport to be complete and is current only as of the date of this report.
26
Financial Services Regulation
Our financial services businesses, subsidiaries and/or affiliates are regulated under, among others, the Investment Advisers Act; the Investment Company Act; the Dodd-Frank Wall Street Reform and Consumer Protection Act (the “Dodd-Frank Act”); the Commodity Exchange Act; the U.K. Financial Services and Markets Act 2000; the European Union Alternative Investment Fund Managers Directive and U.K. Alternative Investment Fund Managers Regulations 2013; the European Union Markets in Financial Instruments Directive (“MiFID”) and the assimilated U.K. law version of MiFID; the Financial Stability Oversight Council (the “FSOC”) and similar non-U.S. regulators; the Federal Reserve and the other U.S. federal prudential banking regulators; the SEC; the Financial Industry Regulatory Authority, Inc. (“FINRA”); the Commodity Futures Trading Commission and National Futures Association; the U.S. Department of Labor; the Internal Revenue Service (the “IRS”); the Federal Communications Commission; banking and financial regulators in the European Union, its member states and the U.K.; as well as rules and regulations over credit risk retention, real estate investment trusts, broker-dealers, “over the counter” derivatives markets, commodity pool operators, commodity trading advisors, gaming companies and natural resources companies.
Regulation under the Investment Advisers Act. We conduct our advisory business primarily through our directly owned investment adviser subsidiaries, including Apollo Capital Management, L.P., Apollo Investment Management, L.P., Apollo Credit Management, LLC, ARIS Management, LLC, Apollo Capital Credit Adviser, LLC, Apollo Real Estate Fund Adviser, LLC, Apollo Manager, LLC, Apollo S3 RIC Management, L.P. and Apollo MPS Management, LLC, each of which is registered as an investment adviser with the SEC under the Investment Advisers Act. Apollo Capital Management, L.P. has a number of relying advisers that operate a single advisory business and rely on umbrella registration to be deemed registered as an investment adviser with the SEC. All of our SEC-registered investment advisers are subject to the requirements and regulations of the Investment Advisers Act, including, among other things, maintaining an effective compliance program reasonably designed for our business, maintaining a Code of Business Conduct and Ethics and other established policies for personal trading, record keeping, marketing, disclosure, custody, and acting consistently with each advisers’ fiduciary duty to its clients.
Regulation as a Broker-Dealer. Apollo Global Securities, LLC (“AGS”), Griffin Capital Securities, LLC (“GCS”) and Athene Securities, LLC (“Athene Securities”), each of which is a subsidiary of Apollo, are registered as broker-dealers with the SEC and in the U.S. states and territories and are members of FINRA. Broker-dealers are subject to regulations that cover all aspects of the securities business, including, among other things, the implementation of a supervisory control system and effective compliance program, advertising, communications and sales practices, conduct of and compensation in connection with public securities offerings, trading practices and best execution, maintenance of adequate net capital and customer reserve accounts, financial and trade reporting, record keeping, and the conduct and qualifications of directors, officers, employees and other associated persons. State securities regulators also have regulatory oversight authority over AGS, GCS and Athene Securities. In addition, one of our non-U.S. subsidiaries, Apollo Capital Solutions Europe B.V., is regulated under relevant broker-dealer regulations in the Netherlands. See “—Regulated Entities Outside of the U.S.” below.
Regulation as a Commodity Pool Operator, Commodity Trading Advisor and Investment Company. Certain investment activities in which Apollo managers engage may subject those managers to provisions of the Commodities Exchange Act and oversight by the Commodity Futures Trading Commission (“CFTC”) and National Futures Association (“NFA”), including registration as a commodity pool operator or commodity trading advisor. Apollo intends to rely on exemptions from registration when available.
In addition, certain of the funds we manage are registered management investment companies under the Investment Company Act, and are subject to extensive substantive regulation concerning the governance, registration, disclosures and operations of those funds.
Other U.S. and Foreign Regulation. We are also subject to laws and regulations governing payments and contributions to public officials or other parties, including restrictions imposed by the U.S. Foreign Corrupt Practices Act, as well as economic sanctions and export control laws administered by the U.S. Treasury Department’s Office of Foreign Assets Control (“OFAC”), the U.S. Department of Commerce and the U.S. Department of State. OFAC maintains and enforces economic sanctions against certain countries, regions, and persons in support of a variety of U.S. foreign policy and national security objectives, which prohibit U.S. persons from engaging in certain transactions with certain persons or entities.
27
As a result of certain investments of ours and the funds we manage in financial institutions that operate outside of the U.S., Apollo is subject to regulatory supervision by international financial regulators, including European Union, European Union member state and U.K. financial regulators and applicable requirements set forth in the relevant banking, consumer finance and other financial services regulations of such jurisdictions. In certain cases, such regulations impose suitability and conduct standards on the Company and require notice to and in certain instances approval of, the relevant regulatory authority of an intent to increase or decrease holdings in the relevant entity outside of specified thresholds, or other contemplated changes in structure, or transactions. Failure to comply with these applicable requirements may result in a variety of consequences, including fines, administrative measures, suspension of voting rights, mandatory disposal of interests in the regulated entity or other regulatory sanctions.
Insurance Regulation
Our businesses, subsidiaries and affiliates are subject to a wide variety of insurance and insurance holding company system laws and regulations in both the U.S. and numerous other jurisdictions, including the European Union, Bermuda, the U.K., Switzerland, Italy, Germany, Belgium, the Netherlands, Australia, Singapore, Cayman Islands, Canada and Malaysia.
United States
Within the U.S., each state’s insurance laws require each of our insurance company subsidiaries to be licensed and regulated by the commissioner, superintendent or director of the insurance department (each, a “Commissioner”) of its domiciliary state and each state in which it transacts insurance as an admitted insurer. The extent of such regulation varies by state, but as a general matter, state Commissioners have broad administrative powers over the business activities and financial aspects of our insurance company subsidiaries, including pursuant to state laws and regulations requiring the licensing of producers who sell the insurance company’s products, regulating premium rates and approving policy forms, establishing reserve requirements, solvency standards and minimum capital requirements, regulating the type, amounts and valuations of investments permitted, examining the business conduct of licensed insurance companies and other matters.
As the ultimate controlling entity, we are subject to the insurance holding company system laws of the domiciliary state of each insurance company subsidiary, which requires, among other filings, its annual registration statement filing with the Commissioner of its domiciliary state and the submission of our financial information and other information about the operations of companies within its holding company system, including submission of an annual enterprise risk report identifying material risks within the holding company system that could pose enterprise risk to our insurance company subsidiaries. These laws also impose restrictions and limitations on the ability of an insurance company subsidiary to pay dividends and make other distributions to its parent company. In addition, transactions between an insurance company and other companies within its holding company system, including sales, loans, investments, reinsurance agreements, tax allocation agreements, management agreements and service agreements, must be on terms that are fair and reasonable and, if material or within a specified category, require prior notice to and approval or non-disapproval by the applicable domiciliary state Commissioner.
All states have insurance laws that require regulatory approval of a direct or indirect change of control of an insurer, which would include a change of control of its holding company. Such laws prevent any person from acquiring direct or indirect control of any of our U.S. insurance subsidiaries or their holding companies unless that person has filed a statement with specified information with the Commissioner and has obtained the Commissioner’s prior approval. Under such state statutes, generally acquiring 10% or more of a voting interest in an insurer or its parent company is presumptively considered a change of control, although such presumption may be rebutted. Accordingly, any person who acquires 10% or more of a voting interest in a direct or indirect parent of any of our U.S. insurance subsidiaries without the prior approval of the Commissioner of the applicable state will be in violation of the applicable state’s law and may be subject to injunctive action requiring the disposition or seizure of those securities by the Commissioner or prohibiting the voting of those securities and/or to other actions determined by the Commissioner. Further, a willful violation of these laws is punishable in each state as a criminal offense.
These laws may discourage potential acquisition proposals and may delay, deter or prevent an acquisition of control of a direct or indirect parent of any of our U.S. insurance subsidiaries (in particular through an unsolicited transaction), even if the stockholders of such parent consider such transaction to be desirable.
All 50 states, Puerto Rico and the District of Columbia have insurance guaranty fund laws requiring insurance companies doing business within those jurisdictions to participate in guaranty associations. Guaranty associations are organized to cover, subject
28
to limits, contractual obligations under insurance policies issued by insurance companies which later become impaired or insolvent. These associations levy assessments, up to prescribed limits, on each member insurer doing business in a particular state on the basis of their proportionate share of the premiums written by all member insurers in the lines of business in which the impaired or insolvent insurer previously engaged. Most states limit assessments in any year to 2% of the insurer’s average annual premium for the three years preceding the calendar year in which the impaired insurer became impaired or insolvent. Some states permit member insurers to recover assessments paid through full or partial premium tax offsets, usually over a period of years. Assessments levied against Athene’s U.S. insurance subsidiaries by guaranty associations during the year ended December 31, 2025 were not material. While we cannot accurately predict the amount of any such future assessments, or past or future insolvencies of competitors which would lead to such assessments, it is possible that any such assessments with respect to pending insurers’ impairments and insolvencies may have a material adverse effect on our financial condition, results of operations, liquidity or cash flows, and any reserves we have previously established for these potential assessments may not be adequate.
Other Jurisdictions
The operations of our insurance subsidiaries and branches operating outside the U.S. are subject to the local regulatory and supervisory schemes in the jurisdictions in which they operate, which vary widely from country to country; however, regulators typically grant licenses to operate and control an insurance business in a specific jurisdiction. In general, insurance regulators in most jurisdictions have the administrative power to supervise the registration of agents, regulation of product features and product approvals, asset allocation, minimum capital requirements, solvency and reserves, policyholder liabilities, and investments. Regulatory authorities may also regulate affiliations with other financial institutions, stockholder structures and may impose restrictions on declaring dividends and the ability to effect certain capital transactions, and many jurisdictions require insurance companies to participate in policyholder protection schemes.
Many of the insurance regulatory frameworks that govern our and our affiliated funds’ insurance entities operating outside the U.S. require the prior consent of the applicable regulator in such jurisdictions before (1) any person can become a “controller”/“qualifying holder” or acquire a direct or indirect control/qualifying holding (e.g., 10%, 20%, 30% or 33% and 50%) in any regulated company, or over the parent undertaking of any such regulated company or (2) any increase of an existing holding that would result in a person reaching the applicable thresholds of the jurisdiction (e.g., 10%, 20%, 30% or 33% and 50%). In addition, certain regulators require the insurance entities or their controllers/qualifying holders to notify the appropriate regulator of any prospective changes in organizational structure of which they are aware, sometimes regardless of whether the controller/qualifying holder or the proposed controller/qualifying holder would be required to submit a change in control application or an application to acquire control/a qualifying holding as a result of such changes in organizational structure. Breach of the requirements to notify the relevant regulator of a decision to acquire or increase control/holding, or of the requirement to obtain approval before completing the relevant control/qualifying holding transaction may in some jurisdictions be a criminal offense attracting potentially unlimited fines. Regulators can also seek other remedies, including suspension of voting rights in the relevant insurance undertaking or having the purported acquisition annulled.
In particular, the BMA, which regulates Athene, Athora and Catalina (as defined below), maintains supervision over the “controllers” of all registered insurers in Bermuda. For these purposes, a “controller” includes (1) the managing director of the registered insurer or its parent company, (2) the chief executive of the registered insurer or of its parent company, (3) a stockholder controller, and (4) any person in accordance with whose directions or instructions the directors of the registered insurer or its parent company are accustomed to act.
The definition of stockholder controller is set out in the Bermuda Insurance Act 1978 (the “Bermuda Insurance Act”) and generally refers to (1) a person who holds 10% or more of the shares carrying rights to vote at a stockholders’ meeting of the registered insurer or its parent company, (2) a person who is entitled to exercise 10% or more of the voting power at any stockholders’ meeting of such registered insurer or its parent company or (3) a person who is able to exercise significant influence over the management of the registered insurer or its parent company by virtue of its shareholding or its entitlement to exercise, or control the exercise of, the voting power at any stockholders’ meeting.
29
Under the Bermuda Insurance Act, stockholder controller ownership is defined as follows:
| Actual Stockholder Controller Voting Power | Defined Stockholder Controller Voting Power | |||||||
| 10% or more but less than 20% | 10% | |||||||
| 20% or more but less than 33% | 20% | |||||||
| 33% or more but less than 50% | 33% | |||||||
| 50% or more | 50% | |||||||
Where the shares of a registered insurer, or the shares of its parent company, are traded on a recognized stock exchange, and such stockholder becomes a 10%, 20%, 33%, or 50% stockholder controller of the insurer, that stockholder shall, within 45 days, notify the BMA in writing that such stockholder has become, or as a result of a disposition ceased to be, a controller of any such category.
Any person or entity who contravenes the Bermuda Insurance Act by failing to give notice or knowingly becoming a controller of any description before the required 45 days has elapsed is guilty of an offense under Bermuda law and liable to a fine of $25,000 on summary conviction.
The BMA may file a notice of objection to any person or entity who has become a controller of any category when it appears that such person or entity is not, or is no longer, fit and proper to be a controller of the registered insurer. Before issuing a notice of objection, the BMA is required to serve upon the person or entity concerned a preliminary written notice stating the BMA’s intention to issue formal notice of objection. Upon receipt of the preliminary written notice, the person or entity served may, within 28 days, file written representations with the BMA which shall be taken into account by the BMA in making its final determination. Any person or entity who continues to be a controller of any description after having received a notice of objection is guilty of an offense and liable on summary conviction to a fine of $25,000 (and a continuing fine of $500 per day for each day that the offense is continuing) or, if convicted on indictment, to a fine of $100,000 and/or 2 years in prison.
The Bermuda Insurance Act regulates the insurance business of our Bermuda reinsurance subsidiaries, and provides that no person may carry on any insurance business in or from within Bermuda unless registered as an insurer under such act by the BMA. The BMA is required by the Bermuda Insurance Act to determine whether an applicant is a fit and proper body to be engaged in the insurance business and, in particular, whether it has, or has available to it, adequate knowledge and expertise to operate an insurance business. The continued registration of an insurer is subject to the insurer complying with the terms of its registration and such other conditions as the BMA may impose from time to time. The Bermuda Insurance Act also grants to the BMA powers to supervise, investigate and intervene in the affairs of insurers. The Bermuda Insurance Act imposes on Bermuda insurers solvency standards, as well as auditing and reporting requirements.
In the U.K., Apollo is considered the controller of certain insurance company (or equivalent) subsidiaries of Catalina Holdings (Bermuda) Ltd. (“Catalina”), including Catalina Worthing Insurance Limited. In addition, Catalina Services UK Limited is also domiciled in the U.K. and provides insurance distribution services for purposes of certain U.K. insurance regulations.
Apollo is deemed to hold an indirect qualifying holding in Athora Deutschland Verwaltungs GmbH, Athora Deutschland Holding GmbH & Co. KG, Athora Deutschland GmbH, Athora Lebensversicherung AG and Athora Pensionskasse AG, which are either German regulated insurance undertakings or German insurance holding companies.
Apollo is deemed to hold an indirect qualifying holding in Athora Belgium S.A./N.V. (“Athora Belgium”), which is a Belgian licensed insurance and reinsurance undertaking. In addition, some of Athora Belgium’s subsidiaries are registered with the Belgian regulator as insurance brokers and are subject to supervision by the Belgian regulator as regards their insurance distribution activities.
Apollo is deemed to hold an indirect qualifying holding in Athora Netherlands N.V. (formerly known as: VIVAT N.V.), Proteq Levensverzekeringen N.V., and SRLEV N.V., which are either Dutch regulated insurance undertakings or a Dutch insurance holding company, and Zwitserleven PPI N.V., which is a Dutch premium pension institution.
Additionally, Catalina carries on insurance business through its Singapore-domiciled subsidiary Asia Capital Reinsurance Group Pte. Ltd., which in turn operates through its subsidiaries in Malaysia.
30
Regulation of an Insurance Group
Many insurers, including certain of our subsidiaries, operate within an insurance group structure with two or more affiliated persons, one or more of which is an insurer. U.S. state and international regulators have developed group supervisory frameworks in order to provide regulators with the ability to scrutinize the activities of an insurance group and assess its potential impact on individual insurers within the group.
Group supervisors may impose certain requirements on the insurance group, including to make provision for, among other things: (1) assessing the financial situation and the solvency position of the insurance group and/or its members and (2) regulating intra-group transactions, risk concentration, governance procedures, risk management and regulatory reporting and disclosure. These requirements as applied in substance to us or our affiliates have been applied as part of larger prudential regulatory initiatives.
Government agencies and insurance standard setters in the U.S. and worldwide have become increasingly interested in potential risks posed by the insurance industry as a whole, and to commercial and financial activities and systems in general, as indicated by the adoption in 2019 of the Common Framework for the Supervision of Internationally Active Insurance Groups (“ComFrame”) by the International Association of Insurance Supervisors (“IAIS”). ComFrame applies to all large internationally active insurance groups (“IAIGs”) designated as an IAIG by their group-wide supervisor. The Iowa Insurance Division (the “IID”) identified itself as the group-wide supervisor for Apollo (in a distinct capacity from its role as supervisor for Athene). In February 2024, the IID, in its capacity as the group-wide supervisor for Apollo, identified Apollo as meeting the criteria as an IAIG and further identified Athene as the head of the IAIG. In general, the head of the IAIG is the uppermost entity to which obligations associated with an IAIG designation attach. Athene will therefore be subject to the relevant capital standard that the U.S. applies to IAIGs. At this time, we do not expect a significant impact on Athene’s capital position or capital structure; however, we cannot fully predict with certainty the impact (if any) on Athene’s capital position or capital structure and any other burdens being named an IAIG may impose on Athene or its insurance affiliates.
Capital Requirements
Regulators of each jurisdiction in which we operate have discretionary authority in connection with our insurance and reinsurance subsidiaries’ continued licensing to limit or prohibit sales to policyholders within their respective jurisdiction or to restrict continued operation of insurers or reinsurers domiciled in their respective jurisdiction if, in their judgment, such entities have not maintained the required level of minimum surplus or capital or that the further transaction of business would be hazardous to policyholders or reinsurance counterparties.
Restrictions on Dividends and Other Distributions
Our U.S. insurance subsidiaries are also subject to restrictions on the payment of dividends. Any proposed dividend in excess of the amount permitted by law is considered an extraordinary dividend or extraordinary distribution and may not be paid until it has been approved, or generally a 30-day waiting period has passed during which it has not been disapproved, by the Commissioner. In addition, Bermuda regulated insurers are strictly prohibited from declaring or paying any dividends unless certain financial conditions are met or prior approval from the BMA is received.
Consumer Protection Laws and Privacy, Data Security and AI Regulation
Federal and state consumer protection laws affect our operations. As part of the Dodd-Frank Act, Congress established the Consumer Financial Protection Bureau to supervise and regulate institutions that provide certain financial products and services to consumers. In addition, the Gramm-Leach-Bliley Act of 1999 implemented fundamental changes in the regulation of the financial services industry in the U.S. and includes privacy and security requirements for financial institutions, including obligations to protect and safeguard consumers’ nonpublic personal information and records, limitations on the re-disclosure and re-use of such information and requirements to notify customers and other individuals about their policies and practices relating to their collection and disclosure of such information and their practices relating to protecting the security and confidentiality of that information. Federal privacy and data security laws are enforced primarily by functional regulators (i.e., state insurance regulators for our insurance company affiliates) and by the SEC, CFTC and self-regulatory organizations for our affiliates registered with such functional regulators.
In addition to federal and other financial institution-specific privacy laws and regulations, an increasing number of states are considering and passing comprehensive privacy legislation, as well as laws or regulations around automated decision making or
31
artificial intelligence (“AI”) technologies. Moreover, the issues surrounding data security and the safeguarding of consumers’ protected information are under increasing regulatory scrutiny by state and federal regulators.
Regulated Entities Outside of the U.S.
Certain of our subsidiaries and the funds that we manage that operate in jurisdictions outside of the U.S. are licensed by or have obtained authorizations to operate in their respective jurisdictions outside of the U.S., and as a result are regulated by various international regulators and subject to applicable regulation. These registrations, licenses or authorizations relate to providing investment advice, discretionary investment management, arranging deals, marketing securities, capital markets activities and other regulated activities. Failure to comply with the laws and regulations governing these subsidiaries that have been registered, licensed or authorized could expose us to liability and/or damage our reputation.
Outside of the U.S., our subsidiaries and the funds that we manage, including Apollo Management International LLP, Apollo Credit Management International Limited, Apollo Asset Management Europe LLP, Apollo Investment Management Europe LLP, Apollo Investment Management Europe (Luxembourg) S.à r.l., Apollo Capital Solutions Europe B.V., Apollo Advisors (Mauritius) Ltd, AION Capital Management Limited, Apollo Management Singapore Pte. Ltd., Apollo Management Asia Pacific Limited and Apollo Management Japan Limited, are subject to regulation in the European Union, the Abu Dhabi Global Market, the U.K., India, Mauritius, Singapore, Australia, Hong Kong and Japan.
Other Regulatory Considerations. Certain of our businesses are subject to compliance with laws and regulations of U.S. federal and state governments, non-U.S. governments, their respective agencies and/or various self-regulatory organizations or exchanges relating to, among other things, the privacy of client information, cybersecurity and AI. Any failure to comply with these regulations could expose us to liability and/or reputational damage.
Rigorous legal and compliance analysis of our businesses and investments is important to our culture. We strive to maintain a culture of compliance through the use of policies and procedures, such as our code of ethics, compliance systems, communication of compliance guidance and employee education and training. We have a compliance group that monitors our compliance with the regulatory requirements to which we are subject and manages our compliance policies and procedures. Our Chief Compliance Officer supervises our compliance group, which is responsible for addressing all regulatory and compliance matters that affect our activities. Our compliance policies and procedures address a variety of regulatory and compliance risks such as the handling of material non-public information, personal securities trading, anti-bribery, financial crimes compliance, valuation of investments on a fund-specific basis, document retention, potential conflicts of interest and the allocation of investment opportunities.
Apollo has established certain one-way and/or two-way information barriers in respect of discrete investment strategies (based on established policies and procedures in respect of information barriers), including certain secondary trading activities. Nonetheless, we generally operate without permanent information barriers between our asset management businesses. In an effort to manage possible risks resulting from our decision not to implement additional barriers, our compliance personnel maintain restricted securities lists and other internal controls. We could in the future decide that it is advisable to establish permanent information barriers, particularly as our business expands and diversifies. In such event our ability to operate as an integrated platform would be restricted.
Available Information
Our Annual Reports on Form 10-K, Quarterly Reports on Form 10-Q, Current Reports on Form 8-K and amendments to reports filed or furnished pursuant to Section 13(a) of the Exchange Act are made available free of charge on or through our website at ir.apollo.com as soon as reasonably practicable after such reports are filed with, or furnished to, the SEC. The information on our website is not, and shall not be deemed to be, part of this report or incorporated into any other filings we make with the SEC. The reports and the other documents we file with the SEC are available on the SEC’s website at www.sec.gov.
From time to time, we may use our website as a channel of distribution of material information. Financial and other material information regarding the Company is routinely posted on and accessible at www.apollo.com.
32
ITEM 1A. RISK FACTORS
The following risk factors and other information included in this report should be carefully considered. The occurrence of any of the following risks or of unknown risks and uncertainties may adversely affect our business, financial condition, results of operations and cash flows.
Macroeconomic Risks
Evolving political, market and economic conditions, including increased policy uncertainty and market volatility, may adversely affect our businesses and financial results.
Our businesses are materially affected by conditions in the political environment and financial markets and economic conditions throughout the world, such as changes in interest rates, availability of credit, inflation rates (including persistent inflation), economic uncertainty, changes in laws (including laws relating to taxation), changes in governmental policy and regulatory reform, changes in trade or immigration policy, tariffs and trade sanctions on goods, trade wars, U.S.-China relations, commercial and trading relations between the U.S., Canada, Mexico and the European Union, imposition or maintenance of trade barriers (including tariffs), labor shortages, the ongoing Russia-Ukraine conflict, the conflicts in the Middle East, the tensions between China and Taiwan, supply chain disruptions, economic, political, fiscal and/or other developments in or affecting Eurozone countries, commodity prices, currency exchange rates and controls, wars, other national and international political circumstances (including terrorist acts or security operations), natural disasters, climate change, pandemics, epidemics, disease outbreaks or other severe public health crises and related governmental actions, and other events outside of our control. Recent macroeconomic conditions have been shaped by increasingly fragmented global growth and a more volatile and transactional policy environment. Economic performance has diverged across regions, with relatively resilient demand in the U.S. offset by weaker growth in parts of Europe and a slowdown in China, while global trade and investment flows have been influenced by heightened geopolitical tensions and a shift toward trade nationalism and industrial policy. Governments have increasingly relied on tariffs, export controls, investment screening and other policy tools to advance domestic economic and national security objectives, contributing to supply-chain reconfiguration, front-loading of imports, higher costs and reduced visibility into cross-border activity. These developments have increased uncertainty around global demand, pricing, capital allocation and exit environments, which could adversely affect portfolio company operating results and valuations, the availability and cost of financing, the timing and execution of asset sales and refinancings, and the investment performance of the funds we manage.
At the same time, inflation dynamics and monetary policy have become more uneven across jurisdictions. While inflation has moderated in certain economies, it has remained elevated or proven more persistent in others due to services inflation, labor market tightness, fiscal spending and tariff-related cost pressures, leading central banks to pursue increasingly divergent policy paths. As a result, interest rates may remain elevated for longer than in prior cycles or increase further in certain markets, contributing to volatility in interest rates, foreign exchange markets and financial conditions. These conditions may increase financing costs, pressure valuations and liquidity, and disproportionately affect interest-rate-sensitive assets and liabilities held by us and the portfolio companies of the funds we manage, particularly in an environment of slowing growth or heightened market uncertainty. Although the Federal Reserve in the U.S. and central banks in various other countries have cut interest rates as the rate of inflation slowly weakened, they may again raise, and some countries, such as Japan, have already raised, interest rates in response to concerns about inflation in the future, which, coupled with reduced government spending and volatility in financial markets, may have the effect of further increasing economic uncertainty and heightening these risks. Interest rate increases or other government actions taken to reduce inflation could also result in recessionary pressures in many parts of the world. Interest rate risk poses a significant market risk to us as a result of interest rate-sensitive assets (e.g., fixed income assets) and liabilities (e.g., fixed deferred and immediate annuities) held by us, the funds we manage and by the portfolio companies of the funds we manage. Certain portfolio companies of the funds we manage may also be impacted by inflation. If such portfolio companies are unable to pass any increases in their costs along to their customers, it could adversely affect their results and their ability to pay interest and principal on their loans, particularly if interest rates rise further in response to inflation. In addition, any projected future decreases in such portfolio companies’ operating results due to inflation could adversely impact the fair value of those investments. Any decreases in the fair value of our and our funds’ investments could result in future unrealized losses and therefore reduce our net assets resulting from operations.
Past, ongoing and potential armed conflicts and military hostilities in various regions, such as the conflict between Russia and Ukraine and the conflict in the Middle East, and heightened political and economic uncertainty across certain emerging markets and certain regions of strategic geopolitical significance, have increased, and may continue to increase in the future, global economic and political uncertainty. In response to such conflicts, hostilities and uncertainties, governments may impose a range
33
of trade, export control, investment, financial or other restrictions affecting certain countries, regions, industries or counterparties. For example, governments in the U.S., U.K., and EU have each imposed export controls on certain products and financial and economic sanctions on certain industry sectors and parties in Russia, and additional controls and sanctions could be enacted in the future. We are continuing to actively monitor geopolitical developments and assess their impact on our business and the business and operations of the portfolio companies of the funds we manage (particularly the impact on portfolio companies that operate in industries such as chemicals, oil and gas and aviation). We have no significant exposure to Russia, Ukraine or the Middle East and as such, to date, these conflicts have not had a material impact on our business, financial condition or results of operations. However, it is possible that these conflicts may escalate or expand, and the scope, extent and duration of the military action, current or future sanctions and resulting market and geopolitical disruptions could be significant. For example, any global energy crisis, including as a result of restrictions on Russia’s energy exports or any future continuation or expansion of the Middle East conflicts, could similarly have an adverse impact on certain of the geographies where we do business and certain business and operations of the portfolio companies of the funds we manage. We cannot predict the impact these conflicts may have on the global economy or our business, financial condition and operations in the future. These conflicts may also heighten the impact of other risks described herein.
Additionally, investing in securities and other financial instruments of companies organized or based outside the U.S. and operating outside the U.S. may also expose us to increased compliance risks, as well as higher compliance costs to comply with U.S. and non-U.S. anti-corruption, anti-money laundering and sanctions laws and regulations. These factors are outside our control and may affect the level and volatility of securities prices and the liquidity and the value of investments, and we may not be able to or may choose not to manage our exposure to these conditions.
Volatility caused by political, market or economic conditions can materially hinder the initiation of new, large-sized transactions for funds in our asset management business and, together with volatility in valuations of equity and debt securities, may adversely impact our operating results. It may also increase the risk that cash flows generated from our operations or the collateral underlying the structured products we own may differ from our expectations in timing or amount. In addition, many of our classes of investments, but in particular our alternative investments, may produce investment income that fluctuates significantly from period to period. Any event reducing the estimated fair value of these securities, other than on a temporary basis, could have a material and adverse effect on our business, results of operations, financial condition, liquidity and cash flows. Volatility and general economic trends are also likely to impact the performance of portfolio companies in many industries, particularly industries that are more affected by changes in consumer demand, such as the packaging, manufacturing, chemical and refining industries, as well as the travel and leisure, gaming and real estate industries. Our performance, and the performance of the funds we manage, may be adversely affected to the extent portfolio companies in these industries experience adverse performance or additional pressure due to downward trends. There is also a risk of both sector-specific and broad-based corrections and/or downturns in the equity and/or credit markets. Our profitability may also be adversely affected by our fixed costs and the possibility that we would be unable to scale back other costs, within a time frame sufficient to match any further decreases in net income or increases in net losses relating to changes in market and economic conditions.
Moreover, our retirement services business is materially affected by conditions in the capital markets and the U.S. economy generally, as well as by the global economy. Actual or perceived stressed conditions, volatility and disruptions in financial asset classes or various capital and credit markets can have an adverse effect on our retirement services business, both because such conditions may decrease the returns on, and value of, its investment portfolio and because its benefit and claim liabilities are sensitive to changing market factors. In times of economic hardship, the policyholders of our retirement services business may choose to defer paying insurance premiums, stop paying insurance premiums altogether or surrender their policies. In addition, actual or perceived difficult conditions in the capital markets may discourage individuals from making investment decisions and purchasing our retirement services products.
In addition, certain investments by funds or vehicles we manage may be based, in part, on assumptions regarding the availability, amount or duration of federal, state, local or foreign government programs, incentives, subsidies, regulatory frameworks or tax credits applicable to particular industries, assets or business activities. Such programs or incentives are often available only for limited periods, may be subject to phase-outs, caps or eligibility requirements, and may depend on continued legislative, regulatory or budgetary support. As a result, such programs or incentives may not be available for the full anticipated investment horizon, or on the terms initially expected, and may be delayed, modified, not renewed or eliminated. Any such developments could adversely affect the anticipated profitability, cash flows, valuation or exit opportunities of these investments, which in turn could negatively affect the performance of the funds or vehicles we manage, and our results of operations and cash flows.
34
Operating Risks
A portion of our revenues, earnings and cash flow is highly variable, which may make it difficult for us to achieve steady earnings growth on a quarterly basis, which may cause the price of our shares to be volatile.
A portion of our revenues, earnings and cash flow is highly variable, primarily due to the fact that performance fees from our asset management business and the transaction, structuring, advisory and other fees that we receive, can vary significantly from quarter to quarter and year to year. In addition, the investment returns of most of the funds and other vehicles we manage are volatile. We may also experience fluctuations in our results from quarter to quarter and year to year due to a number of other factors, including changes in the values of investments of the funds and other vehicles we manage, changes in the amount of distributions, dividends or interest paid in respect of investments, changes in our operating expenses, policyholder behavior, the degree to which we encounter competition and general economic and market conditions. Our future results will also be significantly dependent on the success of the larger funds we manage (e.g., Fund IX, Fund X and AAA), changes in the value of which may result in fluctuations in our results. In addition, performance fees from some of the funds and other vehicles we manage are subject to contingent repayment by the general partner if, upon the final distribution, the relevant fund’s general partner has received cumulative performance fees on individual portfolio investments in excess of the amount of performance fees it would be entitled to from the profits calculated for all portfolio investments in the aggregate. Such variability may lead to volatility in the trading price of our shares and cause our results for a particular period not to be indicative of our performance in a future period. It may be difficult for us to achieve steady growth in earnings and cash flow on a quarterly basis, which could in turn lead to large adverse movements in the price of our shares or increased volatility in the price of our shares in general.
The timing of performance fees generated by the funds and other vehicles we manage is uncertain and will contribute to the volatility of our results. Performance fees depend on the performance of the funds and other vehicles we manage. It takes a substantial period of time to identify attractive investment opportunities, to raise all the funds needed to make an investment and then to realize the cash value or other proceeds of an investment through a sale, public offering, recapitalization or other exit. Even if an investment proves to be profitable, it may be several years before any profits can be realized in cash or other proceeds. We cannot predict when, or if, any realization of investments will occur. Generally, if the funds we manage were to have a realization event in a particular quarter or year, it may have a significant impact on our results for that particular quarter or year that may not be replicated in subsequent periods. With respect to a number of credit funds, our performance fees are generally paid annually, semi-annually or quarterly, and the varying frequency of these payments will contribute to the volatility of our revenues and cash flow. Furthermore, we earn these performance fees only if the net asset value of a fund has increased or, in the case of certain funds, increased beyond a particular threshold, which is referred to as a “high water mark.” Such performance fees we earn are therefore dependent on the net asset value of investors’ investments in the fund or vehicle, which could lead to significant volatility in our results.
We may not be successful in expanding into new investment strategies, geographic markets and businesses and in attracting new types of investors, each of which may result in additional risks and uncertainties in our businesses.
We actively consider the opportunistic expansion of our businesses, both geographically and into new investment strategies and platforms, and intend, to the extent that market conditions warrant, to grow our businesses by increasing AUM in existing businesses and expanding into new investment strategies, platforms, geographic markets, businesses and distribution channels, including the retail channel. We intend to grow our business in the future in part by acquisitions and joint ventures, each of which could require additional cash and equity, systems development and skilled personnel. We may experience challenges identifying, financing, consummating and integrating such acquisitions and transactions. Our organizational documents do not limit us to the asset management and retirement services businesses. Accordingly, we may pursue growth through acquisitions of other investment management companies (such as our acquisition of Bridge Investment Group Holdings Inc. in 2025), acquisitions of critical business partners or other strategic initiatives, including entering into new lines of business.
We may not be successful in any such attempted expansion. Attempts to expand our businesses involve a number of special risks, including the diversion of management’s attention from our core businesses; the disruption of our ongoing businesses; entry into markets or businesses in which we may have limited or no experience; increasing demands on our operational systems and infrastructure; potential increase in investor concentration; enhanced regulatory scrutiny and greater reputational and litigation risk; difficulty in combining or integrating operational and management systems; and the broadening of our geographic footprint, increasing the risks associated with conducting operations in foreign jurisdictions (including regulatory, tax, legal and reputational consequences). Additionally, any expansion of our businesses could result in significant increases in
35
our outstanding indebtedness and debt service requirements, which would increase the risks of investing in our shares, and may adversely impact our results of operations and financial condition.
We also may not be successful in identifying new investment strategies or geographic markets that increase our profitability, or in identifying and acquiring new businesses that increase our profitability. We have also entered into strategic partnerships, separately managed accounts and sub-advisory arrangements, which lack the scale of the funds we traditionally manage and are more costly to administer. The prevalence of these accounts may also present conflicts, introduce complexity in the deployment of capital and result in additional costs and expenses.
Before expanding into new investment strategies, or making any fund investments generally, we conduct due diligence that we deem reasonable and appropriate based on the facts and circumstances applicable to each investment. When conducting due diligence, we may be required to evaluate important and complex issues, including but not limited to those related to business, financial, credit risk, tax, accounting, environmental, legal and regulatory and macroeconomic trends. The due diligence investigation that we will carry out may not reveal or highlight all relevant facts (including fraud) or risks that may be necessary or helpful in evaluating such investment opportunity, including past or current violations of law and related legal exposure, and we may not identify or foresee future developments that could have a material adverse effect on an investment (e.g., technological disruption across an industry).
We have increasingly undertaken business initiatives to increase the number and type of products offered to individual investors, which could expose us to new and greater levels of risk.
We have increasingly undertaken business initiatives to increase the number and type of products, including externally managed vehicles, offered to investors, especially individual (non-institutional) investors (including investors often described as high net worth individuals, family offices and mass affluent individuals), in the U.S. and other jurisdictions around the world. Our investment adviser subsidiaries or affiliates currently externally manage or advise a number of such vehicles, and a number of other vehicles are expected to be launched at various times in the future. In some cases, the offerings are distributed to such investors indirectly through third-party managed vehicles sponsored by brokerage firms, private banks or other third parties, and in other cases directly to the qualified clients of private banks, independent investment advisors and brokers. In other cases, we create products specifically designed for direct investment by individual investors in the U.S., many of whom are not accredited investors, or similar investors in non-U.S. jurisdictions, including in Europe and Asia. Such products are regulated by the SEC in the U.S. and by other similar regulatory bodies in other jurisdictions.
Accessing individual investors and selling products directed at such investors exposes us to new and greater levels of risk, including heightened litigation and regulatory enforcement risks, an increased compliance burden, and more complex administration and accounting operations. As the number and complexity of our investment products and vehicles increases, the operational demands and complexity of our business has also increased, which could strain the sufficiency of our systems, infrastructure, and personnel required to manage the volume and complexity of this growth. We also may be subject to claims related to matters such as the adequacy of disclosures, appropriateness of fees, suitability and board of directors’ oversight, each which could result in civil lawsuits, regulatory penalties and enforcement actions. Our registered investment advisers could also be subject to direct or derivative claims from a fund’s investors or board of directors for alleged mismanagement of the fund. In addition, regulatory requirements imposing limitations on the ability of affiliates of certain of our vehicles to engage in certain transactions may limit our funds’ ability to engage in otherwise attractive investment opportunities.
We continue to distribute products through new channels and markets, including through unaffiliated third-party firms, and we may not be able to effectively monitor or control the manner of distribution, which could result in litigation or regulatory action against us, including with respect to, among other things, claims that products distributed through such channels are distributed to investors for whom they are unsuitable, or claims related to conflicts of interest or the adequacy of disclosure to investors or claims that the products are distributed in a manner inconsistent with our regulatory requirements or otherwise inappropriate manner. In addition, regulations applicable to our arrangements with such distributors and channels increase the compliance burden associated with onboarding new distributors or pursuing new distribution channels, resulting in increased cost and complexity. Although we engage in due diligence and onboarding procedures that seek to uncover issues relating to the third parties through which individual investors access our products, we do not control and have limited information regarding many of these third-party channels and, therefore, we are exposed to the risks of reputational damage, regulatory scrutiny and legal liability to the extent such third parties improperly sell our products to investors.
36
Similarly, there is a risk that Apollo employees involved in the direct distribution of our products, or employees who oversee independent advisors, brokerage firms and other third parties around the world involved in distributing our products, do not follow our compliance and supervisory procedures. In addition, the distribution of such products, including through new channels, whether directly or through market intermediaries, could expose us to allegations of improper conduct and/or actions by state and federal regulators in the U.S. and regulators in jurisdictions outside of the U.S. with respect to, among other things, product suitability, distributor eligibility, investor classification, compliance with securities laws, conflicts of interest and the adequacy of disclosure to investors to whom our products are distributed through those channels.
In addition, many of the products that we make available to individual investors contain terms that permit such investors to request redemption or repurchase of their interests on a periodic basis and, subject to certain limitations, include limits on the aggregate amount of such interests that may be redeemed or repurchased in a given period. Challenging market or economic conditions and liquidity needs could cause elevated share redemption or repurchase requests from investors in such products. In addition, limitations can be placed on the amount of redemptions or repurchases that are fulfilled. Such limitations are particularly possible in the event redemption or repurchase requests are elevated or investor subscriptions to such products are concurrently at reduced levels. Such limitations may subject us to reputational harm and may make such vehicles less attractive to individual investors, which could have a material adverse effect on the cash flows of such vehicles. This may in turn negatively impact the revenues we derive from such vehicles.
As we expand the distribution of products to individual investors outside of the U.S., we are increasingly exposed to risks in non-U.S. jurisdictions. While many of the risks we face in non-U.S. jurisdictions are similar to those that we face in the distribution of products to individual investors in the U.S., securities laws and other applicable regulatory regimes can be extensive, complex and vary by jurisdiction. In addition, the distribution of products to individual investors outside of the U.S. may involve complex structures and market practices that vary by local jurisdiction. As a result, this expansion subjects us to additional complexity, litigation and regulatory risk.
In addition, our initiatives to expand our individual investor base, including outside of the U.S., requires the investment of significant time, effort and resources, including the potential hiring of additional personnel, the implementation of new operational, compliance and other systems and processes and the development or implementation of new technology. There is no assurance that such efforts will be successful. Moreover, as individual investor targeted initiatives continue to grow across the alternative asset management industry, there may be the introduction of new regulatory, oversight or disclosure requirements that make our initiatives to expand our individual investor base more difficult to achieve.
We operate in highly competitive industries, which could limit our ability to achieve our growth strategies and could materially and adversely affect our businesses, financial condition, results of operations, cash flows and prospects.
We operate in highly competitive markets and compete with a large number of investment management and alternative asset management firms, private equity, credit and real assets fund sponsors, U.S. and non-U.S. insurance and reinsurance companies, broker-dealers, financial advisors, asset managers and other financial institutions. In particular, competition in our asset management business is based on a variety of factors, including investment performance, business relationships, quality of service provided to clients, investor availability of capital and willingness to invest, fund terms (including fees and liquidity terms), brand recognition, types of products offered and business reputation. Our investment business, as well as our investment funds, compete with a number of private funds, specialized investment funds, funds structured for individual investors, hedge funds and other sponsors managing pools of capital, as well as corporate buyers and traditional asset managers.
Competition for our business extends beyond fundraising and includes competition to source, originate, structure, finance and syndicate investments, acquire portfolio companies and strategic assets and deploy capital across private equity, private credit, real assets and other alternative strategies. We also compete with financial institutions and other market participants in connection with acquisitions, investments, financings, originations, syndications and other strategic transactions, and competitive pressures in these areas may affect pricing, transaction terms, investment returns and our ability to deploy capital efficiently. In addition, our retirement services business faces significant competition from traditional insurers and reinsurers, asset managers and other financial institutions offering annuity, pension risk transfer and other retirement products, as well as from alternative capital providers seeking exposure to similar long-duration liabilities or asset classes. In these markets, competition is based on factors such as pricing, product design and structure, underwriting standards, investment performance, financial strength, financial strength ratings, credit ratings, scale, distribution capabilities, regulatory capital considerations and the ability to source and manage assets aligned with retirement and insurance liabilities.
37
Our competitors may have greater financial, fundraising, technical, research, marketing and other resources, more established relationships, broader product offerings, lower costs of capital or higher risk tolerances than we do. Some competitors may be willing or able to pursue opportunities or strategies or retirement-related transactions on more aggressive terms, including by accepting lower returns or greater risk, which could reduce the availability of attractive opportunities or require us to adjust pricing, structure or terms. As a result of these competitive dynamics across our asset management and retirement services businesses, we may experience increased difficulty in attracting and retaining investors, originating or executing transactions on favorable terms, maintaining or increasing fees, deploying capital effectively or achieving our growth objectives.
In addition, we may face other competitive risks beyond those specific to the businesses in which we operate. For example, the use and implementation of artificial intelligence, including machine learning technology and generative artificial intelligence (collectively, “AI Technologies”), and products and platforms involving digital assets and distributed ledger technologies also have the potential to significantly disrupt the way financial institutions, including investment managers and asset managers, do business or attract and address investor demands and strategies, resulting in further competitive pressures for our business. These competitive pressures may materially adversely affect on our growth, business, financial condition, results of operations, cash flows and prospects.
Our business, financial condition, results of operations, liquidity and cash flows depend on the accuracy of our management’s assumptions and estimates, and we could experience significant gains or losses if these assumptions and estimates differ significantly from actual results.
We make and rely on certain assumptions and estimates regarding many matters related to our businesses, including valuations, interest rates, investment returns, expenses and operating costs, tax assets and liabilities, tax rates, business mix, surrender activity, mortality and contingent liabilities. We also use these assumptions and estimates to make decisions crucial to our business operations. We use assumptions and estimates to make decisions about pricing, target returns and expense structures for our insurance subsidiaries’ products and pension group annuity transactions; determining the amount of reserves our retirement services business is required to hold for its policy liabilities; determining the price our retirement services business will pay to acquire or reinsure business; determining the hedging strategies we employ to manage risks to our business and operations; and determining the amount of regulatory and rating agency capital that our insurance subsidiaries must hold to support their businesses. Similarly, our management teams make similar assumptions and estimates in planning and measuring the performance of our asset management business. In addition, certain investments and other assets and liabilities of our asset management business and our retirement services business must be, or at our election are, measured at fair value the determination of which involves the use of various assumptions and estimates and considerable judgment. The factors influencing these various assumptions and estimates cannot be calculated or predicted with certainty, and if our assumptions and estimates differ significantly from actual outcomes and results, our business, financial condition, results of operations, liquidity and cash flows may be materially and adversely affected.
We depend on certain key personnel and the loss of their services could have a material adverse effect on us.
The success of our businesses depends on the efforts, judgment, business relationships, personal reputations and continued service of our key personnel. The loss of the services of any of our key personnel or damage to their personal or professional reputation could have a material adverse effect on our business. Accordingly, our retention of our key personnel and our success in recruiting additional personnel is crucial to our success. If any of our key personnel were to join or form a competitor, our business could similarly suffer a material adverse effect. For example, some of the investors in the funds we manage could choose to invest with that competitor, another competitor or not at all, rather than in the funds we manage. We do not carry any “key man” insurance that would provide us with proceeds in the event of the death or disability of any of our key personnel. We may also not succeed in recruiting additional personnel because the market for qualified professionals is extremely competitive. Efforts to retain or attract key personnel may result in significant additional expenses, which could adversely affect our profitability.
In addition, the governing agreements of certain of the funds we manage provide that in the event certain investment professionals and other key personnel fail to devote the requisite time to our businesses, the investment period will terminate. In some instances, such termination becomes effective only if coupled with a certain percentage in interest of the fund investors or the respective fund advisory board, if applicable, not voting to continue the investment period. In addition to having a significant negative impact on our revenue, net income and cash flow, the occurrence of such an event with respect to any of the funds we manage would likely result in significant reputational damage to us.
38
Actual or alleged misconduct, unethical behavior and other activities by our current and former employees, directors, advisers, third-party service providers or others affiliated with us could harm us by impairing our ability to attract and retain investors and by subjecting us to significant legal liability, regulatory scrutiny and reputational harm.
There is a risk that our employees, directors, advisers, third-party service providers or others affiliated with us could engage, including deliberately or recklessly, in actual or perceived misconduct, unethical behavior or fraud and/or participate in outside activities that creates reputational harm and/or legal exposure for us and adversely affects our businesses. With respect to our retirement services business, our insurance businesses rely on third-party intermediaries to sell our products and services and we further rely on third-party administrators to administer a portion of our annuity contracts as well as our legacy life insurance business. If anyone associated or affiliated with us, or the portfolio companies of the funds we manage, were to engage, or be accused of engaging, in illegal, unethical or suspicious activities, sexual harassment, impermissible discrimination, improper use or disclosure of confidential information, fraud, payment or solicitation of bribes, misrepresentation of products and services or any other type of similar misconduct or violation of other laws and regulations, regardless of whether such activity is related to our business, management’s resources and attention could be diverted, and we could receive negative publicity, suffer serious harm to our brand and reputation, be subject to increased regulatory scrutiny, penalties or sanctions, face difficulties in raising funds or generating business, experience a broader backlash against the company and its affiliated entities, suffer serious harm to our financial position and current and future business relationships, as well as face potentially significant litigation or investigations.
Fraud, payment or solicitation of bribes and other deceptive practices or other misconduct at the portfolio companies of the funds we manage could similarly subject us to liability and reputational damage and also harm our performance. There are a number of grounds upon which such misconduct at a portfolio company could subject us to criminal and/or civil liability, including on the basis of actual knowledge, willful blindness, or control person liability.
We rely on technology and information systems, many of which are controlled by third-party vendors, to maintain the security of our information and technology networks and to conduct our businesses, and any failures or interruptions of these systems could adversely affect our businesses and results of operations.
We are subject to various risks and costs associated with the collection, handling, storage and transmission of personally identifiable information. In the ordinary course of our business, we collect and store a range of data, including our proprietary business information and intellectual property, and personally identifiable information of our employees, our investors, our retirement services business policyholders and other third parties, in our data centers and on our networks and we rely on technology and information systems to execute, confirm and settle transactions. We rely on a host of information systems and hardware systems for the secure processing, maintenance and transmission of this information, and the unavailability of these systems or the failure of these systems to perform as anticipated for any reason could disrupt our businesses and could result in decreased performance and increased operating costs, causing our businesses and results of operations to suffer.
Although we are not currently aware of any security incidents or cyberattacks that, individually or in the aggregate, have materially affected, or would reasonably be expected to materially affect, our operations or financial condition, there can be no assurance that the various procedures and controls we utilize to mitigate these threats will be sufficient to prevent disruptions to our systems, especially because the cyberattack techniques used change frequently and are not recognized until launched, the full scope of a cyberattack may not be realized until an investigation has been performed and cyberattacks can originate from a wide variety of sources. We rely on industry accepted security measures and technology to securely maintain confidential and proprietary information maintained on our information systems. Although we take protective measures and endeavor to strengthen our computer systems, software, technology assets and networks to prevent and address potential cyberattacks, there can be no assurance that any of these measures will prove effective. Furthermore, delays in the maintenance, updates, upgrading, or patching of our information systems could adversely impact their effectiveness or could expose us, as well as our clients and others who rely upon, or have exposure to, our systems, to security and other risks. The rapid evolution and increasing prevalence of AI Technologies may also increase our cybersecurity risks, and we may not be able to anticipate, prevent, mitigate or remediate all of the potential risks, challenges or impacts as a result of the use of AI Technologies.
We are also dependent on an increasingly concentrated group of third-party vendors that we do not control for hosting the information systems and hardware systems that are critical to our businesses. We rely on third-party service providers for certain aspects of our businesses, including for certain information systems, technology and administration of the funds we manage and compliance matters. While we require our critical third-party suppliers to implement and maintain what we believe to be effective cybersecurity and data protection measures, we cannot guarantee that third parties and infrastructure in our supply chain or our partners’ supply chains have not been compromised or that they do not contain exploitable defects or bugs
39
that could result in a breach of or disruption to our information technology systems or the third-party information technology systems that support our services. Our ability to monitor these third parties’ information security practices is limited, and they may not have adequate information security measures in place. In addition, if one of our third-party suppliers suffers a security breach, which has happened in the past, our response may be limited or more difficult because we may not have direct access to their systems, logs and other information related to the security breach. A disaster, disruption or compromise in technology or infrastructure that supports our businesses, including a disruption involving electronic communications or other services used by us, our vendors or third parties with whom we conduct business, may have an adverse impact on our ability to continue to operate our businesses without interruption which could have a material adverse effect on us. These risks could increase as vendors increasingly offer cloud-based software services rather than software services that can be operated within our own data centers. These risks also increase to the extent we engage in operations outside the U.S. We also rely on data processing systems and the secure processing, storage and transmission of information, including payment and health information. A disruption or compromise of these systems could have a material adverse effect on our business. In addition, costs related to data security threats or disruptions may not be fully insured or indemnified by other means.
As new technologies, including tools that harness generative artificial intelligence and other machine learning techniques, rapidly develop and become even more accessible, the use of such new technologies by us, our affiliates and our third-party service providers will present additional known and unknown risks, including, among others, the risk that confidential information may be stolen, misappropriated or disclosed and the risk that we and/or third-party service providers may rely on incorrect, unclear or biased outputs generated by such technologies, any of which could have an adverse impact on us, our reputation and our business.
A significant actual or potential theft, loss, corruption, exposure, fraudulent, unauthorized or accidental use or misuse of investor, policyholder, employee or other personally identifiable or proprietary business data, whether by third parties or as a result of employee malfeasance or otherwise, non-compliance with our contractual or other legal obligations regarding such data or intellectual property or a violation of our privacy and security policies with respect to such data could result in significant remediation and other costs, fines, litigation and regulatory actions against us by the U.S. federal and state governments, the EU or other jurisdictions, various regulatory organizations or exchanges, or affected individuals, in addition to significant reputational harm.
Additionally, although the prevalence and scope of applications of distributed ledger technology, cryptocurrency and similar technologies is growing, the technology is nascent and may be vulnerable to cyberattacks or have other inherent technological weaknesses. We and the funds we manage are exposed to risks, and may become exposed to additional risks, related to distributed ledger technology and the financial products that use it, such as blockchain, cryptocurrencies and other digital assets, or decentralized finance (DeFi) and related applications, including through our offering funds and other products, facilitating clients’ activities and investing in financial products that use blockchain, cryptocurrencies or other digital assets; our reliance on companies that use, develop or rely on distributed ledger technology; use of distributed ledger technology by third-party vendors, clients, counterparties, clearinghouses and other financial intermediaries with whom we transact; and the receipt of cryptocurrencies or other digital assets as collateral. Market volatility of financial products using distributed ledger technology may increase these risks and may also expose us to increased compliance risks.
AI Technologies could increase competitive, operational, legal and regulatory risks to our businesses in ways that we cannot predict.
Technological developments in AI Technologies and their current and potential future applications, including in the private investment, financial and insurance sectors, as well as the legal and regulatory frameworks within which they operate, are rapidly evolving. The full extent of current or future risks related thereto is not possible to predict and we may not be able to anticipate, prevent, mitigate or remediate all of the potential risks, challenges or impacts of such changes. AI Technologies could significantly disrupt the business models, investment strategies, operational processes, and markets in which we operate and subject us to increased competition, legal and regulatory risks and compliance costs, which could have a material and adverse effect on our business, financial condition, results of operations, liquidity and cash flows. We also face competitive risks if we fail to adopt AI Technologies in a timely fashion. Advancements in computing and AI Technologies, including efficiency improvements, without related increases in the adoption and development of such technologies, could also negatively impact demand for, and the valuation of, digital infrastructure assets, a sector to which certain of our investment strategies have significant exposure.
Through our use of AI Technologies, we avail ourselves of the potential benefits, insights and efficiencies resulting from these technologies. For example, our employees can utilize internal generative AI-powered applications to help summarize, search or
40
translate documents or gather information on a wide variety of topics. However, these technologies also present a number of potential risks that cannot be fully mitigated. If the data we, our affiliates or third parties whose services we rely on, use in connection with the possible development or deployment of AI Technologies (including employee data and data related to, or used in, workplace operations) is incomplete, incorrect, inadequate or biased in some way, it may result in flawed algorithms, reduce the effectiveness of AI Technologies, adversely impact us and our operations, and could subject us to legal and regulatory investigations and/or actions. There is also a risk that AI Technologies and data used therewith may be misused or misappropriated by our employees or third-party service providers or other third parties. Further, we may not be able to control how third-party AI Technologies that we choose to use are developed or maintained, or how data we input is used or disclosed, even where we have sought contractual protections with respect to these matters. The misuse or misappropriation of our data, including material non-public information, unavoidable deficiencies in the practices associated with data collection, training AI technology on large data sets and big data analytics and difficulties in validating data could have an adverse impact on our reputation, subject us to legal and regulatory investigations and/or actions and create competitive risk. Additionally, the volume and reliance on data and algorithms also make AI Technologies, and in turn us, more susceptible to cybersecurity threats, including compromising underlying models, training data, or other intellectual property. We could be exposed to risks to the extent of our use or third-party service providers, or any counterparties use of AI Technologies in their business activities. While we expect, from time to time, to adopt and adjust usage policies and procedures governing the use of AI Technologies by our personnel, there is a risk of misuse of such AI Technologies, failure of such AI Technologies to be available or to perform, or data leakage on account of use of such AI Technologies, any of which could cause a material harm to us or our portfolio companies. In addition, some of our competitors may be more successful than us in the development and implementation of new technologies, including services and platforms based on artificial intelligence, to address investor demands or improve operations. If we are unable to adequately advance our capabilities in these areas, or do so at a slower pace than others in our industry, we may be at a competitive disadvantage.
The use of AI Technologies also requires our compliance with legal or regulatory frameworks that are not fully developed or tested, and we may face litigation and regulatory actions related to our use of AI Technologies, including intellectual property infringement and misappropriation claims, and claims related to alleged misuse or misappropriation of our data. This could have a material and adverse impact on our business, financial condition, results of operations, liquidity and cash flows. There has been increased scrutiny, including from global regulators, regarding the use of “big data,” diligence of data sets and oversight of data vendors. Our ability to use data to gain insights into and manage our business may be limited in the future by regulatory scrutiny and legal developments. We may also communicate externally regarding AI Technology-related initiatives, including our development and use of AI Technologies, which subjects us to the risk of being accused of making inaccurate or misleading statements regarding our ability to avail ourselves of the potential benefits of AI Technology.
Regulations related to AI Technologies continue to evolve and may also impose on us certain obligations and costs related to monitoring and compliance. The costs of preparing for, monitoring and complying with laws and regulations related to AI Technologies, and any claims or penalties as the result of any use of or reliance on AI Technologies, could, if applicable, adversely affect us, us and/or third parties connected to us (whether directly or indirectly), which could adversely affect our business and results of operations.
Many of the funds we manage invest in illiquid assets and many of the investments of our retirement services business are relatively illiquid and we may fail to realize profits from these assets for a considerable period of time, or lose some or all of the principal amount we invest in these assets if we are required to sell our invested assets at a loss at inopportune times or in response to changes in applicable rules and regulations.
Many of the funds we manage invest in securities or other financial instruments that are not publicly traded or are otherwise viewed as “illiquid.” In many cases, the funds we manage may be permitted by contract or by applicable securities laws to sell such securities only after a period of time and then only at such times when we do not possess material nonpublic information. The ability of many funds, particularly the private equity funds, to dispose of investments is heavily dependent on the capital markets and in particular the public equity markets, including hybrid equity and hybrid credit markets. Many of the funds we manage invest in private credit opportunities and the ability to dispose of such instruments prior to maturity is heavily dependent upon the secondary trading market for such instruments. Such markets are still developing and could be subject to periods where the general partner of the fund deems the level of trading not to be appropriate. Furthermore, large holdings even of publicly traded securities can often be disposed of only over a substantial period of time, exposing the investment returns to risks of downward movement in market prices during the disposition period. Accordingly, the funds we manage may be forced, under certain conditions, to sell securities at a loss.
41
In addition, many investments by our retirement services business are in securities that are not publicly traded or that otherwise lack liquidity, such as its privately placed fixed maturity securities, below investment grade securities, investments in mortgage loans and other alternative investments. These relatively illiquid types of investments are recorded at fair value. If a material liquidity demand is triggered and we are unable to satisfy the demand with the sources of liquidity available to us, our retirement services business could be forced to sell certain of its assets and there can be no assurance that it would be able to sell them for the values at which such assets are recorded and it might be forced to sell them at significantly lower prices. In many cases, our retirement services business may also be prohibited by contract or applicable securities laws from selling such securities for a period of time. Thus, it may be impossible or costly to liquidate positions rapidly in order to meet unexpected withdrawal or recapture obligations. This potential mismatch between the liquidity of assets and liabilities could have a material and adverse effect on our business, financial condition, results of operations and cash flows.
Further, governmental and regulatory authorities periodically review legislative and regulatory initiatives, and may promulgate new or revised, or adopt changes in the interpretation and enforcement of existing, rules and regulations at any time that may impact our investments. Such changes in regulatory requirements could disrupt market liquidity, make it more difficult for us to source and invest in attractive private investments, and cause securities that are not publicly traded to lose value, any of which could have a material and adverse effect on our business, financial condition or results of operations.
We rely on the financing markets for the operation of our business.
We rely on the debt and equity financing markets for the operation of our business. To the extent that debt and equity markets render financing difficult to obtain, refinance or extend, or more expensive, this may have a material and adverse effect on our business, financial condition, results of operations, liquidity and cash flows. In addition, the ability of the funds we manage to exit investments on favorable terms or at all is heavily dependent on the condition of the applicable markets.
Many of the funds we manage utilize subscription lines of credit, net asset value-based fund finance facilities or similar financing arrangements, margin loans or other derivative financing arrangements to fund operations and investments, including their equity contributions in a portfolio company. Some of these are also intended as a source of longer-term borrowings for investments by the relevant funds. In other cases, some funds make investments through the use of such facilities or arrangements that are backed by the fund’s investment portfolio. The interest expense and other costs incurred in connection with such indebtedness may not be recovered by appreciation in the assets purchased or carried, and will be lost, and the timing and magnitude of such losses may be accelerated or exacerbated in the event of a decline in the market value of such assets. Gains realized with borrowed funds may cause the fund’s net asset value to increase at a faster rate than would be the case without borrowings. However, if investment results fail to cover the cost of borrowings, the fund’s net asset value could also decrease faster than if there had been no borrowings. The inability to obtain such financing on attractive terms or at all may impact the ability of the funds we manage to achieve targeted rates of return. Moreover, certain of the funds we manage allow for investors to leverage part of their subscription, and consequently any losses or adverse results at the fund-level could be exacerbated. Because leveraged investments are inherently more sensitive to declines in revenues and to increases in expenses and interest rates, levered investors may also be at substantially increased risk of loss of their investment.
Additionally, certain investments by the funds we manage rely heavily on the use of leverage. The absence of available sources of debt financing for extended periods of time could materially and adversely affect the funds we manage. In the event that funds we manage are unable to obtain committed debt financing for potential investments, including acquisitions, or can only obtain debt at an increased interest rate or otherwise on unfavorable terms, such funds may be forced to find alternative sources of financing (including equity), may have difficulty completing otherwise profitable investments or may generate profits that are lower than would otherwise be the case, any of which could lead to a decrease in the investment income earned by us. Any failure by lenders to provide previously committed financing can also expose us to potential claims by counterparties with which funds we manage have contracted to effectuate an investment transaction (i.e., sellers of businesses that funds we manage may have contracted to purchase). In addition, to the extent that the current markets make it difficult or impossible for a portfolio company to refinance debt that is maturing in the near term, it may face substantial doubt as to its status as a going concern (which may result in an event of default under various agreements) or it may be unable to repay such debt at maturity and be forced to sell assets, undergo a recapitalization or seek bankruptcy protection. Furthermore, investments in highly leveraged entities are inherently more sensitive to declines in revenues, increases in expenses and interest rates and adverse economic, market and industry developments. As a result, the risk of loss associated with a leveraged entity is generally greater than for companies with comparatively less debt.
In addition, our retirement services business relies on access to lending and debt markets to provide capital and liquidity. Changes in debt financing markets may impact our retirement services business’ access to capital and liquidity. Calculations of
42
required insurance capital may move with market movements and result in greater capital needs during economic downturns. Our retirement services business may also need additional liquidity to pay insurance liabilities in excess of its assumptions due to market impacts on policyholder behavior.
We are subject to operating and financial restrictions arising from our indebtedness.
We are subject to operating and financial restrictions arising from our indebtedness, which include restrictive covenants that, subject to certain exceptions, limit certain operational, financial or structural decisions we can make. As a result of these restrictions, we may be limited in how we conduct our operations and may be unable to raise additional debt financing to compete effectively or to take advantage of new business opportunities. Any future indebtedness we incur may also contain significant operating and financial restrictions.
Risks Relating to Our Asset Management Business
We may experience a decline in revenue from our asset management business.
In our asset management business, we derive revenues from:
•capital committed to the funds, invested by the funds, or the net asset value of the funds;
•management fees, which are based generally on the amount of capital committed or invested in, or the net asset value of, the funds we manage;
•in connection with services relating to investments by the funds we manage, fees earned or otherwise collected by one or more service providers affiliated with us;
•performance fees, based on the performance of the funds we manage; and
•investment income from our investments, including as general partner.
If a fund we manage performs poorly, we will receive little or no performance fees with regard to the fund and little income or possibly losses from any principal investment in the fund. Furthermore, if, as a result of poor performance of later investments in a fund’s life, the fund does not achieve total investment returns that exceed a specified investment return threshold for the life of the fund, we could be obligated to repay the amount by which performance fees that were previously distributed to us exceeds amounts to which we are ultimately entitled. We have in the past, and may in the future, incur such clawback repayment obligations in respect of the funds we manage.
A variety of fees that we earn, such as origination, syndication, arranger, placement, sourcing, structuring and other similar fees, are driven in part by the pace at which the funds we manage commit to make or make investments. Any decline in the pace at which the funds we manage make investments would reduce our origination, syndication, arranger, placement, structuring, sourcing and other similar fees and could make it more difficult for us to raise capital. Likewise, any increase in the pace at which the funds we manage exit investments would reduce origination, syndication, arranger, placement, structuring, sourcing and other similar fees to the extent additional investment opportunities are not available to redeploy all or a portion of the proceeds. In addition, we will experience a decrease in the amount of fee revenue if we share with fund investors a larger portion, or all, of certain types of fees generated by funds’ investments, such as management consulting fees and merger and acquisition transaction advisory fees, or if expenses arising from the operation of the funds we manage are borne by us alone, rather than the funds.
Additionally, certain of our subsidiaries perform underwriting, syndicating and securities placement services for the funds we manage and their portfolio companies, for investments made by our retirement services business and for third parties. Our ability to maintain or grow these services, and the related fees we earn therefrom, depends on a number of factors, some of which are outside our control, including conditions in the debt or equity markets.
In each instance, a decrease in the fees we receive from the funds we manage and other operating activities will lead to a decrease in our revenues and may have a materially adverse impact on our business and results of operations.
We depend on investors in the funds we manage for the continued success of our asset management business.
It could become increasingly difficult for the funds we manage to raise capital as funds compete for investments from a limited number of qualified investors. Without the participation of investors, the funds we manage will not be successful in
43
consummating their capital-raising efforts, or they may consummate them at investment levels lower than those currently anticipated.
Certain institutional investors have publicly criticized compensation arrangements, including management consulting fees and merger and acquisition transaction advisory fees, as well as additional types of fees paid to affiliated service providers, such as syndication, sourcing, structuring and placement fees, many of which are not subject to management fee-offsets as contemplated by governing documents of the funds we manage. Although we have no obligation to modify any fees or other terms with respect to the funds we manage, we experience pressure to do so. In addition, certain institutional investors, including sovereign wealth funds and public pension funds, continue to demonstrate an increased preference for alternatives to the traditional investment fund structure, such as managed accounts, specialized funds and co-investment vehicles. Even though we have entered into such strategic arrangements, there can be no assurance that such alternatives will be as profitable to us as traditional investment fund structures. While we have historically competed primarily on the performance of the funds we manage, and not on the level of our management fees or performance fees relative to those of our competitors, there is a risk that management fees and performance fees in the alternative investment management industry will decline, without regard to the historical performance of a manager. Management fee or performance fee reductions on existing or future funds, without corresponding decreases in our cost structure even if other revenue streams increase, would adversely affect our revenues and profitability.
The failure of the funds we manage to raise capital in sufficient amounts and on satisfactory terms could result in a decrease in AUM, performance fees and/or fee revenue or could result in us being unable to achieve an increase in AUM, performance fees and/or fee revenue, and could have a material adverse effect on our financial condition and results of operations. Similarly, any modification of our existing fee arrangements or the fee structures for new funds could adversely affect our results of operations.
We continue to depend on investors in the funds we manage even after the capital-raising phase of any fund. Investors in many of the funds we manage make capital commitments to those funds that we are entitled to call from those investors at any time during prescribed periods. If investors were to fail to satisfy a significant amount of capital calls for any particular fund or funds, the operation and performance of those funds could be materially and adversely affected. Additionally, the governing documents of substantially all of the funds we manage in which there are third-party investors provide that a simple majority-in-interest of a fund’s unaffiliated investors have the right to liquidate that fund for any or no reason, which would cause management fees and performance fees to terminate. We do not know whether, and under what circumstances, the investors in the funds we manage are likely to exercise such right. Furthermore, the management agreements of the funds we manage would also terminate if we were to experience a change of control without obtaining fund investor consent. We cannot be certain that consents required for the assignment of our management agreements will be obtained if such a deemed change of control occurs.
The governing agreements of certain of the funds we manage allow the investors of those funds to, among other things, (i) terminate the investment period of the fund in the event that certain “key persons” fail to devote the requisite time to managing the fund, (ii) (depending on the fund) terminate the investment period, dissolve the fund or remove the general partner if we, as general partner or manager, or certain “key persons” engage in certain forms of misconduct, (iii) dissolve the fund or terminate the investment period upon the affirmative vote of a specified percentage of limited partner interests entitled to vote, or (iv) dissolve the fund or terminate the investment period upon a change of control. In addition to having a significant negative impact on our revenue, net income and cash flow, the occurrence of such an event with respect to any of the funds we manage would likely result in significant reputational damage to us.
Investors in some of the funds we manage may also at times redeem their investments on an annual, semiannual, quarterly or monthly basis following the expiration of a specified period of time when capital may not be redeemed (typically between one and five years). In a declining market, the pace of redemptions and consequent reduction in our AUM could accelerate. We also refer to a significant portion of our AUM as perpetual capital or permanent capital as such assets have an indefinite duration and may only be withdrawn under certain conditions or subject to certain limitations. The investment management, advisory or other service agreements with our perpetual capital vehicles may be terminated under certain circumstances and investors can redeem from certain perpetual capital vehicles subject to certain conditions and limitations. This perpetual capital component of our AUM should not be viewed as being permanent without exception given that the assets can be subject to material reductions and even termination. The decrease in revenues that would result from significant redemptions in these funds or material reductions in, or terminations with respect to, our perpetual capital could have a material adverse effect on our businesses, revenues, net income and cash flows.
44
We are also subject to certain guidelines regarding investment allocation and strategy and other investment restrictions or limitations imposed by the governing documents of the funds we manage as well as arrangements with investors in the funds, accounts and other vehicles we manage. Our failure to comply with such guidelines, restrictions or limitations could result in clients terminating their investment management agreements with us, and investors seeking to withdraw from funds and/or being unwilling to commit new capital, which could cause our earnings to decline.
Certain investors have placed increased importance on the impact of investments made by the funds to which they commit capital on sustainability-related issues and, conversely, certain other investors may sell to minimize or restrict the application of such restraints on the investment-deployment process. Consequently, certain investors may decide not to commit capital in fundraises, or to withdraw previously committed capital from the funds we manage, based on their evolving priorities. Certain investors may also condition capital commitments in a way that may constrain a fund’s capital deployment opportunities, including by limiting investment opportunities in certain sectors, or taking certain actions, or refraining therefrom, that could adversely impact the value of an investment or that could improve the value of an investment. In addition, regulatory initiatives requiring asset managers and investors to make sustainability-related disclosures for, and/or classify, certain funds and their investments against certain criteria are becoming more common. Some disclosure and/or categorization requirements may be subjective and, accordingly, open to interpretation. If regulators disagree with our interpretation of such disclosure obligations and/or the categorization methodologies we use, or new regulations, legislation, or regulatory guidance require a methodology of measuring or disclosing sustainability-related information that is different from our current practice, it could result in increased compliance costs and/or have an adverse effect on fundraising efforts. Given the scrutiny on sustainability-related matters as well as the increasing number of regulatory obligations relating to our business, our investors, the funds we manage, and their investments, we risk being perceived as or accused of making inaccurate or misleading statements regarding the investment strategies of the funds we manage, as well as about our, the funds’, and their investments’ performance against sustainability-related measures and/or initiatives. Any such perception or accusation could adversely impact our ability to raise capital and attract new investors.
Conversely, so-called “anti-DEI” sentiment and related public policy actions have gained prominence in the U.S. In recent periods and as part of evolving public policy initiatives, certain federal and state authorities have issued executive orders, enacted or proposed legislation, issued legal opinions or taken other actions that restrict, discourage or prohibit DEI initiatives, including by eliminating or limiting DEI programs or offices within governmental entities, restricting DEI-related training or policies and, in some cases, imposing requirements or conditions on entities that contract with, receive funding from, or otherwise conduct business with governmental authorities. For example, certain executive orders have directed federal agencies to terminate DEI programs and to eliminate policies perceived as providing preferential treatment based on protected characteristics, and similar actions have been taken or proposed at the state level. In addition, certain governmental officials and regulators have publicly criticized or targeted DEI-related policies and practices and have initiated or threatened investigations, enforcement actions or other proceedings in connection with such initiatives. If we, the funds we manage, or the portfolio companies in which they invest, are perceived to promote or implement DEI-related policies or practices that are viewed as inconsistent with such legal, regulatory or policy developments, we could be subject to increased scrutiny, investigations, litigation, fines, suspension or debarment from government contracting, or reputational harm. Moreover, certain investors, counterparties or governmental entities may elect not to invest in, allocate capital to, conduct business with, or otherwise engage with us, the funds we manage or certain investment vehicles, or the portfolio companies in which they invest, may withdraw existing investments, or may seek to exclude us based on perceptions of our DEI-related practices, which could adversely affect the price of our common stock, the performance of the funds we manage, the ability to raise future capital, business results or financial condition, or cause reputational harm.
In addition, “anti-ESG” sentiment has also gained momentum across the U.S., with several states and federal authorities having enacted or proposed “anti-ESG” policies, legislation or issued executive orders and legal opinions, and engaged in related investigations and litigation. For example, anti-boycott legislation in certain states target financial institutions that are perceived as “boycotting” or “discriminating against” companies in certain industries (e.g., energy and mining) and prohibit government entities from doing business with such institutions and/or investing the government’s assets (including pension plan assets) through such institutions. Similar policies have been implemented or are being proposed at the federal level. In addition, certain jurisdictions now require that relevant government entities or managers/administrators of government investments make investments based solely on pecuniary factors without consideration of non-pecuniary environmental, social and governance factors. If investors subject to such legislation viewed our funds, policies or practices as being in contradiction of such “anti-ESG” policies, legislation, initiatives or legal opinions, such investors may not invest in our funds, our ability to maintain the size of our funds could be impaired, our results of operations or cash flow could be negatively affected and it could negatively affect the price of our common stock. A regulatory framework that opposes funds or vehicles that apply sustainability-related principles to their investment criteria also makes it harder for those funds or vehicles to operate across jurisdictions.
45
Historical performance metrics are unreliable indicators of our current or future results of operations.
We have presented returns relating to the historical performance of the funds we manage and certain targets of our future performance, including by reference to the internal rate of return (“IRR”) of certain funds’ performance using a gross IRR and a net IRR calculation. The returns are relevant to us primarily insofar as they are indicative of performance fees we have earned in the past and may earn in the future, our reputation and our ability to raise new funds. The returns of the funds we manage are not, however, directly linked to returns on our shares of common stock. Moreover, the historical returns of the funds we manage should not be considered indicative of the future returns of such funds or any future funds we may raise. Performance metrics, such as IRR, going forward for any current or future fund may vary considerably from the historical performance generated by any particular fund, or for the funds we manage as a whole.
Valuations for the funds we manage entail significant complications and are not an indicator for actual realizations.
We value the illiquid investments held by the funds we manage based on our estimate of their fair value as of the date of determination based on third-party models, or models developed by us. In addition, because many of the illiquid investments held by the funds we manage are in industries or sectors that are unstable, in distress, or undergoing some uncertainty, such investments are subject to rapid changes in value caused by sudden company-specific or industry-wide developments. We also include the fair value of illiquid assets in the calculations of net asset values, returns of the funds we manage and our AUM. Furthermore, we recognize performance fees based in part on these estimated fair values. Because these valuations are inherently uncertain, they may fluctuate greatly from period to period. Also, they may vary greatly from the prices that would be obtained if the assets were to be liquidated on the date of the valuation and often do vary greatly from the prices the funds we manage eventually realize.
If a fund realizes value on an investment that is significantly lower than the value at which it was reflected in a fund’s net asset values, the fund would suffer losses. This could in turn lead to a decline in our management fees and a loss equal to the portion of the performance fees reported in prior periods that was not actually realized upon disposition, and could slow the pace and reduce the likelihood that we earn carried interest. These effects could become applicable to a large number of investments by the funds we manage if the funds’ current valuations differ from future valuations due to market developments or other factors that are beyond our control. If asset values turn out to be materially different than values reflected in fund net asset values, fund investors could lose confidence which could, in turn, result in redemptions from the funds we manage that permit redemptions or difficulties in raising additional capital.
Investments made by the funds we manage entail significant risks and uncertainties.
We invest in a number of industries, products, geographical locations and strategies that entail significant risks and uncertainties, which may, if realized, have a material adverse effect on our business and results of operations. For example:
•The funds we manage often invest in companies with weak financial conditions, poor operating results, substantial financial needs, negative net worth and/or special competitive or regulatory problems, including in business enterprises that are or may become involved in work-outs, liquidations, spin-offs, reorganizations, bankruptcies and similar transactions.
•Investments by many of the funds we manage include debt instruments, including private credit, equity securities, and other financial instruments of companies that the funds we manage do not control. Those investments will be subject to the risk that the company in which the investment is made may make business, financial or management decisions with which we do not agree or that the majority stakeholders or the management of the company may take risks or otherwise act in a manner that does not serve the interests of the funds we manage.
•We generally establish the capital structure of portfolio companies and certain other fund investments, including real estate investments, on the basis of financial projections for such investments that are based primarily on management judgments.
•The funds we manage acquire and dispose of investments that are subject to contingent liabilities, which could be unknown to us at the time of the transaction or, if they are known to us, we may not accurately assess or protect against the risks that they present, and could in each case result in unforeseen losses for the funds we manage.
•A significant portion or all of a fund’s capital may be invested in a single investment or portfolio company and a loss with respect to such an investment or portfolio company could have a significant adverse impact on such fund’s capital.
46
•Certain of the funds we manage invest in infrastructure assets and real assets, which may expose us and the funds we manage to increased risks and liabilities that are inherent in the ownership, development and monetization of real assets.
•Certain of the funds we manage invest in cryptocurrencies, which may expose us and such funds to increased risks and liabilities that are inherent in the ownership, development and monetization of cryptocurrencies.
•Political changes could affect the anticipated profitability or viability of investments by certain of the funds we manage.
•The funds we manage invest in assets denominated in currencies that differ from the currency in which the relevant fund is denominated.
•We have undertaken business initiatives to increase the number and type of investment products we could offer to investors.
In each of these cases, the investments are exposed to significant risks and uncertainties, including regulatory and legal risks and oversight, adverse publicity and investor perceptions, reputational harm, counterparty default risk, inaccuracy of financial projections, inability to obtain full information as to the exact financial and operating conditions of the investment, increased likelihood that the assumptions on which we have based the investment are delayed, change or are never materialized, the effect of disruptions or volatility in the financial markets, inflation, commodity price risk, and additional exposures associated with attempts to hedge and otherwise protect from the downside of the investments. In each instance, if such risks were to materialize, the objective of our investments may not be fully realized, which could have a material adverse effect on our business and results of operations.
The performance of the funds we manage, and our performance, may be adversely affected by the financial performance of portfolio companies of the funds we manage and the industries in which the funds we manage invest.
Our performance and the performance of many of the funds we manage are significantly affected by the value of the companies in which the funds we manage have invested. The funds we manage invest in companies in many different industries, each of which is subject to volatility based upon a variety of factors, including economic, political and market factors. For example:
•The performance of certain of the portfolio companies of the funds we manage in the leisure and hospitality industry has been negatively impacted by macroeconomic conditions, such as inflation, and geopolitical events, such as the conflict between Russia and Ukraine and the conflicts in the Middle East.
•The performance of the investments of the funds we manage in the commodities markets is substantially dependent upon prevailing prices of oil and natural gas.
•The investments of the funds we manage in companies in the financial services and finance sectors, including consumer, are subject to government regulations, disclosure requirements, limits on fees, increasing borrowing costs or limits on the terms or availability of credit to such portfolio companies, and other regulatory requirements each of which may impact the conduct of such portfolio companies.
•The real estate and infrastructure investments of the funds we manage are exposed to rising mortgage interest rates, increasing consumer debt and a low level of consumer confidence in the economy and/or the residential real estate market.
•Investments of the funds we manage in commercial mortgage loans and other commercial real-estate related loans are subject to risks of delinquency and foreclosure, risks of loss that are greater than similar risks associated with mortgage loans made on the security of residential properties, and success of tenant businesses, property management decisions, competition from comparable types of properties and declines in regional or local real estate values and rental or occupancy rates.
•Investments of the funds we manage in the power and energy industries involve various risks, including regulatory and market risks. The increased scrutiny of regulators and investors on the negative impacts of the power and energy industries may negatively impact the value of investments in these sectors and our ability to exit certain investments on favorable terms. Future regulatory or legislative efforts by government agencies could place additional limitations on carbon-intensive forms of power generation or the exploration, mining, extraction, distribution and/or refining of certain fossil fuels.
•Rapid and unforeseen technological transformations, such as the emergence of large language models and generative AI, and/or the anticipated impact of such transformations, may introduce operating risks to certain portfolio companies and other investments, particularly those in the software industry and other related sectors, may cause volatility in their valuations and their stock price and may negatively affect their performance.
47
In addition, portfolio companies of the funds we manage across a wide range of industries experienced in the past significant challenges in their global supply chain, including shortages in supply, or disruptions or delays in shipments, of certain materials or components used in their products, and related price increases. While many of these portfolio companies were able to manage the challenges associated with these delays and shortages without significant disruption to their business, no assurance can be given that these efforts will be successful in the case of future supply chain constraints. Deterioration in the domestic or international economic environment may cause decreased demand for the products and services of the portfolio companies of the funds we manage and increased competition, which could result in lower sales volume and lower prices for their products, longer sales cycles, and slower adoption of new technologies.
The performance of the funds we manage, and our performance, may be adversely affected to the extent the portfolio companies of the funds we manage experience adverse performance or additional pressure due to downward trends in their respective industries.
The funds that we manage in our credit strategy are subject to numerous additional risks.
The funds we manage in our credit strategy are subject to numerous additional risks, including the risks set forth below.
•The funds we manage may concentrate investments in any one borrower or other issuer, product category, industry, region or country.
•The funds we manage sometimes hold positions (including outright positions in issuers and exposure to such issuers derived through any synthetic and/or derivative instrument) in multiple tranches of securities of an issuer (or other interests of an issuer) or multiple funds sometimes have interests in the same tranche of an issuer.
•Certain of these funds may engage in short-selling, which is subject to a theoretically unlimited risk of loss.
•These funds are exposed to the risk that a counterparty will not settle a transaction in accordance with its terms and conditions because of a dispute over the terms of the contract (whether or not bona fide) or because of a credit or liquidity problem, thus causing the fund to suffer a loss.
•The efficacy of the investment and trading strategies of certain funds may depend largely on the ability to establish and maintain an overall market position in a combination of different financial instruments, which can be difficult to execute.
•Certain of these funds originate, acquire or participate in (including through assignments and sub-participation) loans, including, but not limited to, secured and unsecured notes, senior and second lien loans, mezzanine loans, non-performing loans or other high-risk receivables and other similar investments in below investment grade or unrated debt, or preferred equity securities with debt-like or convertible features, which are or may become illiquid.
•These funds’ investments are subject to risks relating to investments in commodities, swaps, futures, options and other derivatives, the prices of which are highly volatile and may be subject to a theoretically unlimited risk of loss in certain circumstances.
•Certain of the funds we manage invest in private credit opportunities (including through direct origination), which may be illiquid, difficult to value and exit prior to maturity, and susceptible to credit deterioration, restructurings or losses.
Risks Related to Our Retirement Services Business
A financial strength rating downgrade, potential downgrade or any other negative action by a rating agency could make our product offerings less attractive, inhibit our ability to acquire future business through acquisitions or reinsurance and increase our cost of capital, which could have a material adverse effect on our business.
Various Nationally Recognized Statistical Rating Organizations (“NRSROs”) review the financial performance and condition of insurers and reinsurers, including our subsidiaries, and publish their financial strength ratings as indicators of an insurer’s ability to meet policyholder obligations. These ratings are important to maintain public confidence in our insurance subsidiaries’ products, our insurance subsidiaries’ ability to market their products and our competitive position. Factors that could negatively influence this analysis include:
•changes to the business practices or organizational business plan of our retirement services business in a manner that no longer supports its ratings;
•unfavorable financial or market trends;
•changes in NRSROs’ capital adequacy assessment methodologies in a manner that would adversely affect the financial strength ratings of our insurance subsidiaries;
•a need to increase reserves to support the outstanding insurance obligations of our retirement services business;
48
•our inability to retain our senior management and other key personnel;
•rapid or excessive growth, especially through large reinsurance transactions or acquisitions, beyond the bounds of capital sufficiency or management capabilities as judged by the NRSROs; and
•significant losses to the investment portfolio of our retirement services business.
Some other factors may also relate to circumstances outside of our control, such as views of the NRSRO and general economic conditions. Any downgrade or other negative action by a NRSRO with respect to the financial strength ratings of our insurance subsidiaries, or an entity we acquire, or credit ratings of our retirement services business, could materially adversely affect us and our retirement services business’ ability to compete in many ways, including the following:
•reducing new sales of insurance products;
•harming relationships with or perceptions of distributors, IMOs, sales agents, banks and broker-dealers;
•increasing the number or amount of policy lapses or surrenders and withdrawals of funds, which may result in a mismatch of our overall asset and liability position;
•requiring our retirement services business to offer higher crediting rates or greater policyholder guarantees on its insurance products in order to remain competitive;
•increase borrowing costs of our retirement services business;
•reducing the level of profitability and capital position of our retirement services business generally or hindering its ability to raise new capital; or
•requiring our retirement services business to collateralize obligations under or result in early or unplanned termination of hedging agreements and harming the ability of our retirement services business to enter into new hedging agreements.
In order to improve or maintain their financial strength ratings, management may attempt to implement strategies which improve capital ratios or other measures and perceptions of our subsidiaries. We cannot guarantee any such measures will be successful. We cannot predict what actions NRSROs may take in the future, and failure to maintain current financial strength ratings could materially and adversely affect our business, financial condition, results of operations and cash flows.
If we are unable to attract and retain IMOs, banks and broker-dealers, sales of our retirement services products may be adversely affected.
In our retirement services business, we distribute annuity products through a variable cost distribution network, which includes numerous IMOs, banks and broker-dealers, collectively representing numerous independent agents. We must attract and retain such marketers, agents and financial institutions to sell our products. In particular, insurance companies compete vigorously for productive agents. We compete with other life insurance companies for marketers, agents and financial institutions primarily on the basis of our financial position, support services, compensation, credit ratings and product features. Such marketers, agents and financial institutions may promote products offered by other life insurance companies that may offer a larger variety of products than we do. Our competitiveness for such marketers, agents and financial institutions also depends upon the long-term relationships we develop with them. There can be no assurance that such relationships will continue in the future. In addition, our growth plans include increasing the distribution of annuity products through banks and broker-dealers. If we are unable to attract and retain sufficient marketers and agents to sell our products or if we are not successful in expanding our distribution channels within the bank and broker-dealer markets, our ability to compete and our sales volumes and results of operations could be adversely affected.
As a financial services company, we are exposed to liquidity risk, which is the risk that we are unable to meet near-term obligations as they come due.
Liquidity risk is a manifestation of events that are driven by other risk types (e.g., market, policyholder behavior, operational). A liquidity shortfall may arise in the event of insufficient funding sources or an immediate and significant need for cash or collateral. In addition, it is possible that expected liquidity sources, such as the AHL credit facility and AHL liquidity facility, may be unavailable or inadequate to satisfy the liquidity demands described below. Geopolitical and macroeconomic conditions contribute to volatility in the financial markets and may restrict the liquidity sources available to us and further may result in an increase of our liquidity demands. We primarily have liquidity exposure through our collateral market exposure, asset liability mismatch, dependence on the financial markets for funding and funding commitments. If a material liquidity demand is triggered and we are unable to satisfy the demand with the sources of liquidity readily available to us, it may have a material adverse impact on our business, financial condition, results of operations, liquidity and cash flows.
49
The amount of statutory capital that our insurance and reinsurance subsidiaries have, or that they are required to hold, can vary significantly from time to time and is sensitive to a number of factors outside of our control.
The U.S. insurance subsidiaries of our retirement services business are subject to state regulations that provide for minimum capital requirements (“MCR”) based on RBC formulas for life insurance companies relating to insurance, business, asset, interest rate and certain other risks. Similarly, the Bermuda reinsurance subsidiaries of our retirement services business are subject to MCR imposed by the BMA through the BMA’s Enhanced Capital Requirement (“ECR”) and minimum margin of solvency.
In any particular year, our subsidiaries’ capital ratios and/or statutory surplus amounts may increase or decrease depending on a variety of factors, some of which are outside of our control and some of which we can only partially control, including, but not limited to, the following: the amount of statutory income or loss generated by our insurance subsidiaries; the amount of additional capital our insurance subsidiaries must hold to support their business growth; changes in reserve requirements applicable to our insurance subsidiaries; changes in market value of certain securities in our investment portfolio; recognition of write-downs or other losses on investments held in the investment portfolio of our retirement services business; changes in the credit ratings of investments held in the investment portfolio of our retirement services business; changes in the value of certain derivative instruments; changes in interest rates; credit market volatility; changes in policyholder behavior; changes in corporate tax rates; changes to the RBC formulas and interpretations of the NAIC instructions with respect to RBC calculation methodologies; and changes to the ECR, Bermuda Solvency Capital Requirement (“BSCR”), or target capital level (“TCL”) formulas and interpretations of the BMA’s instructions with respect to ECR, BSCR, or TCL calculation methodologies.
Further to NAIC activities with respect to RBC calculation methodologies, the NAIC has recently adopted and is currently considering a variety of reforms to its RBC framework, which could increase the capital requirements for our U.S. insurance subsidiaries. For example, the NAIC recently adopted changes to certain statements of statutory accounting principles in connection with its principles-based bond project, which became effective on January 1, 2025, setting forth the factors to determine whether an investment in asset-backed securities qualifies for reporting on an insurer’s statutory financial statement as a bond on Schedule D-1 as opposed to Schedule BA (other long-term invested assets), the latter of which could result, among other things, in the capital charge treatment of an investment being less favorable. The NAIC also adopted an interim change to the life RBC formula for year-end 2023 and 2024 reporting to increase the RBC base factor for residual tranches of structured securities, and increased the base factor in 2024. In addition, the NAIC is reviewing changes related to filing exempt status for certain securities, including a proposal that sets forth procedures for the NAIC’s review of investments that are exempt from filing with the NAIC’s Securities Valuation Office, which could result in, among other things, the capital charge treatment of the investment being less favorable.
In March 2024, the BMA published revised rules and new guidance notes to enhance Bermuda’s regulatory regime for commercial insurers. The material enhancement to the framework included updates to the technical provisions, the computation of the BSCR and the BSCR adjustment framework.
NRSROs may also implement changes to their internal models, which differ from the RBC and BSCR capital models, that have the effect of increasing or decreasing the amount of statutory capital our subsidiaries must hold in order to maintain their current ratings. To the extent that one of our insurance subsidiary’s solvency or capital ratios is deemed to be insufficient by one or more NRSROs to maintain their current ratings, we may take actions either to increase the capitalization of the insurer or to reduce the capitalization requirements. If we are unable to accomplish such actions, NRSROs may view this as a reason for a ratings downgrade. Regulatory developments, including the NAIC’s adoption of amendments to its Insurance Holding Company System Regulatory Act and Model Regulation requiring, subject to certain exceptions, that our retirement services business file a confidential annual group capital calculation and an annual liquidity stress test with the Iowa Insurance Division, the lead state insurance regulator of its U.S. insurance subsidiaries, may increase the amount of capital that our retirement services business is required to hold and could result in it being subject to increased regulatory requirements.
If a subsidiary’s solvency or capital ratios reach certain minimum levels, it could subject us to further examination or corrective action imposed by our insurance regulators. Corrective actions may include limiting our subsidiaries’ ability to write additional business, increased regulatory supervision, or seizure or liquidation of the subsidiary’s business, each of which could materially and adversely affect our business, financial condition, results of operations, cash flows and prospects.
50
Repurchase agreement programs subject us to potential liquidity and other risks.
Our retirement services business may engage in repurchase agreement transactions whereby it sells fixed income securities to third parties, primarily major brokerage firms or commercial banks, with a concurrent agreement to repurchase such securities at a determined future date. These repurchase agreements provide our retirement services business with liquidity and in certain instances also allow it to earn spread income. Under such agreements, our retirement services business may be required to deliver additional securities or cash as margin to the counterparty if the value of the securities sold decreases prior to the repurchase date. If our retirement services business is required to return significant amounts of cash collateral or post cash or securities as margin on short notice or have inadequate cash on hand as of the repurchase date, it may be forced to sell securities to meet such obligations and may have difficulty doing so in a timely manner or may be forced to sell securities in a volatile or illiquid market for less than it otherwise would have been able to realize under normal market conditions. Rehypothecation of subject securities by the counterparty may also create risk with respect to the counterparty’s ability to perform its obligations to tender such securities on the repurchase date. Such facilities may not be available to our retirement services business on favorable terms or at all in the future.
Our retirement services business is subject to the credit risk of its counterparties, including ceding companies, reinsurers, plan sponsors, and derivative counterparties.
Athene and its insurance subsidiaries encounter various types of counterparty credit risk. Athene’s insurance subsidiaries cede certain risk to third-party insurance companies that may cover large volumes of business and expose them to a concentration of credit risk with respect to such counterparties. Such subsidiaries may not have a security interest in the underlying assets and despite certain indemnification rights, they retain liability to their policyholders if a counterparty fails to perform. Certain of Athene’s insurance subsidiaries also reinsure liabilities from other insurance companies and these subsidiaries may be negatively impacted by changes in the ceding companies’ ratings, creditworthiness, and market perception, or any policy administration issues. Athene further assumes pension obligations from plan sponsors that expose it to the credit risk of the plan sponsor. In addition, our retirement services business may be exposed to credit loss in the event of nonperformance by its derivative agreement counterparties. If any of these counterparties are not able to satisfy its obligations to us or third parties, including policyholders, we may not achieve our targeted returns and our financial position, results of operations, liquidity and cash flow may be materially adversely affected.
The investment portfolio of our retirement services business may be subject to concentration risk, particularly with respect to single issuers, including Athora, among others; industries, including financial services; and asset classes, including real estate.
Our retirement services business faces single issuer concentration risk both in the context of alternative investments, in which it occasionally holds significant equity positions, and large asset trades, in which it generally holds significant debt positions. The most significant concentration risk exposures of our retirement services business arising in the context of alternative investments, on a risk-adjusted basis, is its investment in Athora, an insurance holding company focused on the European life insurance market. Given our retirement services business’ significant exposure to these issuers, it is subject to the risks inherent in their business. For example, as a life insurer, Athora is subject to credit risk with respect to its investment portfolio and mortality risk with respect to its product liabilities, each of which may be exacerbated by unforeseen events. Further, Athora has significant European operations, which expose it to volatile economic conditions and risks relating to European member countries and withdrawals thereof. In addition, Athora is subject to multiple legal and regulatory regimes that may hinder or prevent it from achieving its business objectives. To the extent that our retirement services business suffers a significant loss on its investment in these issuers, including Athora, our financial condition, results of operations and cash flows could be adversely affected.
In addition, from time to time, in order to facilitate certain large asset trades and in exchange for commitment fees, our retirement services business may commit to purchasing a larger portion of an investment than it ultimately expects to retain, and in such instances our retirement services business is reliant upon the ability of our asset management business to syndicate the transaction to other investors. If our asset management business is unsuccessful in its syndication efforts, our retirement services business may be exposed to greater concentration risk than what it would deem desirable from a risk appetite perspective and the commitment fee that it receives may not adequately compensate it for this risk.
Our retirement services business also has significant investments in nonbank lenders focused on providing financing to individuals or entities. As a result, through these investments, we have significant exposure to credit risk. In addition to the concentration risk arising from our retirement services business’ investments in single issuers within the nonbank lending sector
51
of the financial services industry, we have significant exposure to the financial services industry more broadly as a result of the composition of investments in our retirement services business’ investment portfolio. Economic volatility or any further macroeconomic, regulatory or other changes having an adverse impact on the financial services industry more broadly, could have a material and adverse effect on our business, financial condition, results of operations and cash flows.
A significant portion of the net invested assets of our retirement services business is invested in real estate-related assets. Any significant decline in the value of real estate generally or the occurrence of any of the risks described elsewhere in this report with respect to the real estate-related investments of our retirement services business could materially and adversely affect our financial condition and results of operations. Specifically, through the investments of our retirement services business in CML and CMBS, we have exposure to certain categories of commercial property, including office buildings and retail, that have been adversely affected by the continuing work from home trend. In addition, the CML our retirement services business holds, and the CML underlying the CMBS that our retirement services business holds, face both default and delinquency risk.
Conflicts of Interest
Our failure to deal appropriately with conflicts of interest could damage our reputation and adversely affect our businesses.
We increasingly confront potential and actual conflicts of interest relating to our business, our investment activities and the investment activities of the funds we manage. As an asset manager, conflicts of interest arise, and may continue to arise in the future, in connection with investment decisions, including regarding the identification, making, management, valuation, disposition, and timing of a fund’s investments. These conflicts of interest include conflicts that arise among the funds we manage as well as between us and the funds we manage and other client accounts, including investment allocation decisions. Certain inherent conflicts of interest arise from the nature of our business, including from the fact that (i) we provide investment management services to more than one fund or client, (ii) the funds we manage often have one or more overlapping investment strategies, and (iii) we could choose to allocate an investment to more than one fund or to ourselves. Also, the investment strategies employed by us for current and future clients, or on our own behalf, could conflict with each other, and may adversely affect the prices and availability of other securities or instruments held by, or potentially considered for, one or more clients. If participation in specific investment opportunities is appropriate for more than one of the funds or other advisory clients we manage, participation in such opportunities will be allocated pursuant to our allocation policies and procedures, which take into account the terms of the relevant partnership or investment management agreement as well as the decisions of our allocations committees.
In addition, there are a variety of circumstances inherent in our business that give rise to the potential for conflicts of interest, which have, in certain instances, resulted in actual conflicts between us and the funds and accounts we manage and may do so again in the future, including: (i) the allocation of investment opportunities between Apollo and the funds and accounts Apollo manages; (ii) the allocation of investment opportunities among funds and accounts with different performance fee structures, or where our personnel have invested more heavily in one fund than another; (iii) the determination of what constitutes fund-related expenses and the allocation of such expenses between us and our managed funds and accounts; (iv) the ability of our personnel to, in certain circumstances, make investments in the funds we manage or funds managed by third parties on more favorable terms; (v) the selection of investments that could generate more fees for service providers affiliated with us; and (vi) the execution of securities trades by Apollo’s affiliated broker-dealer on behalf of the funds and accounts we manage.
Further, from time to time, issues arise that present actual conflicts of interest, including between us and the funds we manage, among the funds we manage, or between our employees and the funds we manage. Examples of such conflicts include, without limitation, side-by-side managed funds with overlapping investment mandates; affiliated transactions (including principal transactions, cross trades, and agency cross trades) between (a) the funds we manage and/or between the funds we manage and Apollo and/or their portfolio investments, and/or (b) our managed accounts and funds and an affiliated broker-dealer; multi-tranche investments where the funds we manage are invested in one or more tranches of a portfolio investment while others are invested on a non-pari passu basis in the same or different tranches of such investment; and the use of affiliated service providers, including the execution of securities trades by Apollo’s affiliated broker-dealer on behalf of the funds and accounts we manage and/or the engagement of an affiliated fund servicer. Funds we manage hold interests in businesses, including operating companies and/or portfolio investments, that originate assets on a recurring basis, which we refer to as origination platforms. Through their origination business, the origination platforms create investment opportunities for us, our affiliates, as well as for the funds we manage in addition to third parties. Where such investment opportunities are allocated to the funds we manage, they can give rise to management fees, incentive compensation payable or allocable to us, and additional transaction-based compensation payable to our affiliated service providers, including the capital solutions fees discussed herein, which gives rise to conflicts of interest among us and the funds we manage.
52
The governing documents of the funds we manage typically do not mandate specific allocations with respect to co-investments. The investment advisers of the funds and accounts we manage have an incentive to provide potential co-investment opportunities to certain investors in lieu of others and/or in lieu of an allocation to the funds we manage (including, for example, as part of an investor’s overall strategic relationship with us) if such allocations are expected to generate relatively greater fees or performance allocations to us than would arise if such co-investment opportunities were allocated otherwise.
The funds we manage invest in portfolio companies whose operations may be substantially similar to and/or competitive with the portfolio companies in which our other funds have invested. The performance and operation of such competing businesses could conflict with and adversely affect the performance and operation of the portfolio companies of the funds we manage, and may adversely affect the prices and availability of business opportunities or transactions available to such portfolio companies. In addition, we may take different actions across funds with similar investment programs, objectives or strategies. For example, one of the private equity funds we manage could have an interest in pursuing an acquisition, divestiture or other transaction, even though the proposed transaction would subject one or more of the investments of the credit funds we manage to additional or increased risks. We may also advise clients with investment objectives or strategies that conflict with those of certain of the funds we manage. We, the funds we manage or the portfolio companies of the funds we manage may also have ongoing relationships with issuers whose securities have been acquired by, or are being considered for investment by us. In addition, a dispute may arise between the portfolio companies of the funds we manage, and the investors in the funds we manage may be dissatisfied with our handling of such dispute.
Apollo has established certain one-way and/or two-way information barriers in respect of discrete investment strategies (based on established policies and procedures in respect of information barriers), including secondary trading activities. Nonetheless, because we generally operate without the permanent information barriers in our asset management business that some other investment management firms implement to separate business units and/or to separate persons who make investment decisions from others who might possess material non-public information that could influence such decisions, our executive officers, investment professionals or other employees may acquire confidential or material non-public information and, as a result, they, we, the funds we manage and other clients may be restricted from initiating transactions in certain securities. In the event that any of our employees obtains such material non-public information, we may be restricted in acquiring or disposing of investments on behalf of the funds we manage, which could impact the returns generated for such funds. Notwithstanding the maintenance of restricted securities lists and other internal controls, it is possible that the internal controls relating to the management of material non-public information could fail and result in us, or one of our investment professionals, buying or selling a security while, at least constructively, in possession of material non-public information. Inadvertent trading on material non-public information could have adverse effects on our reputation, result in the imposition of regulatory, financial or judicial sanctions and, as a consequence, negatively impact our ability to provide our investment management services to our clients and the funds we manage.
The functions of certain of our affiliates also give rise to a number of conflicts of interest. For example, certain of our affiliates are broker-dealers registered with the SEC and members of FINRA, the U.K. Financial Conduct Authority and the European Securities and Market Authority that principally conduct private placements and provide services in respect of the underwriting and syndication of securities, transaction advisory services, capital markets advisory and structuring services, placement services, sourcing services, origination services and merger and acquisition advisory services, including in connection with exiting investments, as well as certain authorized market making services. Additionally, certain of our affiliates and/or portfolio companies of the funds we manage provide a variety of services with respect to financial instruments, including loans, that are not subject to broker-dealer regulations, such as originating, administering, arranging, sourcing, structuring, placing and syndicating loans, advisory and other similar services to the funds we manage and their portfolio companies, as well as third parties. While we believe these kinds of transactions are beneficial to our clients and the funds we manage, the functions that our affiliates may perform give rise to a number of conflicts of interest, including, for example, with respect to the allocation of investment opportunities and the imposition of additional fees that are borne, directly or indirectly, by the funds we manage. Additionally, in secondary market trades involving securities, certain conflicts of interest and risks may be posed by our affiliated broker-dealer’s ability to execute trades on a principal, riskless principal, or agency basis and could elect to hold inventory of securities as part of its secondary market activities in anticipation of demand for such securities. Such activity may pose conflicts of interest relating to the allocation of investments and the allocation of fees and expenses to the funds and accounts we manage, as well as increased risks relating to the valuation of assets and asset liquidity.
In connection with the services rendered by our affiliates to the funds we manage and their portfolio companies, such affiliates and/or the portfolio companies receive fees from the funds we manage, portfolio companies of the funds we manage and third-party borrowers. Furthermore, a borrower or an issuer may view all fees, expense reimbursements and interest related to
53
financing (or similar instrument) as one charge it is incurring as part of our financing package to them and therefore doesn’t distinguish between (x) the fees paid to our affiliates and (y) returns earned by the funds we manage whether in the form of interest, investment returns or other fees. As a result of a borrower or issuer taking this view, there could be less negotiation over fees paid to our affiliates, potentially resulting in reduced returns for the funds we manage and an incentive to pursue investment opportunities with greater fee opportunities for our affiliates even at the expense of the investment returns sought by our clients and the funds we manage. Consequently, our relationship with these entities may give rise to conflicts of interest between (i) us and portfolio companies of the funds we manage and/or (ii) us and the funds we manage. Additionally, certain personnel affiliated with our broker-dealers are associated with other affiliated organizations. We employ commercially reasonable efforts to use separate teams for investment opportunities (one for our affiliated investment manager and the other for our affiliated service provider) and identify the distinct services provided by each team. However, we may not be able to maintain a distinct set of services provided by the two teams for some investment opportunities, and such dual affiliation gives rise to conflicts of interest, including for example with respect to allocation of time, resources, and investment opportunities.
Certain of our executive officers and other senior employees have established family offices to provide investment advisory, accounting, administrative and other services to their respective family accounts (including certain charitable accounts) in connection with their personal investment activities unrelated to their investments in Apollo entities. The investment activities of the family offices, and any involvement of the executive officer or senior employee in these activities may give rise to potential conflicts between the personal financial interests of the executive officer or senior employee and the interests of us, any of our subsidiaries, the funds we manage, our clients or any stockholder other than such executive officer or senior employee.
From time to time, we finance, securitize or employ structured finance arrangements in respect of certain of our balance sheet assets. We could also employ structured financing arrangements with respect to co-investment interests and investments in other funds made by our entities (including, potentially, co-investments with the funds we manage). These structured financing arrangements could alter our returns and risk exposure with respect to the applicable balance sheet assets as compared to our returns and risk exposure if we held such assets outside of such structured financing arrangements, and could create incentives for us to take actions in respect of such assets that we otherwise would not in the absence of such arrangements or otherwise alter our alignment with investors in such investments. These arrangements could also result in us realizing liquidity with respect to our equity investment in a fund or other entity at a different point in time (including earlier) than the limited partners of such fund or entity.
In addition to such finance arrangements, we also opportunistically invest or otherwise deploy the assets on our balance sheet. Such investments may create a platform of businesses directly owned by us, outside of the funds we manage and their portfolio companies or directly owned by the funds we manage. Consequently, such investments have resulted in the past and may result in the future in conflicts of interest between operating such platform businesses and the funds we manage and their portfolio companies. In addition, certain entities in which Apollo has made a balance sheet investment provide services to Apollo, the funds we manage or their portfolio companies, which gives rise to conflicts of interest.
In addition, the funds we manage may, subject to applicable requirements in their governing documents, which may include obtaining advisory board consent, determine to sell a particular portfolio investment into a separate vehicle, which may be managed by us, with different terms (i.e., longer duration) than the fund that originally acquired the portfolio investment, and provide fund investors with the option to monetize their investment with the fund at the time of such sale, or to roll all or a portion of their interest in the portfolio investment into a new vehicle. Under such circumstances, we may invest in or alongside the new vehicle, or hold the entirety of the portfolio investment sold by the fund through or alongside the new vehicle (i.e., in the event that all limited partners elect to monetize their investment at the time of sale to the new vehicle). As a consequence, conflicts of interest may arise across the funds we manage, limited partners, and us.
Most of the funds we manage obtain subscription line facilities and other financing arrangements to facilitate investments and operations, including the payment of fees and expenses. If a fund obtains a subscription line facility, the fund’s working capital needs will in most instances be satisfied through borrowings by the fund under the subscription line facility, and, less so, by drawdowns of capital contributions by the fund. As a result, capital calls are expected to be conducted in larger amounts on a less frequent basis in order to, among other things, repay borrowings and related interest expenses due under such subscription line facilities.
Where an investment fund uses borrowings under a subscription line facility, a net asset value-based finance fund facility or other financing arrangement in advance or in lieu of receiving capital contributions from investors to repay any such borrowings and related interest expenses, the use of such facility or arrangement will result in a different (and perhaps higher)
54
reported internal rate of return than if the facility had not been utilized and instead capital contributions from investors had been contributed at the inception of an investment. Because the preferred return of investment funds typically does not accrue on such borrowings, but rather only accrues on capital contributions when made, the use of such subscription line facilities, net asset value-based finance fund facilities and other similar financing may reduce or eliminate the preferred return received by the investors and accelerate or increase distributions of performance-based allocation to the relevant general partner. This will provide the general partner with an economic incentive to fund investments through such facilities in lieu of capital contributions. However, since interest expense and other costs of borrowings under subscription lines of credit, net asset value-based finance fund facilities and other similar financing arrangements are an expense of the investment fund, the investment fund’s incurred expenses will be increased, which may reduce the amount of performance fees generated by the fund.
Appropriately dealing with conflicts of interest is complex and difficult and our reputation could be damaged if we fail, or appear to fail, to deal appropriately with one or more potential or actual conflicts of interest. Regulatory scrutiny of, or litigation in connection with, conflicts of interest could have a material adverse effect on our reputation which would materially adversely affect our business and results of operations.
Risks Related to Regulation and Litigation
Extensive regulation of our businesses affects our activities and creates the potential for significant liabilities and penalties. Increased regulatory focus would result in additional burdens on our businesses.
We are subject to extensive regulation, including periodic examinations, inquiries and investigations and requirements to obtain and maintain licenses and/or other approvals, by government agencies and self-regulatory organizations in the jurisdictions in which we operate around the world. Many of the various laws and regulations to which we are subject are discussed in “Item 1. Business—Regulatory and Compliance Matters.” As detailed in that section, certain of our businesses, subsidiaries and/or affiliates are, among others, regulated under the Investment Advisers Act; the Investment Company Act; the Dodd-Frank Wall Street Reform and Consumer Protection Act; the Commodity Exchange Act; the EU Alternative Investment Fund Managers Directive; the EU Markets in Financial Instruments Directive; the U.K. Financial Services and Markets Act 2000; the EU General Data Protection Regulation (as implemented in countries in the European Economic Area) and the U.K. General Data Protection Regulation; the U.K. Data Protection Act 2018 (as amended by the U.K. Data (Use and Access) Act 2025) and potentially various new and emerging EU and U.K. cybersecurity and digital operational resilience laws, such as the EU Digital Operational Resilience Act; the Cayman Islands Data Protection Act; the Gramm-Leach-Bliley Act; the California Consumer Privacy Act of 2018 and a variety of other U.S. and international state privacy, cybersecurity and AI laws and regulations; as well as by the Financial Stability Oversight Council and similar non-U.S. regulators; the Federal Reserve; the SEC; FINRA; the CFTC; the NFA; the U.S. Department of Labor; the IRS; the Federal Communications Commission; insurance law and regulations by regulators in U.S. states, the EU, Bermuda, U.K., Italy, Switzerland, Germany, Belgium, the Netherlands, Australia, Singapore, Canada, Cayman Islands and Malaysia; as well as rules and regulations regarding CLO risk retention, real estate investment trusts, broker-dealers, “over the counter” derivatives markets, commodity pool operators, commodity trading advisors, gaming companies, and natural resources companies. We distribute many of our products through financial intermediaries, including third-party broker-dealers, and as such, increasing broker-dealer regulation (particularly concerning marketing and sales practices) could make it more difficult and expensive for us to distribute such products. We are also subject to laws and regulations governing payments and contributions to public officials or other parties, including restrictions imposed by the U.S. Foreign Corrupt Practices Act, as well as economic sanctions and export control laws administered by the U.S. Treasury Department’s Office of Foreign Assets Control, the U.S. Department of Commerce and the U.S. Department of State.
We are or may be subject to new initiatives and additional rules and regulations relating to sustainable finance and/or other sustainability-related matters, including but not limited to: in the EU, the EU Regulation on the Establishment of a Framework to Facilitate Sustainable Investment, the EU Sustainable Finance Disclosure Regulation and supporting regulatory technical standards, and the ESG Ratings Regulation; in the U.K., the U.K. FCA’s disclosure rules for asset managers aligned with the recommendations of the Taskforce on Climate-Related Financial Disclosures as well as the Sustainability Disclosure Requirements (including both a fund labelling regime and a general anti-greenwashing rule), and The Financial Services and Markets Act 2000 (Regulated Activities) (ESG Ratings) Order 2025; and, in the U.S., new and proposed legislation in certain states that would require the disclosure of greenhouse gas emissions data, carbon offset information, and/or climate-related financial risk disclosures, as well as legislation that would impose new or expanded divestment mandates on fiduciaries of state funds. Compliance with such laws and regulations requires increasing amounts of resources and the attention of our management team. Any violation, even if alleged, of such laws and regulations or any failure to obtain or maintain licenses and/or other regulatory approvals as required for our operations may have a material adverse effect on our businesses, financial condition, results of operations, liquidity, cash flows and prospects. Numerous jurisdictions in which we operate have also seen,
55
and may see additional, legislation or regulation opposing investment strategies or opportunities that are guided by sustainability-related considerations, making it harder for vehicles that apply such criteria to operate across jurisdictions. In addition, as we have seen in recent years, different laws and regulations on the same topic may not always have the same requirements, and even when requirements overlap, the rules are not always consistently implemented, interpreted, and enforced from jurisdiction to jurisdiction.
Many of these laws and regulations empower regulators, including U.S. and foreign government agencies and self-regulatory organizations, as well as state securities commissions and insurance departments in the U.S., to conduct investigations and administrative proceedings that can result in penalties, fines, suspensions or revocations of licenses and/or other regulatory approvals, third-party oversight of various business processes, divestiture of certain investments, suspensions of personnel or other sanctions, including censure, the issuance of cease-and-desist orders, enforcement actions and settlements, or the suspension or expulsion of an investment adviser from registration or memberships. Even if an investigation or proceeding does not result in a sanction or the sanction imposed against us or our personnel by a regulator is small in monetary amount, the adverse publicity relating to the investigation, proceeding or imposition of these sanctions could harm our reputation and cause us to lose existing investors or fail to gain new investors. These requirements imposed by our regulators are designed primarily to ensure the integrity of the financial markets and to protect investors in the funds and other vehicles we manage and policyholders of our retirement services and other businesses and may not necessarily be designed to protect our stockholders. Other regulations, such as those promulgated by the Committee on Foreign Investment in the U.S. and similar foreign direct investment regimes in other jurisdictions, may impair our ability to invest the funds and other vehicles we manage and/or for such funds or vehicles to realize full value from our investments in certain industries and countries.
Our businesses may be adversely affected as a result of new or revised legislation or regulations imposed by U.S. or foreign government agencies or self-regulatory organizations. We also may be adversely affected by changes in the interpretation or enforcement of existing laws and rules by these government agencies and self-regulatory organizations. For instance, regulators have been increasing regulation of private funds and advisers to private funds, and this type of regulation may make it more difficult for us to manage and distribute both our private fund products and our products that are purchased by third-party private fund managers. Changes regarding immigration and work permit policies and practices could affect local or global labor markets and supply chains.
In addition to the foregoing risks, the financial services and insurance industry is the focus of increased regulatory scrutiny as various U.S. state and federal government agencies and self-regulatory organizations conduct inquiries and investigations into the products and practices of the companies within this industry. Government authorities and insurance standard setters in the U.S. and worldwide (including the NAIC and the IAIS) have become increasingly interested in potential risks posed by the insurance industry as a whole, and to commercial and financial activities and systems in general, as indicated by the development of the global insurance capital standard by the IAIS to be applicable to IAIGs, as well as NAIC’s adoption of the group capital calculation and liquidity stress test, each of which the IID has adopted and is applicable to us. In February 2024, the IID identified AGM as meeting the criteria as an IAIG and further identified Athene as the head of the IAIG. As a result of these identifications, Athene will be subject to the relevant capital standard that the U.S. applies to IAIGs. At this time, we do not expect a significant impact on Athene’s capital position or capital structure; however, we cannot fully predict with certainty the impact (if any) on Athene’s capital position or capital structure and any other burdens being named an IAIG may impose on Athene or its insurance affiliates.
As we and the funds we manage become more actively involved in digital asset markets, the regulatory risks described herein will be heightened and we will be subject to supplemental and/or increased regulation that applies (or, in the future, will likely apply) specifically to digital assets and related activities. The scope, interpretation, and practical impact of such regulatory measures will depend on their implementation, interpretation, and interaction with existing regulatory regimes, continue to evolve, and may differ materially across jurisdictions, resulting in increased compliance costs and obligations for us and the funds we manage.
Guaranty associations may also subject member insurers, including Athene, to assessments that require the insurers to pay funds to cover contractual obligations under insurance policies issued by insurance companies that become impaired or insolvent. These associations levy assessments, up to prescribed limits, on each member insurer doing business in a particular state on the basis of their proportionate share of the premiums written by all member insurers in the lines of business in which the impaired or insolvent insurer previously engaged. Most states limit assessments in any year to 2% of the insurer’s average annual premium for the three years preceding the calendar year in which the impaired insurer became impaired or insolvent. Although Athene has not historically paid material amounts in connection with these assessments, we cannot accurately predict the magnitude of such amounts in the future, or accurately predict which past or future insolvencies of other insurers could lead
56
to such assessments. If material, any such future assessments may have an adverse effect on our financial condition, results of operations, liquidity or cash flows, and any liability we have previously established for these potential assessments may not be adequate.
We have been and may be the target or the subject of third-party litigation from time to time that could result in significant liabilities and/or reputational harm, which could have a material adverse effect on our results of operations, financial condition and liquidity.
The activities of our businesses, including the investment activities of the funds and other vehicles we manage and activities of our employees in connection with the funds or vehicles, their portfolio companies, our insurance subsidiaries, as well as publicly listed vehicles we manage or sponsor may subject us and certain of our employees to the risk of litigation, including class actions, by third parties, including investors dissatisfied with the performance or management of such funds or vehicles, holders of our or the funds’ or other vehicles’ portfolio companies’ debt or equity, policyholders of our retirement services business, public stockholders and a variety of other potential litigants. In general, we will be exposed to risk of litigation by our investors if our management of any fund or vehicle is alleged to constitute bad faith, gross negligence, willful misconduct, fraud, willful or reckless disregard for our duties to the fund, breach of fiduciary duties or securities laws, or other forms of misconduct. If such allegations are made against our Board or management, Section 220 of the Delaware General Corporation Law (the “DGCL”) allows stockholders to access corporate books and records to investigate wrongdoing. Investors could sue us to recover amounts lost by the funds or vehicles we manage due to our alleged misconduct, up to the entire amount of loss. Further, we may be subject to litigation arising from investor dissatisfaction with the performance of the funds or other vehicles we manage or from third-party allegations that we (i) improperly exercised control or influence over companies in which the funds or vehicles we manage have large investments or (ii) are liable for actions or inactions taken by portfolio companies that such third parties argue we control. We are also exposed to risks of litigation or investigation relating to transactions that presented conflicts of interest that were not properly addressed. Our rights to indemnification by the funds or vehicles we manage may not be upheld if challenged, and our indemnification rights generally do not cover bad faith, gross negligence, willful misconduct, fraud, willful or reckless disregard for our duties to the fund or vehicle or other forms of misconduct. With many highly paid employees and complex compensation and incentive arrangements, we face the risk of lawsuits relating to claims for compensation, which may individually or in the aggregate be significant in amount. We are also increasingly faced with the risk of litigation or investigation in relation to sustainability-related issues given the increasing scrutiny of such issues by investors, other stakeholders, regulators, and other third parties as well as due to the increasing disclosure obligations on our businesses, the funds and other vehicles we manage, and their portfolio companies. Such risks may relate to accusations concerning but not limited to: (i) the activities of portfolio companies, including environmental damage and violations of labor and human rights; (ii) non-compliance of portfolio companies with corporate sustainability-related regulations, such as the EU’s Corporate Sustainability Reporting Directive and/or Corporate Sustainability Due Diligence Directive, (iii) misrepresentations of the investment strategies of the funds and other vehicles we manage as well as about our, the funds’ or other vehicles’, and their investments’ performance against sustainability-related measures and/or initiatives; or (iv) breaches of fiduciary duty in relation to the funds and other vehicles we manage and other violations of law related to the management of sustainability-related risks.
If any civil or criminal litigation brought against us were to result in a finding of substantial legal liability or culpability, the litigation could, in addition to any financial damage, cause significant reputational harm to us, which could seriously harm our business. In addition, we may not be able to obtain or maintain sufficient insurance on commercially reasonable terms or with adequate coverage levels against potential liabilities we may face in connection with potential claims, which could have a material adverse effect on our business.
In addition, our business has been, and may continue to be, the subject of litigation between third parties that could negatively impact us. For example, beginning in March 2024, a number of putative class actions were filed in federal courts in the U.S. against certain customers of Athene, in their respective capacities as plan sponsors, alleging violations of the Employee Retirement Income Security Act of 1974 (“ERISA”) in connection with their transfer of pension obligations under defined benefit plans governed under ERISA and their purchase of pension group annuity contracts from Athene. The lawsuits seek, inter alia, that defendants guarantee the annuities purchased from Athene and disgorge any profits earned from the transactions. Although Athene is not a named defendant, the lawsuits make several negative allegations about Athene and its business, which we believe to be untrue. Recently, similar claims have been filed against customers of other insurance companies that have transferred their pension obligations to such other insurance companies. Negative public perceptions of Athene and its business have adversely affected, and may continue to adversely affect, its ability to attract and retain customers in its pension group annuity business, which could have a material adverse effect on our business, results of operations, financial condition and cash flows. To the extent these lawsuits continue to spread to customers of other insurance companies, future activity in the overall
57
pension risk transfer industry may be reduced. In addition, these lawsuits could lead to increased regulatory and governmental scrutiny of Athene’s business and the industry overall, and/or result in Athene becoming involved in these lawsuits or even being named as a defendant in future lawsuits related to its pension group annuity business, which could result in additional expenses, adverse regulations and oversight, and/or additional reputational harm. These lawsuits could also spur similar copycat lawsuits, which could further impact Athene’s pension group annuity business. To the extent that the inflows in Athene’s pension group annuity business continue to be negatively impacted by these lawsuits, and in the event of any related regulatory and governmental scrutiny, Athene may seek to increase its inflows in its other distribution channels, including by issuing additional funding agreements within its institutional channel. However, there are no assurances that Athene would be successful in replacing any future pension group annuity inflows with inflows from other distribution channels or that such other inflows would result in comparable spreads.
Climate change-related risks and regulatory and other efforts to address climate change could adversely affect our business.
We and the portfolio companies of the funds we manage face a number of risks associated with climate change, including both transition and physical risks. The transition risks that could impact us and the investments of the funds we manage include those risks related to the impact of U.S. and foreign climate-related legislation and regulation, as well as risks arising from climate-related business trends. Moreover, our investments, and the investments of the portfolio companies of the funds we manage, are subject to risks stemming from the physical impacts of climate change. In particular, climate change may impact asset prices, increase insurance costs and decrease the value of investments linked to real estate. For example, rising sea levels may lead to decreases in real estate values in coastal areas. We and the funds we manage could have significant concentrations of real estate investments and collateral underlying investments linked to real estate in areas of the U.S. prone to severe weather and climate events (such as wildfires, droughts, hurricanes and floods), including California, sections of the Northeastern U.S., the South Atlantic states and the Gulf Coast.
Climate change-related regulations or interpretations of existing laws have resulted, and may continue to result, in enhanced disclosure obligations that could negatively affect us or the investments of the portfolio companies of the funds we manage and also materially increase our regulatory burden. We also face business trend-related climate risks. Certain fund investors are increasingly taking climate-related risks into account when determining whether to invest in the funds we manage. Conversely, certain fund investors may also be concerned if our funds take climate change-related risks into account when making portfolio management decisions. Our reputation and investor relationships could be damaged as a result of our involvement, or the involvement of the funds we manage, in certain industries, portfolio companies or transactions associated with activities perceived to be causing or exacerbating climate change, as well as any decisions we make to continue to conduct or change our activities in response to considerations relating to climate change.
Risks Related to Taxation
The tax treatment of our structure is complex and may be subject to change as a result of new laws or regulations or differing interpretations of existing laws and regulations, under audit or otherwise, potentially on a retroactive basis.
The tax treatment of our structure and transactions undertaken by us depends in some instances on determinations of fact and interpretations of complex provisions of U.S. federal, state, local and non-U.S. income and other tax laws for which no clear precedent or authority may be available. In addition, U.S. federal, state, local and non-U.S. income and other tax rules are constantly under review by persons involved in the legislative process, the IRS, the U.S. Department of the Treasury, and U.S. state and local and non-U.S. legislative, taxation and regulatory bodies, which frequently results in revised interpretations of established concepts, statutory changes, revisions to regulations and other modifications and interpretations. It is possible that future legislation increases the U.S. federal income and non-U.S. tax rates applicable to corporations, limits further the deductibility of interest, or effects other changes that could have a material adverse effect on our business, results of operations and financial condition. Changes in some jurisdictions (particularly in the U.K.) to the rate, basis, qualifying conditions or nature of carried interest taxation (whether arising because of a change of government policy, law or otherwise) could also have a detrimental effect on our business, as a result of difficulties with hiring, compensating and retaining talent in the U.K. or other jurisdictions.
We cannot predict whether any particular proposed legislation will be enacted or, if enacted, what the specific provisions or the effective date of any such legislation would be, or whether it would have any effect on us. As such, we cannot assure you that future legislative, administrative or judicial developments will not result in an increase in the amount of U.S. (including state or local) or non-U.S. tax payable by us, the funds we manage, portfolio companies owned by such funds or by investors in our
58
shares. If any such developments occur, our business, results of operations and cash flows could be adversely affected and such developments could have an adverse effect on your investment in our shares.
Our effective tax rate and tax liability is based on the application of current income tax laws, regulations and treaties as interpreted and applied by various jurisdictions. These laws, regulations and treaties are complex, and the manner in which they apply to us and our subsidiaries is sometimes open to interpretation. Moreover, the application of such laws, regulations and treaties may not be compatible with one another. Significant management judgment is required in determining our provision for income taxes, our deferred tax assets and liabilities and any valuation allowance recorded against our net deferred tax assets. Although management believes its application of current laws, regulations and treaties to be correct and sustainable upon examination by the tax authorities, the tax authorities could challenge our interpretation resulting in additional tax liability or adjustment to our income tax provision that could increase our effective tax rate and/or have other unforeseen adverse tax consequences.
In addition, we or certain of our subsidiaries or certain portfolio companies of the funds we manage are currently (or have been recently) under tax audit in various jurisdictions, and these jurisdictions or any others where we conduct business may assess additional tax against us. While we believe our tax positions, determinations, and calculations are reasonable, the final determination of tax upon resolution of any audits could be materially different from our historical tax provisions and accruals. Should additional material taxes be assessed as a result of an audit, assessment, or litigation, there could be an adverse effect on our results of operations and cash flows in the period or periods for which that determination is made. Even where an audit, assessment or litigation is resolved favorably to us, the additional costs incurred in resisting or resolving such audits, assessments or litigation may adversely affect our business.
Our structure is subject to a number of minimum tax regimes, the implementation of which remains uncertain. These regimes may not be compatible with one another and may cause us adverse tax consequences.
The U.S. Congress, the Organisation for Economic Co-operation and Development (the “OECD”) and other government bodies and organizations in jurisdictions where we and our affiliates are established, invest or conduct business continue to recommend and implement changes related to the taxation of multinational companies. The OECD/G20 Inclusive Framework on BEPS (the “Inclusive Framework”), which currently includes over 145 countries and jurisdictions has proposed and driven the implementation by its participating jurisdictions of changes to numerous long-standing tax principles through its base erosion and profit shifting (“BEPS”) project, which is focused on a number of issues, including the prevention of profit shifting among affiliated entities in different jurisdictions, limitation of improper interest deductibility claims and ensuring eligibility of taxpayers claiming the benefits of double tax treaties. The BEPS project includes a two-pillar initiative, “BEPS 2.0,” which is aimed at (1) shifting taxing rights to the jurisdiction of the consumer (“Pillar One”) and (2) ensuring all companies pay a global minimum tax (“Pillar Two”).
Pillar One will, broadly, re-allocate taxing rights over 25% of the residual profits of multinational enterprises (“MNEs”) with global turnover in excess of 20 billion euros (excluding extractives and regulated financial services) to the jurisdictions where the customers and users of those MNEs are located. While the OECD continues to seek agreement regarding the form and timing of implementation of Pillar One, no concrete proposal has yet been achieved. The form, scope and timing of measures to implement Pillar One and their impact on our business and the taxes we pay remain unclear and subject to ongoing negotiations and, therefore, we cannot currently say whether these measures have an adverse effect on our business.
Pillar Two consists of two interlocking domestic rules (together the Global Anti-Base Erosion Rules (“GloBE Rules”)): (1) an Income Inclusion Rule (“IIR”), which imposes top-up tax on a parent entity in respect of the low-taxed income of a constituent entity within that parent entity’s group; and (2) an Undertaxed Payment Rule (“UTPR”), which denies deductions or requires an equivalent adjustment to the extent the low-taxed income of a constituent entity is not subject to tax under an IIR. Pillar Two also includes a treaty-based Subject to Tax Rule that allows source jurisdictions to impose limited source taxation on certain related party payments subject to tax below a minimum rate, and a limited number of Inclusive Framework members have either signed or expressed an intention to sign a multilateral convention to implement the Subject to Tax Rule. The timeline for implementation of this Subject to Tax Rule remains uncertain.
The ultimate application of Pillar Two as implemented by jurisdictions which may seek to assert taxing rights with respect to our business remains uncertain and subject to legislative and interpretative change. The Inclusive Framework released model GloBE rules in late 2021 and has continued to release guidance on the interpretation and application of the model GloBE Rules, and jurisdictions enacting legislation in respect of Pillar Two have sought to implement these updates (either by way of legislative amendment or the release of further domestic guidance). We expect that the Inclusive Framework will continue to
59
release updates to its administrative guidance which may result in further amendments to the Pillar Two rules as they apply in relevant jurisdictions. As such, several aspects of Pillar Two, including whether some or all of our activities may fall within the scope of the exclusions therefrom, currently remain uncertain.
The U.K. has enacted legislation implementing the IIR via a “multinational top-up tax” (“MTT”), alongside a U.K. domestic top-up tax, that applies to MNEs for accounting periods beginning on or after December 31, 2023. Amendments to the MTT include new provisions relating to the U.K.’s implementation of a UTPR rule for accounting periods beginning on or after December 31, 2024. Additionally, as part of the 2025 Autumn Budget, the U.K. announced measures to further amend the U.K.’s Pillar Two rules which include measures to give effect to certain amendments contained in the OECD’s guidance released on January 15, 2025.
On January 5, 2026, members of the Inclusive Framework agreed on several new safe harbors as part of a package of measures on Pillar Two aimed at reducing compliance burdens and ensuring fair treatment of substance-based tax incentives. A key element of the package includes measures designed to ensure that, subject to certain conditions, neither the IIR nor the UTPR would apply to certain U.S. headquartered MNEs (or any foreign subsidiaries included in the group’s consolidated financial statements) for financial years commencing on or after January 1, 2026 (the “SbS Safe Harbor”). While these measures could, if implemented as contemplated, significantly reduce the potential impact of the Pillar Two rules to some or all of our business, the practical impact of these measures remains uncertain and will depend on local law enactment, administrative guidance, and interpretation in the relevant jurisdictions. In addition, local Pillar Two regimes, including qualified domestic minimum top-up taxes, may continue to apply in jurisdictions in which our business operates. In the U.K., the Exchequer Secretary to His Majesty’s Treasury announced on January 7, 2026 that measures to implement the new provisions in the U.K., applicable to accounting periods beginning on or after January 1, 2026, will be subject to technical consultation and then brought forward in the next Finance Bill. However, no assurances can be provided that such measures will be enacted or, if enacted, what their effective date may be.
It is likely that other countries or jurisdictions will continue to implement the recommended model GloBE Rules (including either or both of the IIR or UTPR) as drafted or in a modified form, although some countries may not introduce such changes. As noted below, Bermuda in particular has enacted the Bermuda Corporate Income Tax Act 2023 (the “Bermuda CIT”) in response to the Pillar Two initiative. The implications of these rules for our business remain uncertain, both at a domestic level in Bermuda and in terms of how the Bermuda CIT (which came into full effect on January 1, 2025) might interact with the MTT and UTPR legislation or other Pillar Two implementing legislation in relevant jurisdictions. These rules also now need to be considered against the backdrop of the above mentioned SbS Safe Harbor measures which have the potential to exclude certain US-headed groups from the IRR and UTPR altogether. As noted below, we have taken specific steps under the Bermuda CIT in response to the SbS Safe Harbor measures.
In addition, depending on how the model GloBE Rules are implemented or clarified by additional commentary or guidance in the future, they may result in material additional tax being payable by our business and the businesses of the companies in which we invest. The ultimate implementation of the BEPS project may also increase the complexity and the burden and costs of compliance and advice relating to our ability to efficiently fund, hold and realize investments, and could necessitate or increase the probability of some restructuring of our group or business operations. This may also lead to additional complexity in evaluating the tax implications of ongoing investments and restructuring transactions within our business.
As noted above, on December 27, 2023, the Government of Bermuda enacted the Bermuda CIT. Commencing on January 1, 2025, the Bermuda CIT imposes a 15% corporate income tax on entities that are tax residents in Bermuda or have a Bermuda permanent establishment and are members of multi-national groups with consolidated revenues in excess of €750 million for at least two of the last four fiscal years. The Bermuda CIT also includes various transitional provisions and elections that may reduce the economic impact of the tax imposed. We expect that our subsidiaries that are organized in Bermuda generally will be subject to tax under the Bermuda CIT although we do not expect to owe any cash tax thereunder. As discussed in “Item 7. Management’s Discussion and Analysis of Financial Condition and Results of Operations—Liquidity and Capital Resources—Retirement Services Liquidity—Bermuda Corporate Income Tax”, in response to the SbS Safe Harbor measures described above, and the announcement by the Exchequer Secretary to His Majesty’s Treasury in the U.K. that measures to implement the new provisions will be brought forward in the next Finance Bill, ACRA revoked its election to be subject to Bermuda CIT. As discussed in “Item 7. Management’s Discussion and Analysis of Financial Condition and Results of Operations—Liquidity and Capital Resources—Retirement Services Liquidity—Bermuda Corporate Income Tax”, we expect the revocation of this election to result in a reduction to other assets and a corresponding increase to income tax provision, which results in a reduction to equity, equal to the net amount of the Bermuda deferred tax assets of $1.7 billion. Prior to the enactment of the Bermuda CIT, certain of our subsidiaries had received from the Bermuda Minister of Finance, under the
60
Exempted Undertakings Tax Protection Act 1966 of Bermuda, as amended, Tax Assurance Certificates that they generally would not be subject to income or estate tax until March 31, 2035. No assurances can be provided that the Bermuda CIT, future amendments, regulations or other guidance in respect of the Bermuda CIT, the interaction of the Bermuda CIT with SbS Safe Harbor implementing legislation (if any), any consequences of our revocation of ACRA’s election to be subject to Bermuda CIT or the limited nature and duration of the Tax Assurances Certificate will not negatively affect our earnings and results of operations.
On August 16, 2022, the U.S. government enacted the Inflation Reduction Act of 2022 (the “IRA”). The IRA contains a number of tax-related provisions, including a 15% minimum corporate income tax on certain large corporations (“CAMT”) as well as an excise tax on stock repurchases. On September 12, 2024, the IRS and the U.S. Treasury Department released proposed regulations on the CAMT which include rules for determining the income base on which the CAMT is imposed and for determining when a corporation is subject to the CAMT. On November 21, 2025, the IRS and the U.S. Treasury Department released final regulations governing the excise tax on stock repurchases. Based on interpretations of the proposed regulatory guidance and assumptions we have made regarding the CAMT, and the regulatory guidance regarding the excise tax on stock repurchases, we do not currently expect the CAMT or excise tax on stock repurchases to have a material impact on our effective tax rate. The impact of the IRA on our financial condition will depend on the facts and circumstances of each year.
The Base Erosion and Anti-Abuse Tax (“BEAT”) also operates as a minimum tax and is generally calculated as a percentage (10% for taxable years before 2026 and 10.5% thereafter) of the “modified taxable income” of an “applicable taxpayer” and applies for a taxable year only to the extent it exceeds a taxpayer’s regular corporate income tax liability for such year, determined without regard to certain tax credits. Certain of our reinsurance agreements require our U.S. subsidiaries, including any non-U.S. subsidiaries that have elected to be subject to U.S. federal income taxation, to pay or accrue substantial amounts to certain of our non-U.S. reinsurance subsidiaries that would be characterized as “base erosion payments” with respect to which there are “base erosion tax benefits.” These and any other “base erosion payments” may cause us to be subject to the BEAT. In addition, tax authorities may disagree with our BEAT calculations, or the interpretations on which those calculations are based, and assess additional taxes, interest and penalties. There may be material adverse consequences to our business if tax authorities successfully challenge our BEAT calculations, in light of the uncertainties described above.
Certain of our non-U.S. subsidiaries may be subject to U.S. federal income taxation in an amount greater than expected.
Certain of our non-U.S. subsidiaries are treated as foreign corporations under the Internal Revenue Code of 1986, as amended (such subsidiaries, the “Non-U.S. Subsidiaries”). Each of the Non-U.S. Subsidiaries currently intends to operate in a manner that will not cause it to be subject to U.S. federal income taxation on a net basis in any material amount. However, there is considerable uncertainty as to whether a foreign corporation is engaged in a trade or business (or has a permanent establishment) in the U.S., as the law is unclear and the determination is highly factual and must be made annually. Therefore, there can be no assurance that the IRS will not successfully contend that a Non-U.S. Subsidiary that does not intend to be treated as engaged in a trade or business (or as having a permanent establishment) in the U.S. does, in fact, so engage (or have such a permanent establishment). If any such Non-U.S. Subsidiary is treated as engaged in a trade or business in the U.S. (or as having a permanent establishment), it may incur greater tax costs than expected on any income not exempt from taxation under an applicable income tax treaty, which could have a material adverse effect on our financial condition, results of operations and cash flows.
In addition, certain of our subsidiaries are treated as resident in the U.K. for U.K. tax purposes (the “U.K. Resident Companies”) and expect to qualify for the benefits of the income tax treaty between the U.S. and the U.K. (the “U.K. Treaty”) by reason of being subsidiaries of AGM or by reason of satisfying an ownership and base erosion test. Accordingly, our U.K. Resident Companies are expected to qualify for certain exemptions from, or reduced rates of, U.S. federal taxes that are provided for by the U.K. Treaty. However, there can be no assurances that our U.K. Resident Companies will continue to qualify for treaty benefits or satisfy all of the requirements for the tax exemptions and reductions they intend to claim. If any of our U.K. Resident Companies fails to qualify for such benefits or satisfy such requirements, it may incur greater tax costs than expected, which could have a material adverse effect on our financial condition, results of operations and cash flows.
Our ownership of certain non-U.S. entities could cause us to be subject to U.S. federal income tax in amounts greater than expected, which could adversely affect the value of your investment.
Certain of our investments may be in foreign corporations or may be acquired through foreign subsidiaries that would be classified as corporations for U.S. federal income tax purposes. Such entities may be passive foreign investment companies (“PFICs”) or controlled foreign corporations (“CFCs”) for U.S. federal income tax purposes. For example, certain of our
61
subsidiaries are non-U.S. companies and certain portfolio companies owned by the funds we manage are considered to be CFCs for U.S. federal income tax purposes. In addition, in December 2017, the TCJA introduced changes to the determination of when a foreign corporation is treated as a CFC (including through downward attribution) and whether a U.S. shareholder of a CFC is required to include its pro rata share of certain income generated by the CFC into income currently regardless of whether the shareholder receives any related distributions of cash. The One Big Beautiful Bill Act (the “OBBBA”) made several changes to the determination of CFC status including reinstating the limitation on downward attribution from non-U.S. persons for purposes of determining CFC status, introducing the “foreign controlled U.S. shareholders” of “foreign-controlled corporations” provisions which apply downward attribution in certain cases, and modifying the pro rata share rules by replacing the “last day” rule with a full year approach. Aspects of these changes remain uncertain, and we may experience adverse U.S. tax consequences as a result of our ownership of non-U.S. companies, including the recognition of taxable income attributable to such companies’ non-U.S. operations and as a result, our financial condition, results of operations and cash flows could be adversely affected. In addition, if a reinsurance agreement is entered into among related parties, the IRS is permitted to reallocate or recharacterize income, deductions or certain other items, and to make any other adjustment, to reflect the proper amount, source or character of the taxable income of each of the parties. Reinsurance agreements between our U.S. insurance companies and their Bermuda affiliates may be subject to such challenge by the IRS. If the IRS were to successfully challenge our reinsurance arrangements, our financial condition, results of operations and cash flows could be adversely affected.
Changes in tax law could adversely impact our earnings.
Many of the products that our retirement services business sells and reinsures benefit from one or more forms of tax-favored status under current U.S. federal and state income tax regimes. For example, our retirement services business sells and reinsures annuity contracts that allow the policyholders to defer the recognition of taxable income earned within the contract. Future changes in U.S. federal or state tax law could reduce or eliminate the attractiveness of such products, which could affect the sale of retirement services’ products or increase the expected lapse rate with respect to products that have already been sold. Decreases in product sales or increases in lapse rates, in either case, brought about by changes in U.S. tax law, may result in a decrease in net invested assets and therefore investment income and may have a material and adverse effect on our business, financial position, results of operations and cash flows.
On July 4, 2025, the U.S. government enacted the OBBBA which further modifies various provisions of the U.S. federal tax rules, including certain provisions of the IRA. The OBBBA made permanent many provisions of the TCJA including the corporate tax rate structures. The OBBBA also made substantial modifications to the international tax rules applicable to U.S. persons, including changes to the global intangible low-taxed income regime, the foreign-derived deduction eligible income regime, and BEAT (as discussed above). The OBBBA introduced other legislative changes, including the restoration of deductible net business interest expense under Internal Revenue Code Section 163(j) to 30% of earnings before interest, taxes, depreciation and amortization. The impact of the OBBBA on our financial condition will depend on the facts and circumstances of each year.
In addition, several of the BEPS measures, including measures covering treaty abuse, the deductibility of interest expense, local nexus requirements, transfer pricing and hybrid mismatch arrangements, are relevant to some of our fund structures and could have an adverse impact on the funds we manage, investors and the portfolio companies of the funds we manage. Inclusive Framework members have been moving forward on the BEPS agenda and significant aspects of the proposals have been implemented or are scheduled for implementation but, because the timing of implementation and the specific measures adopted vary among participating member countries, significant uncertainty remains regarding the full impact of the BEPS project for our business. Uncertainty remains around, among other matters, access to tax treaties for some of the investments’ holding platforms, which could create situations of double taxation and adversely impact the investment returns of the funds we manage.
Risks Related to Our Common Shares
The market price and trading volume of our shares may be volatile, which could result in rapid and substantial losses for our stockholders.
The market price of our shares may be highly volatile and could be subject to wide fluctuations. In addition, the trading volume in our shares may fluctuate and cause significant price variations to occur. You may be unable to resell your shares at or above your purchase price, if at all. Some of the factors that could negatively affect the price of our shares or result in fluctuations in the price or trading volume of our shares include: variations in our quarterly operating results, which variations we expect will be substantial, or dividends; our policy of taking a long-term perspective on making investment, operational and strategic
62
decisions, which is expected to result in significant and unpredictable variations in our quarterly returns; our creditworthiness, results of operations and financial condition; the credit ratings of the shares; dilution caused by the conversion of our Mandatory Convertible Preferred Stock; the prevailing interest rates or rates of return being paid by other companies similar to us and the market for similar securities; failure to meet analysts’ earnings estimates; publication of research reports about us, the investment management industry or the retirement services industry or the failure of securities analysts to cover our shares; additions or departures of key management personnel; adverse market reaction to any indebtedness we may incur or securities we may issue in the future; actions by stockholders; changes in market valuations of similar companies; removal of our shares from any stock index; speculation in the press or investment community; changes or proposed changes in laws or regulations or differing interpretations thereof affecting our businesses or enforcement of these laws and regulations, or announcements relating to these matters; a lack of liquidity in the trading of our shares; adverse publicity about the investment management industry generally or individual scandals, specifically; a breach of our computer systems, software or networks, or misappropriation of our proprietary information; and economic, financial, geopolitical, regulatory or judicial events or conditions that affect us or the financial markets.
An investment in our shares is not an investment in any of the funds we manage, and the assets and revenues of such funds are not directly available to us.
Our shares are securities of Apollo Global Management, Inc. only. While our historical consolidated and combined financial information includes financial information, including assets and revenues of certain funds we manage on a consolidated basis, and our future financial information will continue to consolidate certain of these funds, such assets and revenues are available to the fund, and not to us except through management fees, performance fees, distributions and other proceeds arising from agreements with funds, as discussed in more detail in this report.
Our Certificate of Incorporation provides that the Court of Chancery of the State of Delaware is the sole and exclusive forum for certain legal actions between us and our stockholders, which could limit our stockholders’ ability to obtain a judicial forum viewed by the stockholders as more favorable for disputes with us or our directors, officers or employees, and the enforceability of the exclusive forum provision may be subject to uncertainty.
Article XIV of our Certificate of Incorporation provides that, unless we consent in writing to the selection of an alternative forum, the Court of Chancery of the State of Delaware shall, to the fullest extent permitted by law, be the sole and exclusive forum for: (a) any derivative action or proceeding brought on our behalf; (b) any action asserting a claim of breach of a fiduciary duty owed by any of our current or former directors, officers, other employees or stockholders to us or our stockholders; (c) any action asserting a claim arising pursuant to any provision of the DGCL, the Certificate of Incorporation or our Bylaws or as to which the DGCL confers jurisdiction on the Court of Chancery of the State of Delaware; or (d) any action asserting a claim governed by the internal affairs doctrine, except for, as to each of (a) through (d) above, any claim as to which the Court of Chancery determines that there is an indispensable party not subject to the jurisdiction of the Court of Chancery (and the indispensable party does not consent to the personal jurisdiction of the Court of Chancery within ten days following such determination), which is vested in the exclusive jurisdiction of a court or forum other than the Court of Chancery, or for which the Court of Chancery does not have subject matter jurisdiction. The exclusive forum provision also provides that it will not apply to claims arising under the Securities Act, the Exchange Act or other federal securities laws for which there is exclusive federal or concurrent federal and state jurisdiction, in which case the U.S. federal district courts shall be the exclusive forum for such claims unless the Company consents in writing to an alternative forum. Stockholders cannot waive, and will not be deemed to have waived under the exclusive forum provision, the Company’s compliance with the federal securities laws and the rules and regulations thereunder. Although we believe this exclusive forum provision benefits us by providing increased consistency in the application of Delaware law in the types of lawsuits to which it applies, this exclusive forum provision may limit a stockholder’s ability to bring a claim in a judicial forum that it finds favorable for disputes with us or any of our directors, officers, other employees or stockholders, which may discourage lawsuits with respect to such claims. Further, in the event a court finds the exclusive forum provision contained in the Certificate of Incorporation to be unenforceable or inapplicable in an action, we may incur additional costs associated with resolving such action in other jurisdictions, which could harm our business, operating results and financial condition.
Declaration, payment and amounts of dividends, if any, to holders of our shares will be uncertain.
It is expected that we will continue to pay an annual dividend on our common stock, with increases based on the growth of the business as determined by our board of directors. The amount of dividends, if any, that are declared or paid to our stockholders, depends on a number of factors. Our board of directors will have sole discretion to determine whether any dividends will be declared, when dividends, if any, are declared, and the amount of such dividends. We expect that such determination would be
63
based on a number of considerations, including our results of operations and capital management plans and the market price of our shares, the availability of funds, our access to capital markets as well as industry practice and other factors deemed relevant by our board of directors, such as insurance regulatory requirements applicable to our subsidiaries. In addition, our ability to pay dividends and the amount of any dividends ultimately paid in respect of our shares will, in each case, be subject to receiving funds, directly or indirectly, from our operating subsidiaries, AAM and AHL. Furthermore, the ability of these operating subsidiaries to make distributions to us will depend on satisfying applicable law with respect to such distributions and making prior distributions on the AHL outstanding preferred stock, and the ability of AAM and AHL to receive distributions from their own respective subsidiaries will continue to depend on applicable law with respect to such distributions. There can be no guarantee that our stockholders will receive or be entitled to dividends commensurate with our historical dividends.
In addition, on August 11, 2023, we issued 28,750,000 shares of Mandatory Convertible Preferred Stock with a dividend rate of 6.75% per annum on the liquidation preference of $50 per share. The Mandatory Convertible Preferred Stock, which is expected to be subject to mandatory conversion on July 31, 2026, ranks senior to our common stock with respect to the payment of dividends. As long as any share of Mandatory Convertible Preferred Stock is outstanding, unless all accumulated and unpaid dividends on the Mandatory Convertible Preferred Stock for all preceding dividend periods have been declared and paid in full or declared and set apart for payment, we may not declare, pay or set apart for payment any dividends on our common stock or any other class or series of stock that ranks junior to the Mandatory Convertible Preferred Stock. Dividends on the Mandatory Convertible Preferred Stock are discretionary and cumulative. Holders of Mandatory Convertible Preferred Stock will only receive dividends on their shares when, as and if declared by our board of directors. If dividends on the Mandatory Convertible Preferred Stock have not been declared and paid for the equivalent of six or more quarterly dividend periods, whether or not consecutive, holders of Mandatory Convertible Preferred Stock, together as a class with holders of any other series of parity stock with like voting rights, will be entitled to vote for the election of two additional directors to our board of directors. This right to elect additional directors to our board of directors will dilute the representation of our stockholders on our board of directors and may adversely affect the market price of our common stock. When quarterly dividends have been declared and set apart for payment in full, the right of the holders of Mandatory Convertible Preferred Stock to elect these two additional directors will cease, the terms of office of these two directors will forthwith terminate and the number of directors constituting our board of directors will be reduced accordingly. In addition, the anticipated issuance of additional shares of our common stock in connection with the mandatory conversion of the Mandatory Convertible Preferred Stock may result in additional dilution to existing stockholders, impact per-share financial metrics and contribute to increased volatility in the market price of our common stock, including prior to the conversion date. Additional risks related to the Mandatory Convertible Preferred Stock are contained in the prospectus supplement dated August 8, 2023.
ITEM 1B. UNRESOLVED STAFF COMMENTS
None.
ITEM 1C. CYBERSECURITY
AGM’s board of directors is involved in overseeing the Company’s risk management program, including with respect to cybersecurity, which is a critical component of the Company’s overall approach to enterprise risk management (“ERM”). For additional information about our risk management framework, see “Part II—Item 7A. Quantitative and Qualitative Disclosures About Market Risk—Risk Management Framework.” Our cybersecurity policies and practices are fully integrated into our ERM framework through our reporting, risk management and oversight channels and are based, in part, on recognized frameworks established by the National Institute of Standards and Technology, the International Organization for Standardization and other applicable industry standards.
As one of the critical elements of the Company’s overall ERM approach, the Company’s cybersecurity program is focused on the following key areas:
•Governance. As discussed further under the heading “Cybersecurity Governance”, our board of directors has an oversight role, as a whole and also at the committee level, in overseeing management of AGM’s risks, including our cybersecurity risks. AGM’s Chief Information Security Officer (“CISO”) and AHL’s CISO, with support from the broader Technology team, are responsible for information security strategy, policies and practices.
•Collaborative Approach. The Company utilizes a cross-functional approach involving stakeholders across multiple departments, including Compliance, Legal, Technology, Operations, Risk and others, aimed at identifying, preventing and mitigating cybersecurity threats and incidents, while also implementing controls and procedures that provide for
64
the prompt escalation of potentially material cybersecurity incidents so that decisions regarding the public disclosure and reporting of such incidents can be made by management in a timely manner.
•Technical Safeguards. The Company deploys technical safeguards that are designed to protect the Company’s information systems from cybersecurity threats, including firewalls, intrusion prevention and detection systems, anti-malware functionality and access controls, which are evaluated and improved on an ongoing basis using vulnerability assessments and cybersecurity threat intelligence.
•Incident Response and Recovery Planning. The Company has established and maintains incident response and recovery plans that address the Company’s response to a cybersecurity incident, and such plans are tested and evaluated on a regular basis.
•Third-Party Risk Management. The Company maintains a risk-based approach to identifying and overseeing cybersecurity risks presented by third parties, including vendors, service providers and other external users of the Company’s systems, as well as the systems of third parties that could adversely impact our business in the event of a cybersecurity incident affecting those third-party systems.
•Education and Awareness. The Company provides regular, mandatory training for personnel regarding cybersecurity threats to equip the Company’s personnel with effective tools to help mitigate cybersecurity threats, and to communicate the Company’s evolving information security policies, standards, processes and practices.
The Company engages in the periodic assessment and testing of the Company’s policies and practices that are designed to address cybersecurity threats and incidents. These efforts include a wide range of activities, including audits, assessments, tabletop exercises, threat modeling, vulnerability testing and other exercises focused on evaluating the effectiveness of our cybersecurity measures. The Company regularly engages third parties, including auditors and consultants, to perform assessments on our cybersecurity measures, including information security maturity assessments, audits and independent reviews of our information security control environment and operating effectiveness. The results of such assessments, audits and reviews are reported to the Company’s risk management function, and the Company adjusts its cybersecurity policies and practices as necessary based on the information provided by these assessments, audits and reviews.
Cybersecurity Governance
In our retirement services business, our board of directors’ oversight of cybersecurity risk management is supported by the AHL board of directors, the AHL board’s audit, risk, and legal and regulatory committees, the AHL management risk committee, the AHL management operational risk committee and AHL management. AHL’s Chief Information Officer (“CIO”), CISO, General Counsel and certain other members of AHL’s senior management meet periodically with the audit,
65
risk, and legal and regulatory committees of AHL’s board of directors to review AHL’s information technology and cybersecurity risk profile and to discuss risk mitigation plans.
Apollo and Athene Cyber teams coordinate with and leverage one another across a number of areas. The CISOs meet regularly to discuss cyber-related risks, programs and projects. Other members of Apollo and Athene’s Cyber teams meet as needed on a variety of topics and open lines of communications are present to allow for the information sharing across the retirement services and asset management businesses.
Asset Management
The AGM CISO, in coordination with Technology and ERM, works collaboratively across the Company to implement a program designed to protect the Company’s information systems from cybersecurity threats and to promptly respond to any cybersecurity incidents in accordance with the Company’s incident response and recovery plans. To facilitate the success of the Company’s cybersecurity risk management program, multidisciplinary teams throughout the Company are deployed to address cybersecurity threats and to respond to cybersecurity incidents. Through ongoing communications with these teams, the CISO monitors the prevention, detection, mitigation and remediation of cybersecurity threats and incidents in real time and reports such threats and incidents to the AGM Audit Committee or AGM board, as appropriate.
AGM’s CISO holds a master’s degree in Business Information Systems and has served in various roles in information technology and information security for over 25 years across a number of large financial institutions, including as Director, Cybersecurity and Risk.
Retirement Services
AHL’s information security program is managed by its CISO with collaboration across lines of businesses and corporate functions. AHL’s CISO is a senior-level executive responsible for establishing and executing AHL’s information security strategy, including cybersecurity oversight. AHL’s information security program implements a detailed cyber incident response plan that provides controls and procedures for handling cyber incidents and incorporates a cross-functional approach to addressing cybersecurity risk, with engagement among internal working groups. AHL’s CIO and CISO are members of AHL’s management operational risk committee, which reports to AHL’s management risk committee, which reports to AHL’s board risk committee.
AHL’s CIO has over 30 years of insurance and financial services operations and technology experience, including as chief information officer at large insurance companies, and received a Bachelor of Science in business management and a Master of Business Administration in management information systems. AHL’s CISO is responsible for managing our information security program. AHL’s CISO has over 25 years of information technology experience and over 20 years of information security experience; is a Certified Information Systems Security Professional, a Certified Information Systems Manager, and holds a Bachelor of Arts in statistical science, a Bachelor of Science in computer science, and a Master of Business Administration in business.
ITEM 2. PROPERTIES
Our principal executive offices are located in leased office space at 9 West 57th Street, New York, New York 10019.
In our asset management business, Apollo also leases the space for our offices in New York, El Segundo, Irvine, Houston, Bethesda, Greenwich, Miami, Palm Beach, Salt Lake City, Orlando, Atlanta, Charlotte, London, Frankfurt, Luxembourg, Amsterdam, Zurich, Mumbai, Singapore, Hong Kong, Shanghai, Seoul, Tokyo and Sydney, among other locations throughout the world.
In our retirement services business, Athene owns its headquarters, which is located in West Des Moines, Iowa and leases its head office for Bermuda operations, which is located in Hamilton, Bermuda.
The Company considers these facilities to be suitable and adequate for the management and operation of its businesses.
66
ITEM 3. LEGAL PROCEEDINGS
See a summary of the Company’s legal proceedings set forth in note 19 to our consolidated financial statements, which is incorporated by reference herein.
ITEM 4. MINE SAFETY DISCLOSURES
Not applicable.
67
PART II – OTHER INFORMATION
ITEM 5. MARKET FOR REGISTRANT'S COMMON EQUITY, RELATED STOCKHOLDER MATTERS AND ISSUER PURCHASES OF EQUITY SECURITIES
Our common stock is traded on the NYSE under the symbol “APO.”
The number of holders of record of our common stock as of February 20, 2026 was 923. This does not include the number of stockholders that hold stock in “street name” through banks or broker-dealers.
Stock Performance Graph
The following graph depicts the total return to holders of our common stock from the closing price on December 31, 2020 through December 31, 2025, relative to the performance of the S&P 500 Index and the Dow Jones U.S. Asset Managers Index. The graph assumes $100 invested on December 31, 2020 and dividends received reinvested in the security or index.
The performance graph is not intended to be indicative of future performance. The performance graph shall not be deemed “soliciting material” or to be “filed” with the SEC for purposes of Section 18 of the Exchange Act, or otherwise subject to the liabilities under that Section, and shall not be deemed to be incorporated by reference into any of the Company’s filings under the Securities Act or the Exchange Act.
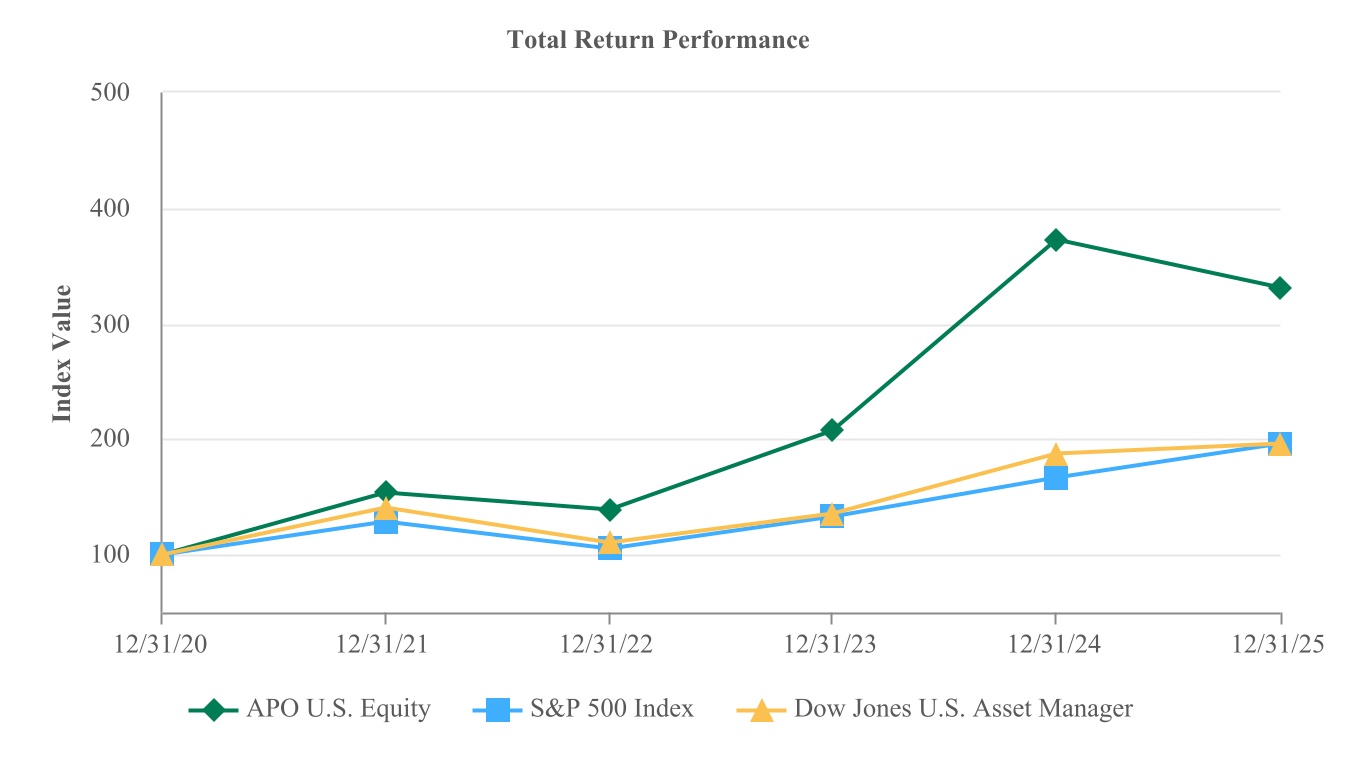
Dividend Policy
The quarterly cash dividends previously paid to our common stockholders can be found in note 16 to our consolidated financial statements. We have also declared a cash dividend of $0.51 per share of common stock, which will be paid on February 27, 2026 to holders of record at the close of business on February 19, 2026. Our current intention is to pay an annual cash dividend of $2.25 per share of common stock.
We have also declared and set aside for payment a cash dividend of $0.8438 per share of our Mandatory Convertible Preferred Stock, which will be paid on April 30, 2026 to holders of record at the close of business on April 15, 2026.
68
The declaration and payment of any dividends on our common stock or Mandatory Convertible Preferred Stock are at the sole discretion of our board of directors, which may change the dividend policy at any time, including, without limitation, to eliminate the dividend on common stock entirely, and will depend upon many factors, including general economic and business conditions, our strategic plans and prospects, our businesses and investment opportunities, our financial condition and operating results, working capital requirements and anticipated cash needs, contractual restrictions and obligations, legal, tax and regulatory restrictions, restrictions and other implications on the payment of dividends by us or by our subsidiaries to us and such other factors as our board of directors may deem relevant. Because AGM is a holding company, the primary source of funds for AGM’s dividends are distributions from its operating subsidiaries, AAM and AHL. Furthermore, the ability of these operating subsidiaries to make distributions to AGM will depend on satisfying applicable law with respect to such distributions and making prior distributions on the AHL outstanding preferred stock, and the ability of AAM and AHL to receive distributions from their own respective subsidiaries will continue to depend on applicable law with respect to such distributions. See “Item 1A. Risk Factors—Risks Related to Our Common Shares—Declaration, payment and amounts of dividends, if any, to holders of our shares will be uncertain.”
Under the DGCL we may only pay dividends to our stockholders out of (i) our surplus, as defined and computed under the provisions of the DGCL or (ii) our net profits for the fiscal year in which the dividend is declared and/or the preceding fiscal year. Subject to the rights of the holders of Mandatory Convertible Preferred Stock and any other preferred shares and applicable law, our Certificate of Incorporation and Bylaws provide that our board of directors may, in its sole discretion, at any time and from time to time, declare, make and pay dividends to the holders of our common stock. Instruments governing indebtedness that we or our subsidiaries incur in the future may contain restrictions on our or our subsidiaries’ ability to pay dividends or make other cash distributions to equity holders.
Securities Authorized for Issuance Under Equity Compensation Plans
See “Item 12. Security Ownership of Certain Beneficial Owners and Management and Related Stockholder Matters.”
Unregistered Sales of Equity Securities
On November 13, 2025, the Company issued 41,166 restricted shares under the 2019 Omnibus Equity Incentive Plan for Estate Planning Vehicles and 14,310 restricted shares under the 2019 Omnibus Equity Incentive Plan to certain holders of vested performance fee rights. The shares were issued in private placements in reliance on Regulation D or Section 4(a)(2) of the Securities Act.
69
Purchases of Equity Securities by the Issuer and Affiliated Purchasers
The following table sets forth information regarding repurchases of shares of common stock during the fiscal quarter ended December 31, 2025.
| Period | Total number of shares of common stock purchased | Average price paid per share | Total number of shares of common stock purchased as part of publicly announced plans or programs1 | Approximate dollar value of common stock that may yet be purchased under the plans or programs | ||||||||||||||||||||||
| October 1, 2025 through October 31, 2025 | ||||||||||||||||||||||||||
| Opportunistic repurchases | — | — | ||||||||||||||||||||||||
Equity award-related repurchases2 | — | — | ||||||||||||||||||||||||
| Total | — | $ | — | — | $ | 678,224,196 | ||||||||||||||||||||
| November 1, 2025 through November 30, 2025 | ||||||||||||||||||||||||||
| Opportunistic repurchases | — | — | ||||||||||||||||||||||||
Equity award-related repurchases2 | 1,828,097 | 1,828,097 | ||||||||||||||||||||||||
| Total | 1,828,097 | $ | 128.74 | 1,828,097 | $ | 442,874,505 | ||||||||||||||||||||
| December 1, 2025 through December 31, 2025 | ||||||||||||||||||||||||||
| Opportunistic repurchases | — | — | ||||||||||||||||||||||||
Equity award-related repurchases2 | 183,029 | 183,029 | ||||||||||||||||||||||||
| Total | 183,029 | $ | 136.62 | 183,029 | $ | 417,868,692 | ||||||||||||||||||||
| Total | ||||||||||||||||||||||||||
| Opportunistic repurchases | — | — | ||||||||||||||||||||||||
Equity award-related repurchases2 | 2,011,126 | 2,011,126 | ||||||||||||||||||||||||
| Total | 2,011,126 | 2,011,126 | ||||||||||||||||||||||||
1 On February 8, 2024, the AGM board of directors terminated the Company’s prior share repurchase program and approved a new share repurchase program, pursuant to which, the Company is authorized to repurchase up to $3.0 billion of shares of its common stock to opportunistically reduce the Company’s share count or offset the dilutive impact of share issuances under the Equity Plan. Effective February 9, 2026, the AGM board of directors terminated the Company's prior share repurchase program and approved a new share repurchase program, pursuant to which, the Company is authorized to repurchase up to $4.0 billion of shares of its common stock to opportunistically reduce the Company’s share count or offset the dilutive impact of share issuances under the Equity Plan. Under the share repurchase program, repurchases may be of outstanding shares of common stock occurring from time to time in open market transactions, in privately negotiated transactions, pursuant to a trading plan adopted in accordance with Rule 10b5-1 of the Exchange Act, or otherwise, as well as through reductions of shares that otherwise would have been issued to participants under the Equity Plan in order to satisfy associated tax obligations. The share repurchase program does not obligate the Company to make any repurchases at any specific time. The program is effective until the aggregate repurchase amount that has been approved by the AGM board of directors has been expended. The program may be suspended, extended, modified or discontinued at any time. | ||||||||||||||||||||||||||
2 Represents repurchases of shares of common stock in order to offset the dilutive impact of share issuances under the Equity Plan including reductions of shares of common stock that otherwise would have been issued to participants under the Equity Plan in order to satisfy associated tax obligations. | ||||||||||||||||||||||||||
ITEM 6. [RESERVED]
70
ITEM 7. MANAGEMENT’S DISCUSSION AND ANALYSIS OF FINANCIAL CONDITION AND RESULTS OF OPERATIONS
The following discussion should be read in conjunction with Apollo Global Management, Inc.’s consolidated financial statements and the related notes as of December 31, 2025 and 2024 and for the years ended December 31, 2025, 2024 and 2023. This discussion contains forward-looking statements that are subject to known and unknown risks and uncertainties. Actual results and the timing of events may differ significantly from those expressed or implied in such forward-looking statements due to a number of factors, including those included in the section of this report entitled “Item 1A. Risk Factors.” The highlights listed below have had significant effects on many items within our consolidated financial statements and affect the comparison of the current period’s activity with those of prior periods.
General
Our Businesses
Founded in 1990, Apollo is a high-growth, global alternative asset manager and a retirement services provider. Apollo conducts its business primarily in the U.S. through the following three reportable segments: Asset Management, Retirement Services and Principal Investing. These business segments are differentiated based on the investment services they provide as well as varying investing strategies. As of December 31, 2025, Apollo had a team of approximately 6,140 employees, including 2,010 employees supporting our Retirement Services segment and 600 employees of Bridge.
Asset Management
Our Asset Management segment focuses on credit and equity investing strategies. We have a flexible mandate in many of the funds we manage which enables the funds to invest opportunistically across a company’s capital structure. We raise, invest and manage funds, accounts and other vehicles on behalf of some of the world’s most prominent pension, endowment and sovereign wealth funds and insurance companies, as well as other institutional and individual investors. As of December 31, 2025, we had total AUM of $938 billion.
The credit and equity investing strategies of our Asset Management segment reflect the range of investment capabilities across our platform, from investment grade to private equity. As an asset manager, we earn fees for providing investment management services and expertise to our client base. The amount of fees charged for managing these assets depends on the underlying investment strategy, liquidity profile, and, ultimately, our ability to generate returns for our clients. We also earn capital solutions fees as part of our growing capital solutions business and as part of monitoring and deployment activity alongside our private equity franchise. After expenses, we call the resulting earnings stream “Fee Related Earnings” or “FRE”, which represents the primary performance measure for the Asset Management segment.
Credit
Credit is our largest asset management strategy with $749 billion of AUM as of December 31, 2025. Our credit strategy spans third-party strategies and Apollo’s retirement services business across four main investment pillars: direct origination, asset-backed, multi credit and opportunistic credit. Our credit strategy provides flexible, scaled and diverse capital solutions across the entire credit risk-return spectrum, with a focus on generating excess returns through high-quality credit underwriting and origination. Beyond participation in the traditional issuance and secondary credit markets, through our origination platforms and corporate solutions capabilities we seek to originate attractive and safe-yielding assets for the investors in the funds we manage.
Equity
Our equity strategy managed $189 billion of AUM as of December 31, 2025. Across our equity strategy, we maintain our focus on creative structuring and sourcing while working with the management teams of the portfolio companies of the Apollo-managed funds to help transform and grow their businesses. Our flexible mandate and purchase price discipline allow us to embrace complexity and seek attractive outcomes for our stakeholders. Apollo’s equity team has experience across sectors, industries, and geographies spanning its private equity, hybrid value, secondaries equity, AAA, real estate equity, infrastructure and clean transition equity strategies. We have consistently produced attractive long-term investment returns in the traditional private equity funds we manage, generating a 39% gross IRR and a 24% net IRR on a compound annual basis from inception through December 31, 2025.
71
Acquisition of Bridge
On September 2, 2025, we completed the previously announced acquisition of Bridge in an all-stock transaction. As a result, Bridge became a consolidated subsidiary of AAM, and its results are included in the consolidated financial statements commencing from the Acquisition Date.
Retirement Services
Our retirement services business is conducted by Athene, a leading financial services company that specializes in issuing, reinsuring and acquiring retirement savings products designed for the increasing number of individuals and institutions seeking to fund retirement needs. Athene’s primary product line is annuities, which include fixed rate, indexed, payout and group annuities issued in connection with pension group annuity transactions and defined contribution plans. Athene also offers funding agreements and guaranteed investment contracts issued in connection with defined contribution plans. Funding agreements are comprised of funding agreements issued under its FABN program, secured and other funding agreements, which include Athene’s FABR program and direct funding agreements, funding agreements issued to the FHLB and repurchase agreements with an original maturity exceeding one year. Guaranteed investment contracts support stable value investment options within defined contribution plans and allow the contract holder to earn a guaranteed return of principal plus interest. Our asset management business provides a full suite of services for Athene’s investment portfolio, including direct investment management, asset allocation, mergers and acquisitions asset diligence, and certain operational support services including investment compliance, tax, legal and risk management support.
Our retirement services business focuses on generating spread income by combining the two core competencies of (1) sourcing long-term, persistent liabilities and (2) using the global scale and reach of our asset management business to actively source or originate assets with Athene’s preferred risk and return characteristics. Athene’s investment philosophy is to invest a portion of its assets in securities that earn an incremental yield by taking measured liquidity and complexity risk and capitalize on its long-dated, persistent liability profile to prudently achieve higher net investment earned rates, rather than assuming incremental credit risk. A cornerstone of Athene’s investment philosophy is that given the operating leverage inherent in its business, modest investment outperformance can translate to outsized return performance. Because Athene maintains discipline in underwriting attractively priced liabilities, it has the ability to invest in a broad range of high-quality assets to generate attractive earnings.
Principal Investing
Our Principal Investing segment is comprised of our realized performance fee income, realized investment income earned from our balance sheet investments, and certain allocable expenses related to corporate functions supporting the entire company. The Principal Investing segment also includes our growth capital and liquidity resources at AGM. Over time, we may deploy capital into strategic investments that will help accelerate the growth of our Asset Management segment, by broadening our investment management and/or product distribution capabilities or increasing the scalability and/or efficiency of our existing operations. We believe these investments may translate into greater compounded annual growth of Fee Related Earnings.
Given the cyclical nature of realized performance fees, earnings from our Principal Investing segment, or PII, are inherently more volatile in nature than earnings from the Asset Management and Retirement Services segments. We earn fees based on the investment performance of the funds, partnerships and accounts we manage and compensate our employees, primarily investment professionals, with a meaningful portion of these proceeds to align our team with investors whose capital we manage and incentivize them to deliver strong investment performance over time. To enhance this alignment, we have increased the proportion of performance fee income we pay to our employees over time.
72
The diagram below depicts our current organizational structure:
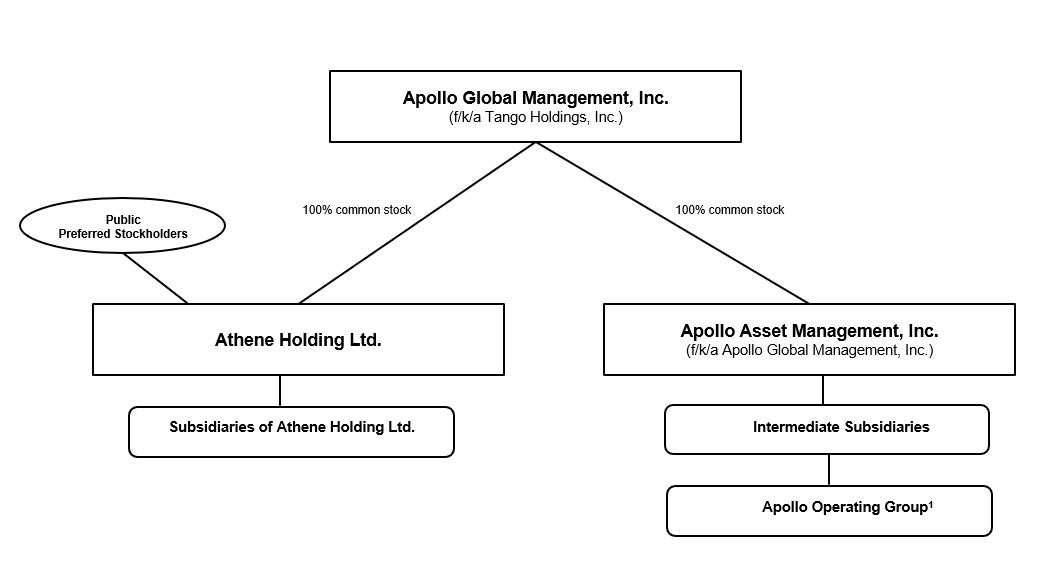
Note: The organizational structure chart above depicts a simplified version of the Apollo structure. It does not include all legal entities in the structure.
(1)Includes direct and indirect ownership by AGM.
Business Environment
Economic and Market Conditions
Our asset management and retirement services businesses are affected by the condition of global financial markets and the economy. Price fluctuations within equity, credit, commodity and foreign exchange markets, as well as interest rates and global inflation, which may be volatile and mixed across geographies, can significantly impact the performance of our business, including, but not limited to, the valuation of investments, including those of the funds we manage, and related income we may recognize.
Adverse economic conditions may result from domestic and global economic and political developments, including plateauing or decreasing economic growth and business activity, changes to U.S. and foreign tariff policies, civil unrest, geopolitical tensions or military action, such as the armed conflicts in the Middle East and between Ukraine and Russia, and corresponding sanctions imposed on Russia by the U.S. and other countries, and new or evolving legal and regulatory requirements on business investment, hiring, migration, labor supply and global supply chains.
The ongoing uncertainty regarding trade policy poses a downside risk to the current economic outlook, with lower growth and higher inflationary pressures increasing the risk of a stagflationary environment. Tariffs, which are inflationary in nature, remain in place and may have a negative impact on GDP growth. The potential impact of tariffs on corporate earnings remains uncertain and will depend on the duration and outcome of related trade negotiations.
We carefully monitor economic and market conditions that could potentially give rise to global market volatility and affect our business operations, investment portfolios and derivatives, which include global inflation. U.S. inflation eased slightly in 2025 with the U.S. Bureau of Labor Statistics reporting the annual U.S. inflation rate decreased to 2.7% as of December 31, 2025, compared to 2.9% as of December 31, 2024. The U.S. Federal Reserve has a current benchmark interest rate target range of 3.50% to 3.75%, following a rate cut of 25 basis points at each of its three meetings to end 2025, before holding rates constant at its January 2026 meeting.
73
Equity market performance was strong in 2025. In the U.S., the S&P 500 Index increased by 16.4% in 2025, following an increase of 23.3% in 2024. Global equity markets also increased in 2025, with the MSCI All Country World ex USA Index increasing by 32.6%, following an increase of 5.3% in 2024.
Conditions in the credit markets also have a significant impact on our business. Credit markets were positive in 2025, with the BofAML HY Master II Index increasing by 8.5%, while the Morningstar/LSTA Leveraged Loan Index increased by 7.2%.
In terms of economic conditions in the U.S., the Bureau of Economic Analysis reported real GDP increased at an annual rate of 2.2% in 2025, following an increase of 2.8% in 2024. As of January 2026, the International Monetary Fund estimated the U.S. economy will expand by 2.4% in 2026 and 2.0% in 2027. The U.S. Bureau of Labor Statistics reported the U.S. unemployment rate increased to 4.4% as of December 31, 2025, compared to 4.1% as of December 31, 2024.
Foreign exchange rates can materially impact the valuations of our investments and those of the funds we manage that are denominated in currencies other than the U.S. dollar. The U.S. dollar weakened in 2025 compared to the euro and the British pound. Relative to the U.S. dollar, the euro appreciated 13.4% in 2025, after depreciating 6.2% in 2024, while the British pound appreciated 7.7% in 2025, after depreciating 1.7% in 2024. Oil finished 2025 down 19.9% from 2024.
We are actively monitoring the developments in Ukraine resulting from the Russia/Ukraine conflict and the economic sanctions and restrictions imposed against Russia, Belarus, and certain Russian and Belarussian entities and individuals. The Company continues to (i) identify and assess any exposure to designated persons or entities across the Company’s business; (ii) ensure existing surveillance and controls are calibrated to the evolving sanctions; and (iii) ensure appropriate levels of communication across the Company, and with other relevant market participants, as appropriate.
As of December 31, 2025, the funds we manage have no investments that would cause Apollo or any Apollo managed fund to be in violation of current international sanctions, and we believe the direct exposure of investment portfolios of the funds we manage to Russia and Ukraine is insignificant. The Company and the funds we manage do not intend to make any new material investments in Russia, and have appropriate controls in place to ensure review of any new exposure.
Institutional investors continue to allocate capital towards alternative investment managers in search of more attractive returns, and we believe the business environment remains generally accommodative to raise larger successor funds, launch new products, and pursue attractive strategic growth opportunities.
Interest Rate Environment
Medium and long-term rates decreased in 2025, with the U.S. 10-year Treasury yield at 4.18% as of December 31, 2025, compared to 4.58% as of December 31, 2024. Short-term rates decreased in 2025, with the 3-month secured overnight financing rate at 3.65% as of December 31, 2025 compared to 4.31% as of December 31, 2024.
With respect to Retirement Services, Athene’s investment portfolio predominantly consists of fixed maturity investments. If prevailing interest rates were to rise, we believe the yield on Athene’s new investment purchases may also rise and its investment income from floating rate investments would increase, while the value of its existing investments may decline. If prevailing interest rates were to decline significantly, the yield on Athene’s new investment purchases may decline and its investment income from floating rate investments would decrease, while the value of its existing investments may increase.
Athene addresses interest rate risk through managing the duration of the liabilities it sources with assets it acquires through asset liability management (“ALM”) modeling. As part of its investment strategy, Athene purchases floating rate investments, which are expected to perform well in a rising interest rate environment and are expected to underperform in a declining rate environment. Athene manages its interest rate risk in a declining rate environment through hedging activity or the issuance of additional floating rate liabilities to lower its overall net floating rate position. As of December 31, 2025, Athene’s net invested asset portfolio included $48.6 billion of floating rate investments, or 17% of its net invested assets, and its net reserve liabilities included $45.1 billion of floating rate liabilities at notional, or 16% of its net invested assets, resulting in $3.5 billion of net floating rate assets, or 1% of its net invested assets.
74
If prevailing interest rates were to rise, we believe Athene’s products would be more attractive to consumers and its sales would likely increase. If prevailing interest rates were to decline, it is likely that Athene’s products would be less attractive to consumers and its sales would likely decrease. In periods of prolonged low interest rates, the net investment spread may be negatively impacted by reduced investment income to the extent Athene is unable to adequately reduce policyholder crediting rates due to policyholder guarantees in the form of minimum crediting rates or otherwise due to market conditions. A significant majority of Athene’s deferred annuity products have crediting rates that it may reset annually upon renewal, following the expiration of the current guaranteed period. While Athene has the contractual ability to lower these crediting rates to the guaranteed minimum levels at renewal, its willingness to do so may be limited by competitive pressures. Athene’s funding agreements and other investment-type products, the latter of which is comprised of immediate annuities without significant mortality risk (which includes pension group annuities without life contingencies), guaranteed investment contracts and assumed endowments without significant mortality risks, provide little to no discretionary ability to change the rates of interest that determine the amounts payable to the respective policyholder or institution.
See “Part II—Item 7A. Quantitative and Qualitative Disclosures About Market Risk,” which includes a discussion regarding interest rate and other significant risks and our strategies for managing these risks.
Overview of Results of Operations
Financial Measures under U.S. GAAP – Asset Management
The following discussion of financial measures under U.S. GAAP is based on Apollo’s asset management business as of December 31, 2025.
Revenues
Management Fees
The significant growth of the assets we manage has had a positive effect on our revenues. Management fees are typically calculated based upon any of “net asset value,” “gross assets,” “adjusted par asset value,” “adjusted costs of all unrealized portfolio investments,” “capital commitments,” “invested capital,” “adjusted assets,” “capital contributions,” or “stockholders’ equity,” each as defined in the applicable limited partnership agreement and/or management agreement of the unconsolidated funds or accounts.
Advisory and Transaction Fees, Net
As a result of providing advisory services with respect to actual and potential investments, we are entitled to receive fees for transactions related to the acquisition and, in certain instances, disposition and financing of companies, some of which are portfolio companies of the funds we manage, as well as fees for ongoing monitoring of portfolio company operations and directors’ fees. We also receive advisory fees for advisory services provided to certain funds. In addition, monitoring fees are generated on certain structured portfolio company investments. Under the terms of the limited partnership agreements for certain funds, the management fee payable by the funds may be subject to a reduction based on a certain percentage (up to 100%) of such advisory and transaction fees, net of applicable broken deal costs (“Management Fee Offset”). Such amounts are presented as a reduction to advisory and transaction fees, net, in the consolidated statements of operations. See note 2 to our consolidated financial statements for more detail on advisory and transaction fees, net.
Performance Fees
The general partners of the funds we manage are entitled to an incentive return of normally up to 20% of the total returns of a fund’s capital, depending upon performance of the underlying funds and subject to preferred returns and high water marks, as applicable. Performance fees, categorized as performance allocations, are accounted for as an equity method investment, and effectively, the performance fees for any period are based upon an assumed liquidation of the funds’ assets at the reporting date, and distribution of the net proceeds in accordance with the funds’ allocation provisions. Performance fees categorized as incentive fees, which are not accounted for as an equity method investment, are deferred until fees are probable to not be significantly reversed. The majority of performance fees are comprised of performance allocations.
75
As of December 31, 2025, approximately 36% of the value of our funds’ investments on a gross basis was determined using market-based valuation methods (i.e., reliance on broker or listed exchange quotes) and the remaining 64% was determined primarily by comparable company and industry multiples or discounted cash flow models. See “Item 1A. Risk Factors—Risks Relating to Our Asset Management Business—The performance of the funds we manage, and our performance, may be adversely affected by the financial performance of portfolio companies of the funds we manage and the industries in which the funds we manage invest” for discussion regarding certain industry-specific risks that could affect the fair value of certain of the portfolio company investments of the funds we manage.
In certain funds we manage, generally in our equity strategy, the Company does not earn performance fees until the investors have achieved cumulative investment returns on invested capital (including management fees and expenses) in excess of an 8% hurdle rate. Additionally, certain of the credit funds we manage have various performance fee rates and hurdle rates. Certain of the credit funds we manage allocate performance fees to the general partner in a similar manner as the equity funds. In certain funds we manage, as long as the investors achieve their priority returns, there is a catch-up formula whereby the Company earns a priority return for a portion of the return until the Company’s performance fees equate to its performance fee rate for that fund; thereafter, the Company participates in returns from the fund at the performance fee rate. Performance fees, categorized as performance allocations, are subject to reversal to the extent that the performance fees distributed exceed the amount due to the general partner based on a fund’s cumulative investment returns. The Company recognizes potential repayment of previously received performance fees as a general partner obligation representing all amounts previously distributed to the general partner that would need to be repaid to the Apollo funds if these funds were to be liquidated based on the current fair value of the underlying fund’s investments as of the reporting date. The actual general partner obligation, however, would not become payable or realized until the end of a fund’s life or as otherwise set forth in the respective limited partnership agreement of the fund.
76
The table below presents an analysis of Apollo’s (i) performance fees receivable on an unconsolidated basis, (ii) unrealized performance fees and (iii) realized performance fees, inclusive of realized incentive fees:
| As of December 31, | Performance Fees for the Year Ended December 31, 2025 | Performance Fees for the Year Ended December 31, 2024 | Performance Fees for the Year Ended December 31, 2023 | ||||||||||||||||||||||||||||||||||||||||||||||||||||||||||||||
| 2025 | 2024 | ||||||||||||||||||||||||||||||||||||||||||||||||||||||||||||||||
| (In millions) | Performance Fees Receivable on an Unconsolidated Basis | Unrealized | Realized | Total | Unrealized | Realized | Total | Unrealized | Realized | Total | |||||||||||||||||||||||||||||||||||||||||||||||||||||||
| Accord and Accord+ Funds | $ | 139 | $ | 93 | $ | (28) | $ | 103 | $ | 75 | $ | 34 | $ | 20 | $ | 54 | $ | 59 | $ | — | $ | 59 | |||||||||||||||||||||||||||||||||||||||||||
| AIOF I, II and III | 50 | 57 | (7) | 23 | 16 | 39 | — | 39 | 8 | 5 | 13 | ||||||||||||||||||||||||||||||||||||||||||||||||||||||
ANRP I, II and III1 | 53 | 48 | 6 | 19 | 25 | 36 | 25 | 61 | (12) | 2 | (10) | ||||||||||||||||||||||||||||||||||||||||||||||||||||||
| Athora | 22 | 84 | (63) | — | (63) | (15) | — | (15) | (18) | — | (18) | ||||||||||||||||||||||||||||||||||||||||||||||||||||||
| Credit Strategies | 126 | 113 | 1 | 125 | 126 | 1 | 112 | 113 | 4 | 83 | 87 | ||||||||||||||||||||||||||||||||||||||||||||||||||||||
EPF Funds1 | 32 | 21 | 17 | 6 | 23 | — | 19 | 19 | (121) | 34 | (87) | ||||||||||||||||||||||||||||||||||||||||||||||||||||||
| FCI Funds | 90 | 109 | (19) | — | (19) | 23 | — | 23 | 10 | — | 10 | ||||||||||||||||||||||||||||||||||||||||||||||||||||||
| Freedom Parent Holdings | 77 | 40 | (10) | 77 | 67 | (53) | 117 | 64 | 63 | — | 63 | ||||||||||||||||||||||||||||||||||||||||||||||||||||||
| Fund X | 480 | 199 | 281 | 143 | 424 | 198 | — | 198 | 1 | — | 1 | ||||||||||||||||||||||||||||||||||||||||||||||||||||||
| Fund IX | 1,134 | 1,597 | (463) | 382 | (81) | (117) | 419 | 302 | 453 | 288 | 741 | ||||||||||||||||||||||||||||||||||||||||||||||||||||||
Fund VIII2 | — | 23 | (20) | 6 | (14) | (158) | 4 | (154) | (259) | 118 | (141) | ||||||||||||||||||||||||||||||||||||||||||||||||||||||
| Fund VII | — | — | — | — | — | (26) | 27 | 1 | (13) | 18 | 5 | ||||||||||||||||||||||||||||||||||||||||||||||||||||||
| Fund VI | 39 | 31 | — | 8 | 8 | — | 9 | 9 | (3) | 8 | 5 | ||||||||||||||||||||||||||||||||||||||||||||||||||||||
Fund IV and Fund V1 | — | — | — | — | — | — | — | — | 30 | (30) | — | ||||||||||||||||||||||||||||||||||||||||||||||||||||||
| HVF I | 81 | 60 | 21 | 4 | 25 | 15 | 9 | 24 | 1 | 41 | 42 | ||||||||||||||||||||||||||||||||||||||||||||||||||||||
| HVF II | 190 | 168 | 22 | 111 | 133 | 168 | — | 168 | — | — | — | ||||||||||||||||||||||||||||||||||||||||||||||||||||||
| MidCap FinCo | 38 | 43 | — | 24 | 24 | 5 | 38 | 43 | (143) | 57 | (86) | ||||||||||||||||||||||||||||||||||||||||||||||||||||||
Redding Ridge Holdings | 214 | 164 | 50 | 35 | 85 | 45 | 35 | 80 | 27 | 34 | 61 | ||||||||||||||||||||||||||||||||||||||||||||||||||||||
| Bridge Funds | 148 | — | (30) | 9 | (21) | — | — | — | — | — | — | ||||||||||||||||||||||||||||||||||||||||||||||||||||||
Other1,3 | 857 | 617 | 173 | 389 | 562 | 69 | 294 | 363 | 31 | 230 | 261 | ||||||||||||||||||||||||||||||||||||||||||||||||||||||
| Total | $ | 3,770 | $ | 3,467 | $ | (69) | $ | 1,464 | $ | 1,395 | $ | 264 | $ | 1,128 | $ | 1,392 | $ | 118 | $ | 888 | $ | 1,006 | |||||||||||||||||||||||||||||||||||||||||||
Total, net of profit sharing payable4/expense | $ | 1,840 | $ | 1,684 | $ | (30) | $ | 630 | $ | 600 | $ | 118 | $ | 516 | $ | 634 | $ | (54) | $ | 335 | $ | 281 | |||||||||||||||||||||||||||||||||||||||||||
1 As of December 31, 2025, certain funds had $212 million in general partner obligations to return previously distributed performance fees. The fair value gain on investments and income at the fund level needed to reverse the general partner obligations was $2.2 billion as of December 31, 2025. | |||||||||||||||||||||||||||||||||||||||||||||||||||||||||||||||||
2 As of December 31, 2025, the remaining investments and escrow cash of Fund VIII was valued at 87% of the fund’s unreturned capital, which was below the required escrow ratio of 115%. As a result, the fund is required to place in escrow current and future performance fee distributions to the general partner until the specified return ratio of 115% is met (at the time of a future distribution) or upon liquidation. As of December 31, 2025, Fund VIII had $138 million of gross performance fees, or $76 million net of profit sharing in escrow. With respect to Fund VIII, realized performance fees currently distributed to the general partner are limited to potential tax distributions and interest on escrow balances per the fund’s partnership agreement. Performance fees receivable as of December 31, 2025 and realized performance fees for the year ended December 31, 2025 include interest earned on escrow balances that is not subject to contingent repayment. | |||||||||||||||||||||||||||||||||||||||||||||||||||||||||||||||||
3 Other includes certain SIAs. | |||||||||||||||||||||||||||||||||||||||||||||||||||||||||||||||||
4 There was a corresponding profit sharing payable of $1.9 billion as of December 31, 2025, including profit sharing payable related to amounts in escrow and contingent consideration obligations of $72 million. | |||||||||||||||||||||||||||||||||||||||||||||||||||||||||||||||||
The general partners of certain of the funds we manage accrue performance fees, categorized as performance allocations, when the fair value of investments exceeds the cost basis of the individual investors’ investments in the fund, including any allocable share of expenses incurred in connection with such investments, which we refer to as “high water marks.” These high water marks are applied on an individual investor basis. Certain of the funds we manage have investors with various high water marks, the achievement of which is subject to market conditions and investment performance.
Performance fees from certain funds we manage are subject to contingent repayment by the general partner in the event of future losses to the extent that the cumulative performance fees distributed from inception to date exceeds the amount computed as due to the general partner at the final distribution. These general partner obligations, if applicable, are included in due to related parties on the consolidated statements of financial condition.
77
The following table summarizes our performance fees since inception through December 31, 2025:
Performance Fees Since Inception1 | |||||||||||||||||||||||||||||
| (In millions) | Undistributed by Fund and Recognized | Distributed by Fund and Recognized2 | Total Undistributed and Distributed by Fund and Recognized3 | General Partner Obligation3 | Maximum Performance Fees Subject to Potential Reversal4 | ||||||||||||||||||||||||
| Accord and Accord+ Funds | $ | 139 | $ | 75 | $ | 214 | $ | — | $ | 115 | |||||||||||||||||||
| AIOF I, II and III | 50 | 86 | 136 | — | 66 | ||||||||||||||||||||||||
| ANRP I, II and III | 53 | 206 | 259 | 10 | 113 | ||||||||||||||||||||||||
| Athora | 22 | — | 22 | — | 22 | ||||||||||||||||||||||||
| Credit Strategies | 126 | 486 | 612 | — | 124 | ||||||||||||||||||||||||
| EPF Funds | 32 | 577 | 609 | 111 | 45 | ||||||||||||||||||||||||
| FCI Funds | 90 | 24 | 114 | — | 90 | ||||||||||||||||||||||||
| Freedom Parent Holdings | 77 | 117 | 194 | — | — | ||||||||||||||||||||||||
| Fund X | 480 | 143 | 623 | — | 561 | ||||||||||||||||||||||||
| Fund IX | 1,134 | 1,680 | 2,814 | — | 1,982 | ||||||||||||||||||||||||
| Fund VIII | — | 1,789 | 1,789 | 68 | 1,168 | ||||||||||||||||||||||||
| Fund VII | — | 3,271 | 3,271 | — | — | ||||||||||||||||||||||||
| Fund VI | 39 | 1,664 | 1,703 | — | — | ||||||||||||||||||||||||
| Fund IV and Fund V | — | 2,023 | 2,023 | 1 | — | ||||||||||||||||||||||||
| HVF I | 81 | 256 | 337 | — | 206 | ||||||||||||||||||||||||
| HVF II | 190 | 111 | 301 | — | 239 | ||||||||||||||||||||||||
| MidCap FinCo | 38 | 166 | 204 | — | 38 | ||||||||||||||||||||||||
| Redding Ridge Holdings | 214 | — | 214 | — | 179 | ||||||||||||||||||||||||
| Bridge Funds | 148 | 8 | 156 | — | 59 | ||||||||||||||||||||||||
Other5 | 857 | 2,799 | 3,656 | 22 | 977 | ||||||||||||||||||||||||
| Total | $ | 3,770 | $ | 15,481 | $ | 19,251 | $ | 212 | $ | 5,984 | |||||||||||||||||||
1 Certain funds are denominated in euros and historical figures are translated into U.S. dollars at an exchange rate of €1.00 to $1.17 as of December 31, 2025. Certain funds are denominated in pounds sterling and historical figures are translated into U.S. dollars at an exchange rate of £1.00 to $1.35 as of December 31, 2025. | |||||||||||||||||||||||||||||
2 Amounts exclude certain performance fees from business development companies and Redding Ridge Holdings, an affiliate of Redding Ridge. | |||||||||||||||||||||||||||||
3 Amounts were computed based on the fair value of fund investments on December 31, 2025. Performance fees have been allocated to and recognized by the general partner. Based on the amount allocated, a portion is subject to potential reversal or, to the extent applicable, has been reduced by the general partner obligation to return previously distributed performance fees at December 31, 2025. The actual determination and any required payment of any such general partner obligation would not take place until the final disposition of the fund’s investments based on contractual termination of the fund. | |||||||||||||||||||||||||||||
4 Represents the amount of performance fees that would be reversed if remaining fund investments became worthless on December 31, 2025. Amounts subject to potential reversal of performance fees include amounts undistributed by a fund (i.e., the performance fees receivable), as well as a portion of the amounts that have been distributed by a fund, net of taxes and not subject to a general partner obligation to return previously distributed performance fees, except for those funds that are gross of taxes as defined in the respective funds’ governing documents. | |||||||||||||||||||||||||||||
5 Other includes certain SIAs. | |||||||||||||||||||||||||||||
Property Management, Development and Other Fees
Apollo provides property management services through Bridge. Apollo earns property management fees over time as the related services are provided under the terms of the respective property management agreements. Apollo also earns leasing commission revenue associated with the leasing of commercial assets, which is recognized upon the execution of the applicable lease agreements, and records development fees as the services are provided under the terms of the applicable development agreements. Other fees are primarily composed of interest on catch-up management fees, fees related to accounting, in-house legal and tax professional services.
78
Expenses
Compensation and Benefits
The most significant expense in our asset management business is compensation and benefits expense. This consists of fixed salary, discretionary and non-discretionary bonuses, profit sharing expense associated with the performance fees earned and compensation expense associated with the vesting of non-cash equity-based awards.
Our compensation arrangements with certain employees contain a significant performance-based incentive component. Therefore, as our net revenues increase, our compensation costs rise. Our compensation costs also reflect the increased investment in people as we expand geographically and create new funds.
In addition, certain professionals and selected other individuals have a profit sharing interest in the performance fees earned in order to better align their interests with our own and with those of the investors in the funds we manage. Profit sharing expense is part of our compensation and benefits expense and is generally based upon a fixed percentage of performance fees. Certain of our performance-based incentive arrangements provide for compensation based on realized performance fees which includes fees earned by the general partners of the funds we manage under the applicable fund limited partnership agreements based upon transactions that have closed or other rights to incentive income cash that have become fixed in the applicable calendar year period. Profit sharing expense can reverse during periods when there is a decline in performance fees that were previously recognized. Profit sharing amounts are normally distributed to employees after the corresponding investment gains have been realized. Therefore, changes in our unrealized performance fees have the same effect on our profit sharing expense. Profit sharing expense increases when unrealized performance fees increase. Realizations only impact profit sharing expense to the extent that the effects on investments have not been recognized previously. If losses on other investments within a fund are subsequently realized, the profit sharing amounts previously distributed are normally subject to a general partner obligation to return performance fees previously distributed back to the funds. This general partner obligation due to the funds would generally be realized only when the fund is liquidated, which generally occurs at the end of the fund’s term. However, indemnification obligations also exist for realized gains with respect to certain funds, which, although our Former Managing Partners and Contributing Partners would remain personally liable, may indemnify our Former Managing Partners and Contributing Partners for 17.5% to 100% of the previously distributed profits regardless of the fund’s future performance. See note 18 to our consolidated financial statements for further information regarding the Company’s indemnification liability.
The Company grants equity awards to certain employees, including RSUs and restricted shares of common stock, that generally vest and become exercisable in quarterly installments or annual installments depending on the award terms. In some instances, vesting of an RSU is also subject to the Company’s receipt of performance fees, within prescribed periods, sufficient to cover the associated equity-based compensation expense. See note 15 to our consolidated financial statements for further discussion of equity-based compensation.
Other expenses
The balance of our other expenses includes interest, placement fees, and general, administrative and other operating expenses. Interest expense consists primarily of interest related to the senior and subordinated notes as discussed in note 14 to our consolidated financial statements. Placement fees are incurred in connection with our capital raising activities. In cases where the limited partners of the funds are determined to be the customer in an arrangement, placement fees may be capitalized as a cost to acquire a customer contract, and amortized over the life of the customer contract. General, administrative and other expenses includes occupancy expense, depreciation and amortization, professional fees and costs related to travel, information technology and administration. Occupancy expense represents charges related to office leases and associated expenses, such as utilities and maintenance fees. Depreciation and amortization of fixed assets is normally calculated using the straight-line method over their estimated useful lives, ranging from two to sixteen years, taking into consideration any residual value. Leasehold improvements are amortized over the shorter of the useful life of the asset or the expected term of the lease. Intangible assets are amortized based on the future cash flows over the expected useful lives of the assets.
79
Other Income (Loss)
Net Gains (Losses) from Investment Activities
Net gains (losses) from investment activities include both realized gains and losses and the change in unrealized gains and losses in our investment portfolio between the opening reporting date and the closing reporting date. Net unrealized gains (losses) are a result of changes in the fair value of unrealized investments and reversal of unrealized gains (losses) due to dispositions of investments during the reporting period. Significant judgment and estimation goes into the assumptions that drive these models and the actual values realized with respect to investments could be materially different from values obtained based on the use of those models. The valuation methodologies applied impact the reported value of investment company holdings and their underlying portfolios in our consolidated financial statements.
Net Gains (Losses) from Investment Activities of Consolidated Variable Interest Entities (“VIEs”)
Changes in the fair value of the consolidated VIEs’ assets and liabilities and related interest, dividend and other income and expenses subsequent to consolidation are presented within net gains (losses) from investment activities of consolidated variable interest entities and are attributable to non-controlling interests in the consolidated statements of operations.
Other Income (Losses), Net
Other income (losses), net includes interest income, gains (losses) arising from the remeasurement of foreign currency denominated assets and liabilities, remeasurement of the tax receivable agreement liability and other miscellaneous non-operating income and expenses.
Financial Measures under U.S. GAAP – Retirement Services
The following discussion of financial measures under U.S. GAAP is based on the Company’s retirement services business, which is operated by Athene, as of December 31, 2025.
Revenues
Premiums
Premiums for long-duration contracts, including products with fixed and guaranteed premiums and benefits, are recognized as revenue when due from policyholders. Insurance revenues are reported net of reinsurance ceded.
Product charges
Revenues for universal life-type policies and investment contracts, including surrender and market value adjustments, costs of insurance, policy administration, GMDB, GLWB and no-lapse guarantee charges, are earned when assessed against policyholder account balances during the period.
Net investment income
Net investment income is a significant component of Athene’s total revenues. Athene recognizes investment income as it accrues or is legally due, net of investment management and custody fees. Investment income on fixed maturity securities includes coupon interest, as well as the amortization of any premium and the accretion of any discount. Investment income on equity securities represents dividend income and preferred coupon interest.
Investment related gains (losses)
Investment related gains (losses) primarily consist of (i) realized gains and losses on sales of investments, (ii) unrealized gains or losses relating to identified risks within AFS securities in fair value hedging relationships, (iii) gains and losses on trading securities, (iv) gains and losses on equity securities, (v) changes in the fair value of the embedded derivatives and derivatives not designated as a hedge, (vi) changes in the fair value of mortgage loan assets, (vii) foreign exchange gains and losses and (viii) changes in the provision for credit losses.
80
Expenses
Interest sensitive contract benefits
Interest sensitive contract liabilities are typically associated with universal life-type policies and investment contracts. Universal life-type policies and investment contracts include traditional deferred annuities; indexed annuities consisting of fixed indexed, index-linked variable annuities in the accumulation phase, and assumed indexed universal life without significant mortality risk; funding agreements; immediate annuities without significant mortality risk (which include pension group annuities and structured settlements without life contingencies); universal life insurance; and other investment contracts inclusive of guaranteed investment contracts and assumed endowments without significant mortality risk. Liabilities for traditional deferred annuities, indexed annuities and universal life insurance are carried at the account balances without reduction for potential surrender or withdrawal charges, except for a block of universal life business ceded to Global Atlantic Financial Group Limited (together with its subsidiaries, “Global Atlantic”), which is carried at fair value. Fixed indexed annuity, index-linked variable annuity and indexed universal life insurance contracts contain an embedded derivative. Benefit reserves for these contracts are reported as the sum of the fair value of the embedded derivative and the host (or guaranteed) component of the contracts. The fair value of the embedded derivatives represents the present value of cash flows attributable to the indexed strategies. The host contract is established at contract inception as the initial account value less the initial fair value of the embedded derivative and accreted over the policy’s life. Liabilities for immediate annuities without significant mortality risk (which include pension group annuities and structured settlements without life contingencies), funding agreements, assumed endowments without significant mortality risk and guaranteed investment contracts are calculated as the present value of future liability cash flows and policy maintenance expenses, if any, discounted at contractual interest rates. Certain contracts are offered with additional contract features that meet the definition of a market risk benefit. See “—Market risk benefits remeasurement (gains) losses” below for further information.
Changes in interest sensitive contract liabilities, excluding deposits and withdrawals, are recorded in interest sensitive contract benefits or product charges on the consolidated statements of operations.
Future policy and other policy benefits
Athene issues or reinsures contracts classified as long-duration, which include term and whole life, accident and health, disability, and deferred and immediate annuities with life contingencies (which include pension group annuities and structured settlements with life contingencies).
Liabilities for nonparticipating long-duration contracts are established as the estimated present value of benefits Athene expects to pay to or on behalf of the policyholder and related expenses less the present value of the net premiums to be collected, referred to as the net premium ratio. Liabilities for nonparticipating long-duration contracts are established using accepted actuarial valuation methods, which require the use of assumptions related to discount rate, expenses, longevity, mortality, morbidity, persistency and other policyholder behavior. The liability for nonparticipating long-duration contracts is discounted using an upper-medium grade fixed income instrument yield aligned to the characteristics of the liability, including the duration and currency of the underlying cash flows.
Changes in the value of the liability for nonparticipating long-duration contracts due to changes in the discount rate are recognized as a component of OCI on the consolidated statements of comprehensive income (loss). Changes in the liability for remeasurement gains or losses and all other changes in the liability are recorded in future policy and other policy benefits on the consolidated statements of operations.
Future policy benefits include liabilities for no-lapse guarantees on universal life insurance and fixed indexed universal life insurance. Each reporting period, expected excess benefits and assessments are updated with actual excess benefits and assessments. Athene also periodically revises the key assumptions used in the calculation of the liabilities that result in revisions to the expected excess benefits and assessments. The effects of changes in assumptions are recorded as unlocking in the period in which the changes are made. Changes in the liabilities associated with no-lapse guarantees are recorded in future policy and other policy benefits on the consolidated statements of operations.
81
Market risk benefits remeasurement (gains) losses
Market risk benefits represent contracts or contract features that both provide protection to the contract holder from, and expose the insurance entity to, other-than-nominal capital market risk. Athene’s deferred annuity contracts contain GLWB and GMDB riders that meet the criteria for, and are classified as, market risk benefits.
Market risk benefits are measured at fair value at the contract level and may be recorded as a liability or an asset, which are included in market risk benefits or other assets, respectively, on the consolidated statements of financial condition. Fees and assessments collectible from the policyholder at contract inception are allocated to the extent they are attributable to the market risk benefit. If the fees are sufficient to cover the projected benefits, a non-option based valuation model is used. If the fees are insufficient to cover the projected benefits, an option-based valuation model is used to compute the market risk benefit liability at contract inception, with an equal and offsetting adjustment recognized in interest sensitive contract liabilities.
Changes in fair value of market risk benefits are recorded in market risk benefits remeasurement (gains) losses on the consolidated statements of operations, excluding portions attributed to changes in instrument-specific credit risk, which are recorded in OCI on the consolidated statements of comprehensive income (loss). Ceded market risk benefits are measured at fair value and recorded within reinsurance recoverable on the consolidated statements of financial condition.
Amortization of deferred acquisition costs, deferred sales inducements, and value of business acquired
Costs related directly to the successful acquisition of new, or the renewal of existing, insurance or investment contracts are deferred. These costs consist of commissions and policy issuance costs, as well as sales inducements credited to policyholder account balances, and are included in deferred acquisition costs, deferred sales inducements and value of business acquired on the consolidated statements of financial condition.
Deferred costs related to universal life-type policies and investment contracts with significant revenue streams from sources other than investment of the policyholder funds are grouped into cohorts based on issue year and contract type and amortized on a constant level basis over the expected term of the related contracts. The cohorts and assumptions used for the amortization of deferred costs are consistent with those used in estimating the related liabilities for these contracts. Deferred costs related to investment contracts without significant revenue streams from sources other than investment of the policyholder funds are amortized using the effective interest method. The effective interest method amortizes the deferred costs by discounting the future liability cash flows at a break-even rate. The break-even rate is solved for such that the present value of future liability cash flows is equal to the net liability at the inception of the contract. VOBA associated with acquired contracts can be either positive or negative and is amortized in relation to respective policyholder liabilities. Significant assumptions that impact VOBA amortization are consistent with those that impact the measurement of policyholder liabilities.
Amortization of DAC, DSI and VOBA is included in amortization of deferred acquisition costs, deferred sales inducements and value of business acquired on the consolidated statements of operations.
Policy and other operating expenses
Policy and other operating expenses include normal operating expenses, policy acquisition expenses, interest expense, dividends to policyholders, integration, restructuring and other non-operating expenses and stock compensation expenses.
Other Financial Measures under U.S. GAAP
Income Taxes
Significant judgment is required in determining the provision for income taxes and in evaluating income tax positions, including evaluating uncertainties. We recognize the income tax benefits of uncertain tax positions only where the position is “more likely than not” to be sustained upon examination, including resolution of any related appeals or litigation, based on the technical merits of the positions. The tax benefit is measured as the largest amount of benefit that has a greater than 50% likelihood of being realized upon ultimate settlement. If a tax position is not considered more likely than not to be sustained, then no benefits of the position are recognized. The Company’s income tax positions are reviewed and evaluated quarterly to determine whether or not we have uncertain tax positions that require financial statement recognition or de-recognition.
82
Deferred tax assets and liabilities are recognized for the expected future tax consequences, using currently enacted tax rates, of differences between the carrying amount of assets and liabilities and their respective tax basis. The effect on deferred tax assets and liabilities of a change in tax rates is recognized in income in the period when the change is enacted. Deferred tax assets are reduced by a valuation allowance when it is more likely than not that some portion or all of the deferred tax assets will not be realized.
Non-Controlling Interests
For entities that are consolidated, but not 100% owned, a portion of the income or loss and corresponding equity is allocated to owners other than Apollo. The aggregate of the income or loss and corresponding equity that is not owned by the Company is included in non-controlling interests in the consolidated financial statements. Non-controlling interests primarily include limited partner interests in certain consolidated funds and VIEs.
The authoritative guidance for non-controlling interests in the consolidated financial statements requires reporting entities to present non-controlling interest as equity and provides guidance on the accounting for transactions between an entity and non-controlling interests. According to the guidance, (1) non-controlling interests are presented as a separate component of stockholders’ equity on the Company’s consolidated statements of financial condition, (2) net income (loss) includes the net income (loss) attributable to the non-controlling interest holders on the Company’s consolidated statements of operations, and (3) profits and losses are allocated to non-controlling interests in proportion to their ownership interests regardless of their basis.
Managing Business Performance – Key Segment and Non-U.S. GAAP Performance Measures
We believe that the presentation of Segment Income supplements a reader’s understanding of the economic operating performance of each of our segments.
Segment Income and Adjusted Net Income
Segment Income is the key performance measure used by management in evaluating the performance of the Asset Management, Retirement Services, and Principal Investing segments. See note 21 to the consolidated financial statements for more details regarding the components of Segment Income and management’s consideration of Segment Income.
We believe that Segment Income is helpful for an understanding of our business and that investors should review the same supplemental financial measure that management uses to analyze our segment performance. This measure supplements and should be considered in addition to and not in lieu of the results of operations discussed above in “—Overview of Results of Operations” that have been prepared in accordance with U.S. GAAP.
Adjusted Net Income (“ANI”) represents Segment Income less HoldCo interest and other financing costs and estimated income taxes. For purposes of calculating the Adjusted Net Income tax rate, Segment Income is reduced by HoldCo interest and financing costs. Income taxes on FRE and PII represents the total current corporate, local, and non-U.S. taxes as well as the current payable under Apollo’s tax receivable agreement. Income taxes on FRE and PII excludes the impacts of deferred taxes and the remeasurement of the tax receivable agreement, which arise from changes in estimated future tax rates. Certain assumptions and methodologies that impact the implied FRE and PII income tax provision are similar to those used under U.S. GAAP. Specifically, certain deductions considered in the income tax provision under U.S. GAAP relating to transaction-related costs, equity-based compensation, charitable contributions and tax deductible interest expense are taken into account for the implied tax provision. Income Taxes on SRE represent the total current and deferred tax expense or benefit on income before taxes adjusted to eliminate the impact of the tax expense or benefit associated with the non-operating adjustments. Management believes the methodologies used to compute income taxes on FRE, SRE, and PII are meaningful to each segment and increases comparability of income taxes between periods.
83
Fee Related Earnings, Spread Related Earnings and Principal Investing Income
Fee Related Earnings, or “FRE”, is a component of Segment Income that is used to assess the performance of the Asset Management segment.
Spread Related Earnings, or “SRE”, is a component of Segment Income that is used to assess the performance of the Retirement Services segment, excluding certain market volatility, which consists of investment gains (losses), net of offsets and non-operating change in insurance liabilities and related derivatives, and certain expenses related to integration, restructuring, and equity-based compensation, as well as other items.
Non-operating change in insurance liabilities and related derivatives includes the change in fair values of derivatives and embedded derivatives, non-operating change in funding agreements, change in fair value of market risk benefits, and non-operating change in liability for future policy benefits.
Principal Investing Income, or “PII”, is a component of Segment Income that is used to assess the performance of the Principal Investing segment.
See note 21 to the consolidated financial statements for more details regarding the components of FRE, SRE, and PII.
We use Segment Income, ANI, FRE, SRE and PII as measures of operating performance, not as measures of liquidity. These measures should not be considered in isolation or as a substitute for net income or other income data prepared in accordance with U.S. GAAP. The use of these measures without consideration of their related U.S. GAAP measures is not adequate due to the adjustments described above.
Net Invested Assets
In managing its business, Athene analyzes net invested assets, which does not correspond to total Athene investments, including investments in related parties, as disclosed in the consolidated statements of financial condition and notes thereto. Net invested assets represent the investments that directly back Athene’s net reserve liabilities, as well as surplus assets. Net invested assets is used in the computation of net investment earned rate, which is used to analyze the profitability of Athene’s investment portfolio. Net invested assets include (a) total investments on the consolidated statements of financial condition with AFS securities, trading securities and mortgage loans at cost or amortized cost, excluding derivatives, (b) cash and cash equivalents and restricted cash, (c) investments in related parties, (d) accrued investment income, (e) VIE and VOE assets, liabilities and non-controlling interest adjustments, (f) net investment payables and receivables, (g) policy loans ceded (which offset the direct policy loans in total investments) and (h) an adjustment for the allowance for credit losses. Net invested assets exclude the derivative collateral offsetting the related cash positions. Athene includes the underlying investments supporting its assumed funds withheld and modco agreements and excludes the underlying investments related to ceded reinsurance transactions in its net invested assets calculation in order to match the assets with the income received. Athene believes the adjustments for reinsurance provide a view of the assets for which it has economic exposure. Net invested assets include Athene’s proportionate share of ACRA investments, based on its economic ownership, but do not include the proportionate share of investments associated with the non-controlling interests. Net invested assets are averaged over the number of quarters in the relevant period to compute a net investment earned rate for such period. While Athene believes net invested assets is a meaningful financial metric and enhances the understanding of the underlying drivers of its investment portfolio, it should not be used as a substitute for Athene’s total investments, including related parties, presented under U.S. GAAP.
84
Results of Operations
Below is a discussion of our consolidated statements of operations for the years ended December 31, 2025, 2024 and 2023. For additional analysis of the factors that affected our results at the segment level, see “—Segment Analysis” below:
| Years ended December 31, | Total Change | Percentage Change | Years ended December 31, | Total Change | Percentage Change | ||||||||||||||||||||||||||||||||||||||||||
| (In millions, except percentages) | 2025 | 2024 | 2024 | 2023 | |||||||||||||||||||||||||||||||||||||||||||
| Revenues | |||||||||||||||||||||||||||||||||||||||||||||||
| Asset Management | |||||||||||||||||||||||||||||||||||||||||||||||
| Management fees | $ | 2,378 | $ | 1,899 | $ | 479 | 25.2% | $ | 1,899 | $ | 1,772 | $ | 127 | 7.2% | |||||||||||||||||||||||||||||||||
| Advisory and transaction fees, net | 1,202 | 822 | 380 | 46.2 | 822 | 623 | 199 | 31.9 | |||||||||||||||||||||||||||||||||||||||
| Investment income (loss) | 1,143 | 1,305 | (162) | (12.4) | 1,305 | 1,032 | 273 | 26.5 | |||||||||||||||||||||||||||||||||||||||
| Incentive fees | 245 | 150 | 95 | 63.3 | 150 | 80 | 70 | 87.5 | |||||||||||||||||||||||||||||||||||||||
| Property management, development and other fees | 32 | — | 32 | NM | — | — | — | NM | |||||||||||||||||||||||||||||||||||||||
| 5,000 | 4,176 | 824 | 19.7 | 4,176 | 3,507 | 669 | 19.1 | ||||||||||||||||||||||||||||||||||||||||
| Retirement Services | |||||||||||||||||||||||||||||||||||||||||||||||
| Premiums | 2,628 | 1,318 | 1,310 | 99.4 | 1,318 | 12,749 | (11,431) | (89.7) | |||||||||||||||||||||||||||||||||||||||
| Product charges | 1,137 | 1,016 | 121 | 11.9 | 1,016 | 848 | 168 | 19.8 | |||||||||||||||||||||||||||||||||||||||
| Net investment income | 19,245 | 15,718 | 3,527 | 22.4 | 15,718 | 12,080 | 3,638 | 30.1 | |||||||||||||||||||||||||||||||||||||||
| Investment related gains (losses) | 1,544 | 2,045 | (501) | (24.5) | 2,045 | 1,428 | 617 | 43.2 | |||||||||||||||||||||||||||||||||||||||
| Revenues of consolidated variable interest entities | 2,470 | 1,822 | 648 | 35.6 | 1,822 | 1,441 | 381 | 26.4 | |||||||||||||||||||||||||||||||||||||||
| Other revenues | 25 | 19 | 6 | 31.6 | 19 | 591 | (572) | (96.8) | |||||||||||||||||||||||||||||||||||||||
| 27,049 | 21,938 | 5,111 | 23.3 | 21,938 | 29,137 | (7,199) | (24.7) | ||||||||||||||||||||||||||||||||||||||||
| Total Revenues | 32,049 | 26,114 | 5,935 | 22.7 | 26,114 | 32,644 | (6,530) | (20.0) | |||||||||||||||||||||||||||||||||||||||
| Expenses | |||||||||||||||||||||||||||||||||||||||||||||||
| Asset Management | |||||||||||||||||||||||||||||||||||||||||||||||
| Compensation and benefits: | |||||||||||||||||||||||||||||||||||||||||||||||
| Salary, bonus and benefits | 1,443 | 1,140 | 303 | 26.6 | 1,140 | 1,027 | 113 | 11.0 | |||||||||||||||||||||||||||||||||||||||
| Equity-based compensation | 740 | 671 | 69 | 10.3 | 671 | 938 | (267) | (28.5) | |||||||||||||||||||||||||||||||||||||||
| Profit sharing expense | 810 | 797 | 13 | 1.6 | 797 | 757 | 40 | 5.3 | |||||||||||||||||||||||||||||||||||||||
| Total compensation and benefits | 2,993 | 2,608 | 385 | 14.8 | 2,608 | 2,722 | (114) | (4.2) | |||||||||||||||||||||||||||||||||||||||
| Interest expense | 256 | 226 | 30 | 13.3 | 226 | 145 | 81 | 55.9 | |||||||||||||||||||||||||||||||||||||||
| General, administrative and other | 1,546 | 1,170 | 376 | 32.1 | 1,170 | 872 | 298 | 34.2 | |||||||||||||||||||||||||||||||||||||||
| 4,795 | 4,004 | 791 | 19.8 | 4,004 | 3,739 | 265 | 7.1 | ||||||||||||||||||||||||||||||||||||||||
| Retirement Services | |||||||||||||||||||||||||||||||||||||||||||||||
| Interest sensitive contract benefits | 12,089 | 8,949 | 3,140 | 35.1 | 8,949 | 6,229 | 2,720 | 43.7 | |||||||||||||||||||||||||||||||||||||||
| Future policy and other policy benefits | 4,433 | 3,054 | 1,379 | 45.2 | 3,054 | 14,434 | (11,380) | (78.8) | |||||||||||||||||||||||||||||||||||||||
| Market risk benefits remeasurement (gains) losses | 452 | (102) | 554 | NM | (102) | 404 | (506) | NM | |||||||||||||||||||||||||||||||||||||||
| Amortization of deferred acquisition costs, deferred sales inducements and value of business acquired | 1,242 | 941 | 301 | 32.0 | 941 | 688 | 253 | 36.8 | |||||||||||||||||||||||||||||||||||||||
| Policy and other operating expenses | 2,278 | 2,136 | 142 | 6.6 | 2,136 | 1,837 | 299 | 16.3 | |||||||||||||||||||||||||||||||||||||||
| 20,494 | 14,978 | 5,516 | 36.8 | 14,978 | 23,592 | (8,614) | (36.5) | ||||||||||||||||||||||||||||||||||||||||
| Total Expenses | 25,289 | 18,982 | 6,307 | 33.2 | 18,982 | 27,331 | (8,349) | (30.5) | |||||||||||||||||||||||||||||||||||||||
Other income (loss) – Asset Management | |||||||||||||||||||||||||||||||||||||||||||||||
| Net gains (losses) from investment activities | (251) | 58 | (309) | NM | 58 | 7 | 51 | NM | |||||||||||||||||||||||||||||||||||||||
| Net gains (losses) from investment activities of consolidated variable interest entities | 304 | 90 | 214 | 237.8 | 90 | 130 | (40) | (30.8) | |||||||||||||||||||||||||||||||||||||||
| Other income (loss), net | (136) | 155 | (291) | NM | 155 | 136 | 19 | 14.0 | |||||||||||||||||||||||||||||||||||||||
| Total Other income (loss) | (83) | 303 | (386) | NM | 303 | 273 | 30 | 11.0 | |||||||||||||||||||||||||||||||||||||||
| Income (loss) before income tax (provision) benefit | 6,677 | 7,435 | (758) | (10.2) | 7,435 | 5,586 | 1,849 | 33.1 | |||||||||||||||||||||||||||||||||||||||
| Income tax (provision) benefit | (1,276) | (1,062) | (214) | 20.2 | (1,062) | 923 | (1,985) | NM | |||||||||||||||||||||||||||||||||||||||
| Net income (loss) | 5,401 | 6,373 | (972) | (15.3) | 6,373 | 6,509 | (136) | (2.1) | |||||||||||||||||||||||||||||||||||||||
| Net (income) loss attributable to non-controlling interests | (1,909) | (1,796) | (113) | 6.3 | (1,796) | (1,462) | (334) | 22.8 | |||||||||||||||||||||||||||||||||||||||
| Net income (loss) attributable to Apollo Global Management, Inc. | 3,492 | 4,577 | (1,085) | (23.7) | 4,577 | 5,047 | (470) | (9.3) | |||||||||||||||||||||||||||||||||||||||
| Preferred stock dividends | (97) | (97) | — | — | (97) | (46) | (51) | 110.9 | |||||||||||||||||||||||||||||||||||||||
| Net income (loss) available to Apollo Global Management, Inc. common stockholders | $ | 3,395 | $ | 4,480 | $ | (1,085) | (24.2)% | $ | 4,480 | $ | 5,001 | $ | (521) | (10.4)% | |||||||||||||||||||||||||||||||||
Note: “NM” denotes not meaningful. Changes from negative to positive amounts and positive to negative amounts are not considered meaningful. Increases or decreases from zero and changes greater than 500% are also not considered meaningful. | |||||||||||||||||||||||||||||||||||||||||||||||
85
A discussion of our consolidated statements of operations for the year ended December 31, 2024 as compared to the year ended December 31, 2023 is included in the Company’s Annual Report on Form 10-K filed with the SEC on February 24, 2025 (the “2024 Annual Report”).
Year Ended December 31, 2025 Compared to the Year Ended December 31, 2024
In this section, references to 2025 refer to the year ended December 31, 2025 and references to 2024 refer to the year ended December 31, 2024.
Asset Management
Revenues
Revenues were $5.0 billion in 2025, an increase of $824 million from $4.2 billion in 2024, primarily driven by an increase in management fees and advisory and transaction fees, net, and incentive fees, partially offset by a decrease in investment income.
Management fees increased by $479 million to $2.4 billion in 2025 from $1.9 billion in 2024. The increase in management fees was primarily attributable to $342 million of aggregate management fees earned from Atlas, Bridge funds, ADS, S3 Equity and Hybrid Solutions and AIOF III, partially offset by an aggregate decrease of $41 million in management fees earned from Fund IX and Fund VIII. Management fees in 2025 also benefited from increased management fees earned from certain strategic separately managed accounts. The increase in management fees earned from Atlas was driven by higher fee-generating AUM due to an upsize in Atlas warehousing financing facilities. Additionally, management fees increased due to the Bridge acquisition. The increase in management fees earned from ADS was primarily driven by an increase in subscriptions. The increase in management fees earned from S3 Equity and Hybrid Solutions and AIOF III was primarily driven by catch-up management fees on additional closes. The decrease in management fees earned from Fund IX and Fund VIII were correlated with the fee rate step-down of Fund IX and the expiration of Fund VIII’s fee-paying period, respectively.
Advisory and transaction fees increased by $380 million to $1.2 billion in 2025 from $822 million in 2024. Advisory and transaction fees earned during 2025 were primarily attributable to advisory and transaction fees earned from our corporate private equity, direct origination, asset-backed finance, infrastructure and clean transition equity, opportunistic credit and multi-credit strategies.
Incentive fees increased by $95 million to $245 million in 2025 from $150 million in 2024, primarily attributable to sustained growth across a variety of perpetual capital vehicles.
Investment income decreased $162 million in 2025 to $1.1 billion compared to $1.3 billion in 2024. The decrease in investment income in 2025 was primarily driven by a decrease in performance allocations of $165 million.
Significant drivers for performance allocations in 2025 were performance allocations primarily earned from Fund X, HVF II, Credit Strategies, Redding Ridge Holdings, Freedom Parent Holdings and Accord+ II of $424 million, $133 million, $126 million, $85 million, $67 million and $47 million, respectively, partially offset by performance allocation losses from Fund IX and Athora of $81 million and $58 million, respectively.
See below for details on the respective performance allocations in 2025.
The performance allocations earned from Fund X in 2025 were primarily driven by the appreciation and realization of the fund’s investments in the (i) manufacturing and industrial, (ii) consumer services and (iii) consumer and retail sectors.
The performance allocations earned from HVF II in 2025 were primarily driven by the appreciation and realization of the fund’s investments in private portfolio companies in the (i) consumer and retail, (ii) manufacturing and industrial and (iii) transportation and logistics sectors.
The performance allocations earned from Credit Strategies in 2025 were primarily driven by the net income generated by the fund’s investments.
86
The performance allocations earned from Redding Ridge Holdings in 2025 were primarily driven by existing and new CLO issuances, resets, accumulation of warehouse assets, the acquisition of Irradiant Partners LP, new consulting contracts and the net income generated by the vehicle’s strategic investments.
The performance allocations earned from Freedom Parent Holdings in 2025 were primarily driven by the appreciation of its investment in Wheels.
The performance allocations earned from Accord+ II in 2025 were primarily driven by the net income generated by the fund’s investments.
The performance allocation losses from Fund IX in 2025 were primarily driven by the depreciation of the fund’s investments in the (i) media, telecom and technology, (ii) manufacturing and industrial and (iii) leisure sectors.
The performance allocation losses from Athora in 2025 were primarily driven by a reduced profits interest.
Expenses
Expenses were $4.8 billion in 2025, an increase of $791 million from $4.0 billion in 2024 primarily due to increases in total compensation and benefits, general, administrative and other, and interest expense.
Total compensation and benefits were $3.0 billion in 2025, an increase of $385 million from $2.6 billion in 2024, primarily due to an increase in salary, bonus and benefits and equity-based compensation of $303 million and $69 million, respectively. The increase in salary, bonus and benefits of $303 million was primarily driven by the growth in revenues and increased headcount in 2025. The increase in equity-based compensation of $69 million was primarily due to the issuance of restricted stock awards that did not require future service in connection with the Bridge acquisition. Equity-based compensation expense, in any given period, is generally comprised of: (i) performance grants which are tied to the Company’s receipt of performance fees, within prescribed periods and are typically recognized on an accelerated recognition method over the requisite service period to the extent the performance revenue metrics are met or deemed probable, and (ii) the impact of the 2021 one-time grants awarded to the then Co-Presidents of AAM, all of which vest on a cliff basis subject to continued employment over five years, and a portion of which also vest on the Company’s achievement of FRE and SRE per share metrics.
General, administrative and other expenses were $1.5 billion in 2025, an increase of $376 million from $1.2 billion in 2024. The increase in 2025 was primarily driven by increases in professional fees, depreciation and amortization expenses, higher travel and entertainment expenses, placement fees, technology expenses and recruitment fees.
Interest expense was $256 million in 2025, an increase of $30 million from $226 million in 2024. The increase in 2025 was primarily driven by interest from additional debt issuances in 2025, partially offset by debt repayments.
Other Income (Loss)
Other income (loss) was a loss of $83 million in 2025, a decrease of $386 million from income of $303 million in 2024. This decrease was primarily driven by decreases in net gains (losses) from investment activities and other income (loss), net of $309 million and $291 million, respectively, partially offset by an increase in net gains (losses) from investment activities of consolidated variable interest entities of $214 million.
The decrease in net gains (losses) from investment activities of $309 million was primarily driven by an impairment loss on an equity investment triggered by the initial public offering of the equity security which resulted in an observable transaction price below the Company’s carrying amount, as well as the depreciation in the Company’s investments in Global Business Travel Group, Inc. The decrease in other income (loss), net of $291 million was primarily driven by the expense related to the issuance of common stock to the Apollo DAF, derivative losses primarily on forward contracts, and losses from changes in the tax receivable agreement liability, partially offset by a decrease in the earnout expense associated with a previous acquisition.
The increase in net gains (losses) from investment activities of consolidated VIEs of $214 million was primarily driven by the appreciation of a consolidated VIE’s underlying investment valuation.
87
Retirement Services
Revenues
Retirement Services revenues were $27.0 billion in 2025, an increase of $5.1 billion from $21.9 billion in 2024. The increase was primarily driven by an increase in net investment income, an increase in premiums and an increase in revenues of consolidated VIEs, partially offset by a decrease in investment related gains (losses).
Net investment income was $19.2 billion in 2025, an increase of $3.5 billion from $15.7 billion in 2024, primarily driven by significant growth in Athene’s investment portfolio attributable to strong net flows of $47.9 billion in 2025, higher rates on new deployment in comparison to Athene’s existing portfolio related to the higher interest rate environment, earlier deployment into assets during the year compared to 2024 and more favorable investment fund performance in 2025. These impacts were partially offset by lower floating rate income.
Premiums were $2.6 billion in 2025, an increase of $1.3 billion from $1.3 billion in 2024, primarily driven by $1.3 billion of premium received from the execution of a whole life block reinsurance transaction in 2025 and an increase in payout annuity premiums, partially offset by a $167 million decrease in pension group annuity premiums compared to 2024.
Revenues of consolidated VIEs were $2.5 billion in 2025, an increase of $648 million from $1.8 billion in 2024, primarily driven by growth and investment performance within AAA related to favorable returns on the underlying assets, strong performance from newly consolidated VIEs, including AAA Lux, a favorable change in the fair value of mortgage loans held in VIEs related to a decrease in U.S. Treasury rates in 2025 compared to an increase in 2024 and favorable returns from A-A Onshore Fund, LLC.
Investment related gains (losses) were $1.5 billion in 2025, a decrease of $501 million from $2.0 billion in 2024, primarily driven by unfavorable net foreign exchange impacts, an increase in realized losses on AFS securities and an unfavorable change in the fair value of indexed annuity hedging derivatives, partially offset by a favorable change in the fair value of mortgage loans, reinsurance assets and trading securities, as well as a favorable change in the provision for credit losses. The unfavorable net foreign exchange impacts were primarily related to the weakening of the U.S. dollar against foreign currencies in 2025 compared to 2024, including the impact from derivatives not designated as a hedge where the foreign exchange impact on the related asset is reported through AOCI. The change in the fair value of indexed annuity hedging derivatives decreased $51 million, primarily driven by less favorable performance of the equity indices upon which Athene’s call options are based. The largest percentage of Athene’s call options are based on the S&P 500 Index, which increased 16.4% in 2025, compared to an increase of 23.3% in 2024. The change in fair value of mortgage loans increased $1.2 billion, the change in fair value of reinsurance assets increased $319 million and the change in fair value of trading securities increased $208 million primarily driven by a decrease in U.S. Treasury rates in 2025 compared to an increase 2024, partially offset by an unfavorable change in credit spreads compared to 2024. The favorable change in provision for credit losses of $70 million was primarily driven by a reduction in the allowance on corporate securities in 2025.
Expenses
Retirement Services expenses were $20.5 billion in 2025, an increase of $5.5 billion from $15.0 billion in 2024. The increase was driven by an increase in interest sensitive contract benefits, an increase in future policy and other policy benefits, an increase in market risk benefits remeasurement (gains) losses, an increase in the amortization of DAC, DSI and VOBA and an increase in policy and other operating expenses. Athene’s annual unlocking of assumptions resulted in a decrease in total benefits and expenses of $55 million compared to an increase of $31 million in 2024. The 2025 unlocking was driven by a decrease of $90 million in interest sensitive contract benefits and a decrease of $59 million in market risk benefits, partially offset by an increase of $53 million related to DAC, DSI and VOBA amortization and an increase of $41 million in future policy and other policy benefits. The 2024 unlocking was driven by an increase of $62 million in market risk benefits, an increase of $21 million related to DAC, DSI and VOBA amortization and an increase of $8 million in interest sensitive contract benefits, partially offset by a decrease of $60 million in future policy and other policy benefits.
Interest sensitive contract benefits were $12.1 billion in 2025, an increase of $3.1 billion from $8.9 billion in 2024, primarily driven by significant growth in Athene’s deferred annuity and funding agreement blocks of business, higher rates on new deferred annuity and funding agreement issuances, as well as runoff of lower rate business, in comparison to its existing blocks of business, earlier origination of new business within the year compared to 2024 and an increase in the change in Athene’s indexed annuity reserves. These impacts were partially offset by lower rates on floating rate funding agreements and a favorable
88
change in unlocking. The change in Athene’s indexed annuity reserves includes the impact from changes in the fair value of indexed annuity embedded derivatives. The increase in the change in fair value of indexed annuity embedded derivatives of $873 million was primarily due to the unfavorable change in discount rates used in Athene’s embedded derivative calculations as 2025 experienced a decrease in discount rates compared to an increase in 2024. This was partially offset by the favorable impact of rate movements on policyholder projected benefits and less favorable performance of the equity indices to which Athene’s indexed annuity policies are linked. The largest percentage of Athene’s indexed annuity policies are linked to the S&P 500 Index, which increased 16.4% in 2025, compared to an increase of 23.3% in 2024. The fair value of indexed annuity embedded derivative and investment contract provision unlocking in 2025 was $79 million favorable primarily due to changes to projected interest crediting, partially offset by changes in policyholder behavior and mortality assumptions, while 2024 unlocking was $67 million unfavorable primarily due to changes to projected interest crediting. The negative VOBA unlocking related to Athene’s interest sensitive contract liabilities in 2025 was $11 million favorable mainly due to changes in policyholder behavior, partially offset by updated economic assumptions, while 2024 unlocking was $59 million favorable mainly due to updated economic assumptions and changes in policyholder behavior.
Future policy and other policy benefits were $4.4 billion in 2025, an increase of $1.4 billion from $3.1 billion in 2024, primarily driven by an increase in life reserves due to the execution of a $1.3 billion whole life block reinsurance transaction in 2025, an unfavorable change in unlocking and an increase in the AmerUs Closed Block fair value liability, partially offset by a $167 million decrease in pension group annuity obligations compared to 2024. The change in the AmerUs Closed Block fair value liability was primarily due to unrealized gains on the underlying assets reflecting a decrease in U.S. Treasury rates in 2025 compared to an increase in 2024, partially offset by an unfavorable change in credit spreads compared to 2024. Unlocking in 2025 was $41 million unfavorable, consisting of $77 million of unfavorable future policy benefit reserve unlocking, partially offset by $36 million of favorable negative VOBA and deferred profit liability unlocking. The unfavorable unlocking primarily related to updated mortality assumptions and changes in policyholder behavior, partially offset by updated economic assumptions. Unlocking in 2024 was $60 million favorable, consisting of $104 million of favorable future policy benefit reserve unlocking, partially offset by $44 million of unfavorable negative VOBA and deferred profit liability unlocking. The favorable unlocking primarily related to updated mortality assumptions, partially offset by changes in policyholder behavior.
Market risk benefits remeasurement (gains) losses were $452 million in 2025, an increase of $554 million from $(102) million in 2024. The losses in 2025 compared to gains in 2024 were primarily driven by an unfavorable change in the fair value of market risk benefits primarily due to rate movements, partially offset by a favorable change in unlocking. The change in fair value of market risk benefits was $665 million unfavorable due to a decrease in the risk-free discount rates across the long end of the curve compared to 2024, which are used in the fair value measurement of the liability for market risk benefits. The market risk benefits unlocking in 2025 was $59 million favorable primarily due to changes in policyholder behavior and updated mortality assumptions, partially offset by changes in projected interest crediting, while 2024 unlocking was $62 million unfavorable primarily due to changes in policyholder behavior, partially offset by updated economic assumptions.
Amortization of DAC, DSI and VOBA was $1.2 billion in 2025, an increase of $301 million from $941 million in 2024, primarily driven by an increase in acquisition and sale incentive costs that are deferred and amortized due to strong growth in Athene’s deferred annuity business as well as an unfavorable change in unlocking. Unlocking in 2025 was $53 million unfavorable mainly related to changes in policyholder behavior and projected interest crediting as well as updated economic and mortality assumptions, while unlocking in 2024 was $21 million unfavorable mainly related to changes to projected interest crediting and policyholder behavior.
Policy and other operating expenses were $2.3 billion in 2025, an increase of $142 million from $2.1 billion in 2024, primarily driven by an increase in interest expense and policy acquisition expenses related to significant growth. The increase in interest expense was primarily due to an increase in host accretion on business ceded to Catalina, as well as interest related to additional issuances of long-term debt in the second quarter of 2025 and a full year of interest on long-term debt issued in the fourth quarter of 2024. These impacts were partially offset by the recognition of $152 million of expense related to guaranty association assessments levied against Athene in connection with the Bankers Life Insurance Company (“BLIC”) and Colorado Bankers Life Insurance Company (“CBLIC”) insolvencies in 2024.
Income Tax (Provision) Benefit
The Company’s income tax (provision) benefit was $(1,276) million and $(1,062) million in 2025 and 2024, respectively. The provision for income taxes includes federal, state, local and foreign income taxes resulting in an effective income tax rate of 19.1% and 14.3% for 2025 and 2024, respectively. The most significant reconciling items between the U.S. federal statutory income tax rate and the effective income tax rate were due to the following: (i) foreign, state and local income taxes, including
89
NYC UBT, (ii) income attributable to non-controlling interests, (iii) equity-based compensation net of the limiting provisions for executive compensation under IRC Section 162(m), and (iv) Bermuda CIT. See note 13 to the consolidated financial statements for further details regarding the Company’s income tax provision.
Segment Analysis
Discussed below are our results of operations for each of our reportable segments. They represent the segment information available and utilized by management to assess performance and to allocate resources. See note 21 to our consolidated financial statements for more information regarding our segment reporting.
Asset Management
The following table presents Fee Related Earnings, the performance measure of our Asset Management segment.
| Years ended December 31, | Total Change | Percentage Change | Years ended December 31, | Total Change | Percentage Change | ||||||||||||||||||||||||||||||||||||||||||
| (In millions, except percentages) | 2025 | 2024 | 2024 | 2023 | |||||||||||||||||||||||||||||||||||||||||||
| Asset Management: | |||||||||||||||||||||||||||||||||||||||||||||||
| Management fees – Credit | $ | 2,475 | $ | 2,015 | $ | 460 | 22.8% | $ | 2,015 | $ | 1,688 | $ | 327 | 19.4% | |||||||||||||||||||||||||||||||||
| Management fees – Equity | 916 | 761 | 155 | 20.4 | 761 | 792 | (31) | (3.9) | |||||||||||||||||||||||||||||||||||||||
| Management fees | 3,391 | 2,776 | 615 | 22.2 | 2,776 | 2,480 | 296 | 11.9 | |||||||||||||||||||||||||||||||||||||||
| Capital solutions fees and other, net | 808 | 668 | 140 | 21.0 | 668 | 538 | 130 | 24.2 | |||||||||||||||||||||||||||||||||||||||
| Fee-related performance fees | 266 | 208 | 58 | 27.9 | 208 | 146 | 62 | 42.5 | |||||||||||||||||||||||||||||||||||||||
| Fee-related compensation | (1,178) | (925) | 253 | 27.4 | (925) | (835) | 90 | 10.8 | |||||||||||||||||||||||||||||||||||||||
| Non-compensation expenses | (759) | (664) | 95 | 14.3 | (664) | (561) | 103 | 18.4 | |||||||||||||||||||||||||||||||||||||||
| Fee Related Earnings (FRE) | $ | 2,528 | $ | 2,063 | $ | 465 | 22.5% | $ | 2,063 | $ | 1,768 | $ | 295 | 16.7% | |||||||||||||||||||||||||||||||||
A discussion of our Asset Management segment analysis for the year ended December 31, 2024 as compared to the year ended December 31, 2023 is included in the Company’s 2024 Annual Report.
Year Ended December 31, 2025 Compared to the Year Ended December 31, 2024
In this section, references to 2025 refer to the year ended December 31, 2025 and references to 2024 refer to the year ended December 31, 2024.
FRE was $2.5 billion in 2025, an increase of $465 million compared to $2.1 billion in 2024. This increase was primarily attributable to growth in fee related revenues, including management fees, capital solutions fees and other, net and fee-related performance fees, partially offset by fee-related compensation and non-compensation expenses.
The increase in management fees was primarily attributable to $493 million of aggregate management fees earned from Athene, Bridge funds, ADS, S3 Equity and Hybrid Solutions, and AIOF III, partially offset by an aggregate decrease of $41 million in management fees earned from Fund IX and Fund VIII. The increase in management fees earned from Athene was primarily driven by increases in fee-generating AUM as a result of strong organic inflows at Athene, while the increase in management fees earned from Bridge funds is due to the Bridge acquisition. The increase in management fees earned from ADS was primarily driven by increased subscriptions. Further, the increase in management fees earned from S3 Equity and Hybrid Solutions and AIOF III was primarily driven by catch-up management fees on additional closes in 2025. The decrease in management fees earned from Fund IX and Fund VIII was correlated with the fee rate step-down of Fund IX and the expiration of Fund VIII’s fee-paying period, respectively.
Capital solutions fees earned in 2025 were primarily attributable to fees earned from our corporate private equity, direct origination, asset-backed finance, infrastructure and clean transition equity, and opportunistic credit strategies.
The increase in fee-related performance fees in 2025 was primarily driven by the sustained growth across a variety of perpetual capital vehicles.
90
The growth in fee related revenues was partially offset by higher fee-related compensation expense and non-compensation expenses. Higher fee-related compensation expense in 2025 was driven by strong growth in fee related revenues and increased headcount as a result of our investment in the next phase of our growth. The increase in non-compensation expenses in 2025 was primarily driven by increases in professional fees, travel and entertainment expenses, placement fees, and depreciation and amortization expense.
Asset Management Operating Metrics
We monitor certain operating metrics that are common to the alternative asset management industry and directly impact the performance of our Asset Management segment. These operating metrics include Assets Under Management, origination, gross capital deployment and uncalled commitments.
Assets Under Management
The following presents Apollo’s Total AUM and Fee-Generating AUM by investing strategy (in billions):
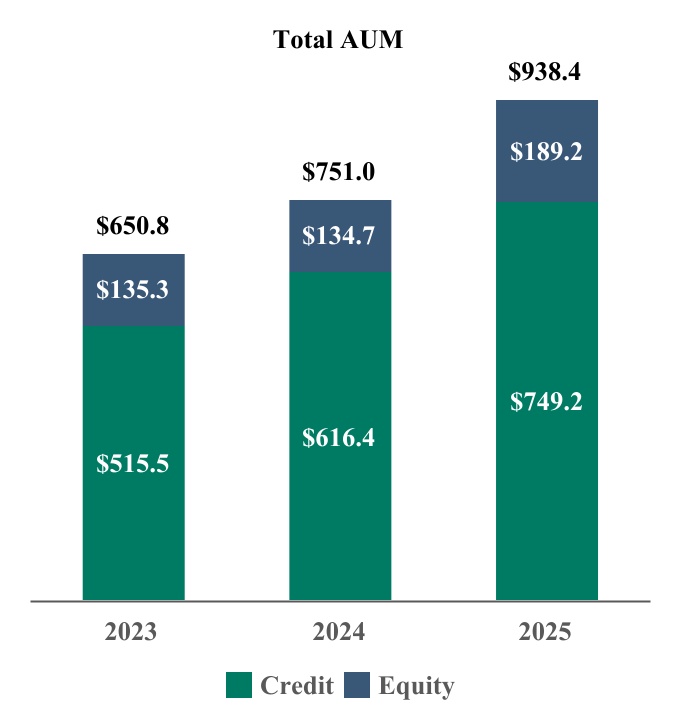
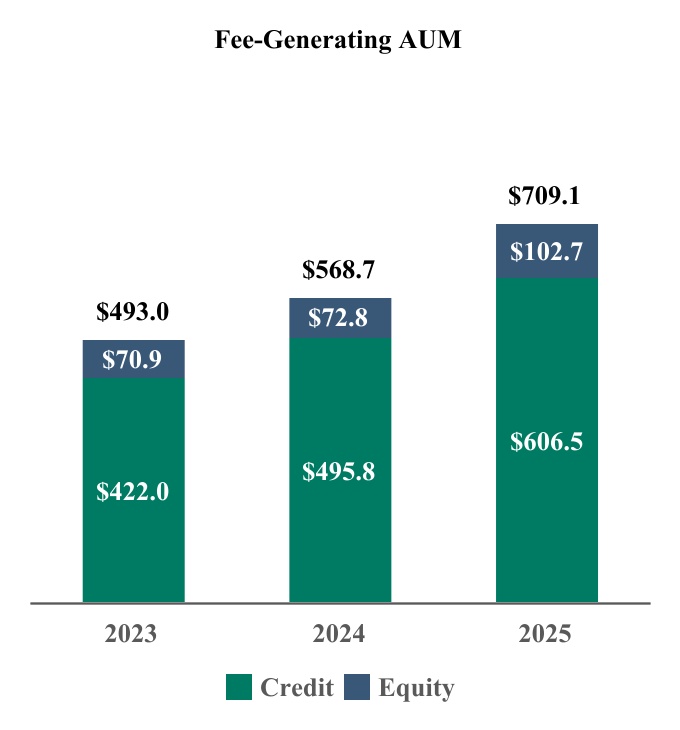
Note: Totals may not add due to rounding.
91
The following presents Apollo’s AUM with Future Management Fee Potential by investing strategy (in billions):
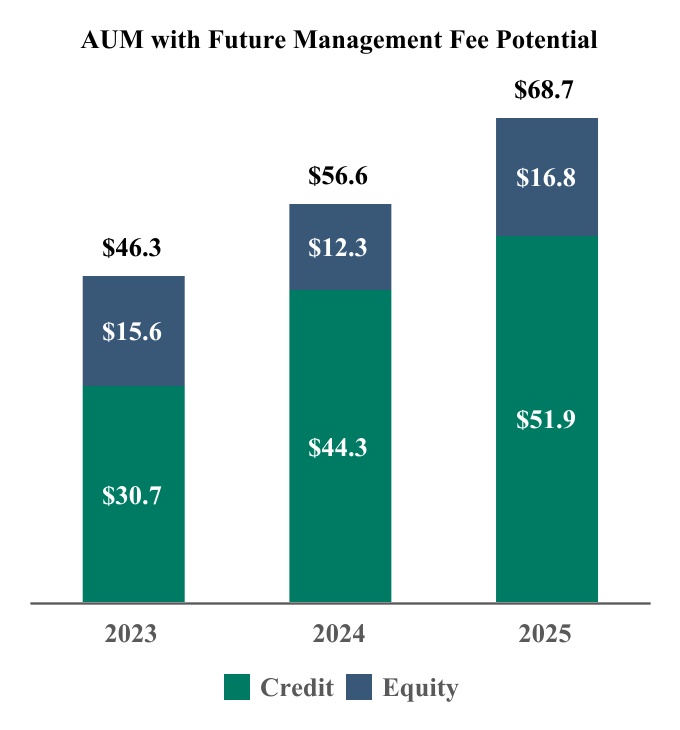
Note: Totals may not add due to rounding
The following tables present the components of Performance Fee-Eligible AUM for Apollo’s investing strategies within the Asset Management segment:
| December 31, 2025 | |||||||||||||||||
| (In millions) | Credit | Equity | Total | ||||||||||||||
Performance Fee-Generating AUM 1 | $ | 138,572 | $ | 83,282 | $ | 221,854 | |||||||||||
| AUM Not Currently Generating Performance Fees | 20,690 | 19,499 | 40,189 | ||||||||||||||
| Uninvested Performance Fee-Eligible AUM | 28,958 | 30,890 | 59,848 | ||||||||||||||
| Total Performance Fee-Eligible AUM | $ | 188,220 | $ | 133,671 | $ | 321,891 | |||||||||||
| December 31, 2024 | |||||||||||||||||
| (In millions) | Credit | Equity | Total | ||||||||||||||
Performance Fee-Generating AUM 1 | $ | 92,532 | $ | 57,665 | $ | 150,197 | |||||||||||
| AUM Not Currently Generating Performance Fees | 10,454 | 4,354 | 14,808 | ||||||||||||||
| Uninvested Performance Fee-Eligible AUM | 30,695 | 27,779 | 58,474 | ||||||||||||||
| Total Performance Fee-Eligible AUM | $ | 133,681 | $ | 89,798 | $ | 223,479 | |||||||||||
1 Performance Fee-Generating AUM of $9.8 billion and $6.1 billion as of December 31, 2025 and December 31, 2024, respectively, are above the hurdle rates or preferred returns and have been deferred to future periods when the fees are probable to not be significantly reversed. | |||||||||||||||||
92
The components of Fee-Generating AUM by investing strategy are presented below:
| December 31, 2025 | |||||||||||||||||
| (In millions) | Credit | Equity | Total | ||||||||||||||
| Fee-Generating AUM based on capital commitments | $ | — | $ | 32,928 | $ | 32,928 | |||||||||||
| Fee-Generating AUM based on invested capital | 15,495 | 50,467 | 65,962 | ||||||||||||||
| Fee-Generating AUM based on gross/adjusted assets | 511,385 | 6,180 | 517,565 | ||||||||||||||
| Fee-Generating AUM based on NAV | 79,586 | 13,098 | 92,684 | ||||||||||||||
| Total Fee-Generating AUM | $ | 606,466 | $ | 102,673 | 1 | $ | 709,139 | ||||||||||
1 The weighted average remaining life of the traditional private equity funds as of December 31, 2025 was 56 months. | |||||||||||||||||
| December 31, 2024 | |||||||||||||||||
| (In millions) | Credit | Equity | Total | ||||||||||||||
| Fee-Generating AUM based on capital commitments | $ | — | $ | 24,678 | $ | 24,678 | |||||||||||
| Fee-Generating AUM based on invested capital | 12,462 | 33,271 | 45,733 | ||||||||||||||
| Fee-Generating AUM based on gross/adjusted assets | 421,421 | 5,547 | 426,968 | ||||||||||||||
| Fee-Generating AUM based on NAV | 61,960 | 9,327 | 71,287 | ||||||||||||||
| Total Fee-Generating AUM | $ | 495,843 | $ | 72,823 | 1 | $ | 568,666 | ||||||||||
1 The weighted average remaining life of the traditional private equity funds as of December 31, 2024 was 60 months. | |||||||||||||||||
Apollo, through its consolidated subsidiary, ISG, provides asset management services to Athene with respect to assets in the accounts owned by or related to Athene (“Athene Accounts”), including asset allocation services, direct asset management services, asset and liability matching management, mergers and acquisitions asset diligence, hedging and other asset management services and receives management fees for providing these services. The Company, through ISG, also provides sub-allocation services with respect to a portion of the assets in the Athene Accounts. Apollo, through its asset management business, managed or advised $392.2 billion and $331.5 billion of AUM on behalf of Athene as of December 31, 2025 and December 31, 2024, respectively.
Apollo, through ISGI, provides investment advisory services with respect to certain assets in certain portfolio companies of Apollo funds and sub-advises the Athora Accounts and broadly refers to “Athora Sub-Advised” assets as those assets in the Athora Accounts which the Company explicitly sub-advises as well as those assets in the Athora Accounts which are invested directly in funds and investment vehicles Apollo manages. The Company refers to the portion of the Athora AUM that is not Athora Sub-Advised AUM as “Athora Non-Sub Advised” AUM. See note 18 to the consolidated financial statements for more details regarding the fee arrangements with respect to the assets in the Athora Accounts. Apollo managed or advised $57.2 billion and $52.4 billion of AUM on behalf of Athora as of December 31, 2025 and December 31, 2024, respectively.
93
The following tables summarize changes in total AUM for Apollo’s investing strategies within the Asset Management segment:
| Years ended December 31, | |||||||||||||||||||||||||||||||||||
| 2025 | 2024 | ||||||||||||||||||||||||||||||||||
| (In millions) | Credit | Equity | Total | Credit | Equity | Total | |||||||||||||||||||||||||||||
Change in Total AUM1: | |||||||||||||||||||||||||||||||||||
| Beginning of Period | $ | 616,387 | $ | 134,650 | $ | 751,037 | $ | 515,523 | $ | 135,253 | $ | 650,776 | |||||||||||||||||||||||
Inflows2 | 169,719 | 61,958 | 231,677 | 142,628 | 9,776 | 152,404 | |||||||||||||||||||||||||||||
Outflows2 | (61,740) | (1,923) | (63,663) | (52,192) | (7,157) | (59,349) | |||||||||||||||||||||||||||||
| Net Flows | 107,979 | 60,035 | 168,014 | 90,436 | 2,619 | 93,055 | |||||||||||||||||||||||||||||
| Realizations | (8,840) | (13,049) | (21,889) | (14,136) | (9,034) | (23,170) | |||||||||||||||||||||||||||||
Market Activity3 | 33,702 | 7,542 | 41,244 | 24,564 | 5,812 | 30,376 | |||||||||||||||||||||||||||||
| End of Period | $ | 749,228 | $ | 189,178 | $ | 938,406 | $ | 616,387 | $ | 134,650 | $ | 751,037 | |||||||||||||||||||||||
1 At the individual strategy level, inflows include new subscriptions, commitments, capital raised, other increases in available capital, purchases, acquisitions and portfolio company appreciation. Outflows represent redemptions, other decreases in available capital and portfolio company depreciation. Realizations represent fund distributions of realized proceeds. Market activity represents gains (losses), the impact of foreign exchange rate fluctuations and other income. | |||||||||||||||||||||||||||||||||||
2 Inflows and outflows reflected above include $3.4 billion for Total AUM related to a strategy realignment of certain funds from credit to equity as of January 1, 2025 with no impact to net flows presented for the year ended December 31, 2025. Outflows for Total AUM include redemptions of $7.1 billion and $6.9 billion during the years ended December 31, 2025 and 2024, respectively. | |||||||||||||||||||||||||||||||||||
3 Includes foreign exchange impacts of $9.9 billion and $(5.3) billion during the years ended December 31, 2025 and 2024, respectively. | |||||||||||||||||||||||||||||||||||
Year Ended December 31, 2025
Total AUM was $938.4 billion at December 31, 2025, an increase of $187.4 billion, or 25.0%, compared to $751.0 billion at December 31, 2024. The net increase was primarily driven by subscriptions across the platform, the growth of our retirement services client assets, the Bridge acquisition and market activity primarily in our credit strategy, partially offset by normal course outflows at Athene, as well as realizations. More specifically, the net increase was due to:
•Net flows of $168.0 billion primarily attributable to:
•a $108.0 billion increase related to the funds we manage in our credit strategy primarily consisting of (i) $42.0 billion related to the growth of our retirement services clients; (ii) $41.0 billion of subscriptions mostly related to the direct origination, multi-credit, opportunistic credit and asset-backed finance funds we manage; (iii) $9.3 billion in inflows relating to Redding Ridge’s acquisition of Irradiant Partners LP; and (iv) incremental leverage in the direct origination and asset-backed finance funds we manage, partially offset by $(5.7) billion of redemptions; and
•a $60.0 billion increase related to the funds we manage in our equity strategy primarily consisting of (i) $34.2 billion due to the Bridge acquisition; (ii) $17.0 billion of subscriptions across the hybrid value, secondaries equity, infrastructure equity and traditional private equity funds we manage; and (iii) $5.6 billion of net transfer activity.
•Market activity of $41.2 billion primarily attributable to:
•$33.7 billion related to the funds we manage in our credit strategy primarily consisting of (i) $19.0 billion related to our retirement services clients; (ii) $4.8 billion related to the direct origination funds we manage; (iii) $2.9 billion related to the multi-credit funds we manage; and (iv) $2.8 billion related to the opportunistic credit funds we manage; and
•$7.5 billion related to the funds we manage in our equity strategy primarily driven by our traditional private equity and hybrid value funds.
•Realizations of $(21.9) billion primarily attributable to:
•$(13.0) billion related to the funds we manage in our equity strategy primarily consisting of distributions from the traditional private equity funds, hybrid value funds and real estate equity funds; and
•$(8.8) billion related to the funds we manage in our credit strategy, largely driven by distributions from the direct origination, asset-backed finance and opportunistic credit funds.
94
The following tables summarize changes in Fee-Generating AUM for Apollo’s investing strategies within the Asset Management segment:
| Years ended December 31, | |||||||||||||||||||||||||||||||||||
| 2025 | 2024 | ||||||||||||||||||||||||||||||||||
| (In millions) | Credit | Equity | Total | Credit | Equity | Total | |||||||||||||||||||||||||||||
Change in Fee-Generating AUM1: | |||||||||||||||||||||||||||||||||||
| Beginning of Period | $ | 495,843 | $ | 72,823 | $ | 568,666 | $ | 422,036 | $ | 70,916 | $ | 492,952 | |||||||||||||||||||||||
Inflows2 | 148,192 | 41,243 | 189,435 | 118,318 | 10,574 | 128,892 | |||||||||||||||||||||||||||||
Outflows2,3 | (60,479) | (9,309) | (69,788) | (60,556) | (6,617) | (67,173) | |||||||||||||||||||||||||||||
| Net Flows | 87,713 | 31,934 | 119,647 | 57,762 | 3,957 | 61,719 | |||||||||||||||||||||||||||||
| Realizations | (6,271) | (3,327) | (9,598) | (5,575) | (2,130) | (7,705) | |||||||||||||||||||||||||||||
Market Activity4 | 29,181 | 1,243 | 30,424 | 21,620 | 80 | 21,700 | |||||||||||||||||||||||||||||
| End of Period | $ | 606,466 | $ | 102,673 | $ | 709,139 | $ | 495,843 | $ | 72,823 | $ | 568,666 | |||||||||||||||||||||||
1 At the individual strategy level, inflows include new subscriptions, commitments, capital raised, other increases in available capital, purchases, acquisitions and portfolio company appreciation. Outflows represent redemptions, other decreases in available capital and portfolio company depreciation. Realizations represent fund distributions of realized proceeds. Market activity represents gains (losses), the impact of foreign exchange rate fluctuations and other income. | |||||||||||||||||||||||||||||||||||
2 Inflows and outflows reflected above include $2.0 billion for Fee-Generating AUM related to a strategy realignment of certain funds from credit to equity as of January 1, 2025 with no impact to net flows presented for the year ended December 31, 2025. Outflows for Fee-Generating AUM include redemptions of $6.4 billion and $6.6 billion during the years ended December 31, 2025 and 2024, respectively. | |||||||||||||||||||||||||||||||||||
3 Included in the equity outflows for Fee-Generating AUM for the year ended December 31, 2025 is $4.5 billion related to the expiration of Fund VIII's fee-paying period. | |||||||||||||||||||||||||||||||||||
4 Includes foreign exchange impacts of $7.5 billion and $(3.8) billion during the years ended December 31, 2025 and 2024, respectively. | |||||||||||||||||||||||||||||||||||
Year Ended December 31, 2025
Total Fee-Generating AUM was $709.1 billion at December 31, 2025, an increase of $140.5 billion, or 24.7%, compared to $568.7 billion at December 31, 2024. The net increase was primarily due to the growth of our retirement services client assets, market activity primarily in our credit strategy, the Bridge acquisition and subscriptions across the platform, partially offset by realizations. More specifically, the net increase was due to:
•Net flows of $119.6 billion primarily attributable to:
•an $87.7 billion increase related to the funds we manage in our credit strategy primarily consisting of (i) $42.0 billion related to the growth of our retirement services client assets; (ii) $24.3 billion of other net fee-generating movements; and (iii) $20.3 billion of subscriptions primarily related to the direct origination and multi-credit funds we manage, partially offset by $(5.1) billion of redemptions; and
•a $31.9 billion increase related to the funds we manage in our equity strategy primarily consisting of (i) $21.4 billion primarily due to the Bridge acquisition; and (ii) $5.7 billion of subscriptions across the AAA, secondaries and infrastructure equity funds we manage.
•Market activity of $30.4 billion primarily attributable to the funds we manage in our credit strategy, consisting of (i) $19.0 billion related to our retirement services clients; (ii) $2.9 billion related to the multi-credit funds we manage; (iii) $2.7 billion related to the direct origination funds we manage; and (iv) $1.8 billion related to clients of ISGI.
•Realizations of $(9.6) billion across the credit and equity strategies.
Origination, Gross Capital Deployment and Uncalled Commitments
Origination represents (i) capital that has been invested in new equity, debt or debt-like investments by Apollo's equity and credit strategies (whether purchased by funds and accounts managed by Apollo, or syndicated to third parties) where Apollo or one of Apollo's origination platforms has sourced, negotiated, or significantly affected the commercial terms of the investment; (ii) new capital pools formed by debt issuances, including CLOs; and (iii) net purchases of certain assets by the funds and accounts we manage that we consider to be private, illiquid, and hard to access assets and which the funds and accounts otherwise may not be able to meaningfully access. Origination generally excludes any issuance of debt or debt-like investments by the portfolio companies of the funds we manage.
95
Gross capital deployment represents the gross capital that has been invested by the funds and accounts we manage during the relevant period, but excludes certain investment activities primarily related to hedging and cash management functions at the Company. Gross capital deployment is not reduced or netted down by sales or refinancings, and takes into account leverage used by the funds and accounts we manage in gaining exposure to the various investments that they have made.
Uncalled commitments, by contrast, represent unfunded capital commitments that certain of the funds we manage have received from fund investors to fund future or current fund investments and expenses.
Origination is indicative of our ability to originate assets for the funds we manage, through our origination platforms and our corporate solutions capabilities. Gross capital deployment and uncalled commitments are indicative of the pace and magnitude of fund capital that is deployed or will be deployed. Origination, gross capital deployment and uncalled commitments could result in future revenues that include management fees, capital solutions fees and performance fees to the extent they are fee-generating. They can also give rise to future costs that are related to the hiring of additional resources to manage and account for the additional origination activities and the capital that is deployed or will be deployed. Management uses origination, gross capital deployment and uncalled commitments as key operating metrics since we believe the results are measures of investment activities of the funds we manage.
The following presents origination, gross capital deployment1 and uncalled commitments (in billions):
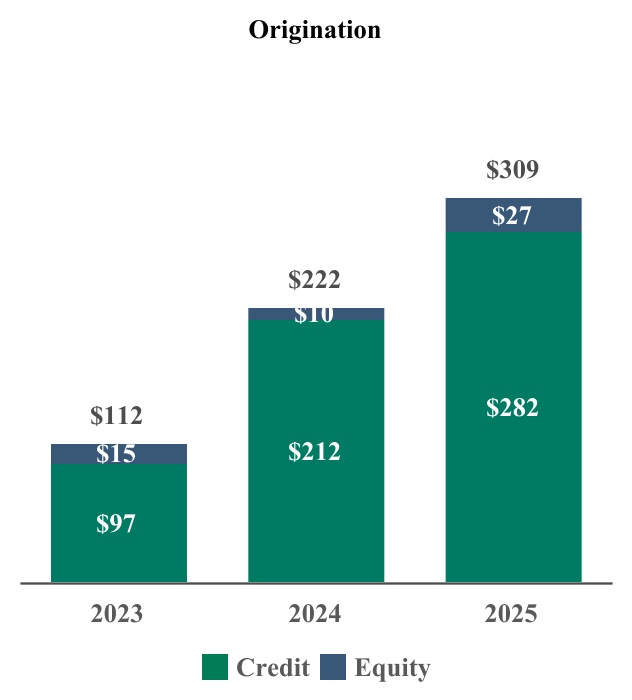
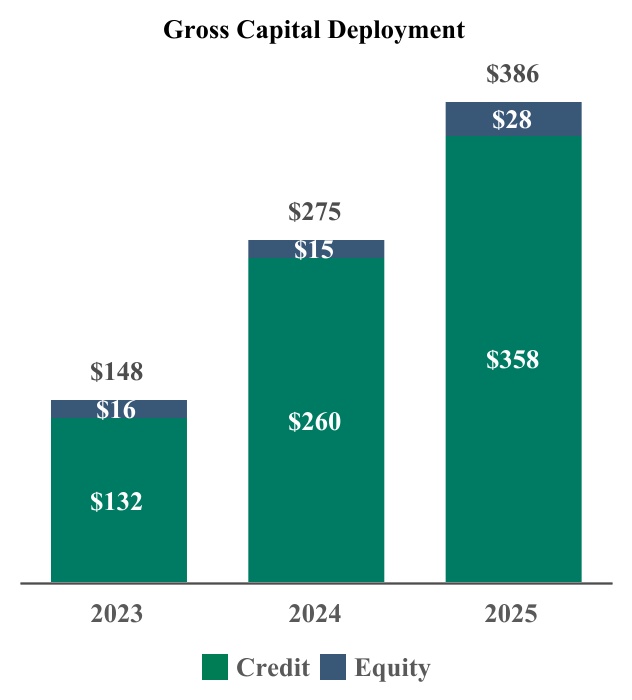
1 Gross capital deployment for 2024 was updated to include an additional $9 billion for Atlas related to the fourth quarter of 2024.
96
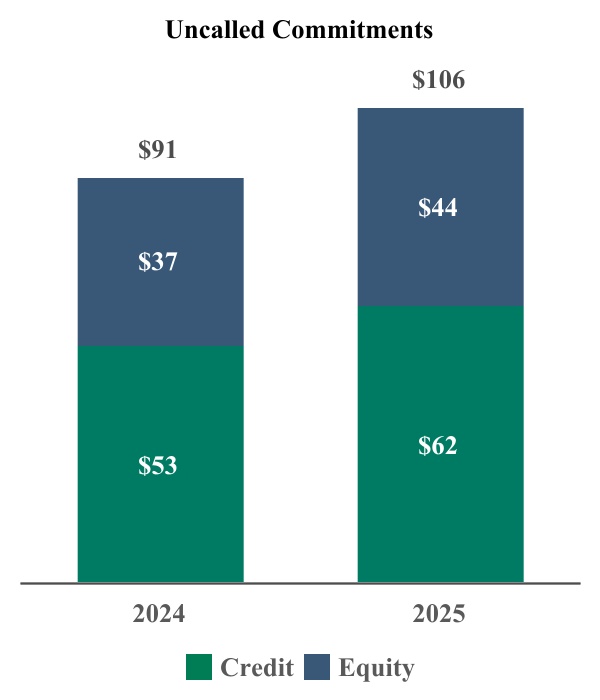
Note: Totals may not add due to rounding
As of December 31, 2025 and December 31, 2024, Apollo had $73 billion and $61 billion of dry powder, respectively, which represents the amount of capital available for investment or reinvestment subject to the provisions of the applicable limited partnership agreements or other governing agreements of the funds, partnerships and accounts we manage. These amounts exclude uncalled commitments which can only be called for fund fees and expenses and commitments from perpetual capital vehicles.
Retirement Services
The following table presents Spread Related Earnings, the performance measure of our Retirement Services segment:
| Years ended December 31, | Total Change | Percentage Change | Years ended December 31, | Total Change | Percentage Change | ||||||||||||||||||||||||||||||||||||||||||
| (In millions, except percentages) | 2025 | 2024 | 2024 | 2023 | |||||||||||||||||||||||||||||||||||||||||||
| Retirement Services: | |||||||||||||||||||||||||||||||||||||||||||||||
| Fixed income and other net investment income | $ | 13,021 | $ | 10,805 | $ | 2,216 | 20.5% | $ | 10,805 | $ | 8,739 | $ | 2,066 | 23.6% | |||||||||||||||||||||||||||||||||
| Alternative net investment income | 1,299 | 939 | 360 | 38.3 | 939 | 864 | 75 | 8.7 | |||||||||||||||||||||||||||||||||||||||
| Net investment earnings | 14,320 | 11,744 | 2,576 | 21.9 | 11,744 | 9,603 | 2,141 | 22.3 | |||||||||||||||||||||||||||||||||||||||
| Strategic capital management fees | 131 | 105 | 26 | 24.8 | 105 | 72 | 33 | 45.8 | |||||||||||||||||||||||||||||||||||||||
| Cost of funds | (10,083) | (7,702) | 2,381 | 30.9 | (7,702) | (5,650) | 2,052 | 36.3 | |||||||||||||||||||||||||||||||||||||||
| Net investment spread | 4,368 | 4,147 | 221 | 5.3 | 4,147 | 4,025 | 122 | 3.0 | |||||||||||||||||||||||||||||||||||||||
| Other operating expenses | (447) | (458) | (11) | (2.4) | (458) | (481) | (23) | (4.8) | |||||||||||||||||||||||||||||||||||||||
| Interest and other financing costs | (560) | (465) | 95 | 20.4 | (465) | (436) | 29 | 6.7 | |||||||||||||||||||||||||||||||||||||||
| Spread Related Earnings | $ | 3,361 | $ | 3,224 | $ | 137 | 4.2% | $ | 3,224 | $ | 3,108 | $ | 116 | 3.7% | |||||||||||||||||||||||||||||||||
A discussion of our Retirement Services segment analysis for the year ended December 31, 2024 as compared to the year ended December 31, 2023 is included in the Company’s 2024 Annual Report.
Year Ended December 31, 2025 Compared to the Year Ended December 31, 2024
In this section, references to 2025 refer to the year ended December 31, 2025 and references to 2024 refer to the year ended December 31, 2024.
97
Spread Related Earnings
SRE was $3.4 billion in 2025, an increase of $137 million, or 4%, compared to $3.2 billion in 2024. The increase in SRE was primarily driven by an increase in net investment earnings and strategic capital management fees, partially offset by an increase in cost of funds and interest and other financing costs.
Net investment earnings were $14.3 billion in 2025, an increase of $2.6 billion from $11.7 billion in 2024, primarily driven by $39.1 billion of growth in Athene’s average net invested assets, higher rates on new deployment compared to Athene’s existing portfolio related to the higher interest rate environment, an increase in alternative net investment income and earlier deployment into assets during the year compared to 2024, partially offset by lower floating rate income and prepayment of higher yielding assets. The increase in alternative net investment income compared to 2024 was primarily driven by more favorable performance within origination and retirement services platforms as well as equity funds, partially offset by less favorable performance within credit funds. The increase in income from origination platforms was mainly attributable to an initial mark from cost to fair value and origination outperformance on Atlas in 2025, robust deployment following a capital raise within Apterra Infrastructure Capital, LLC (“Apterra”) in 2025 and strong growth from origination partnerships within Aqua Finance, Inc. (“Aqua Finance”) in 2025 compared to a valuation decrease in 2024, partially offset by stronger growth from Redding Ridge in 2024. The increase in income from retirement services platforms was primarily related to a valuation increase on Venerable in 2025 related to the announcement of a reinsurance transaction with Corebridge Financial, Inc. (“Corebridge”), unfavorable returns on Athene’s investment in Catalina in 2024 not recurring in 2025 due to the distribution of its Catalina common equity interests as a dividend in the third quarter of 2024 and realized losses from the sale of Challenger Limited (“Challenger”) common equity shares in 2024. These impacts were partially offset by increased capital requirements related to expanded solvency requirements and competitive dynamics within the pension market impacting the valuation of Athora in 2025. The increase in income from equity funds was mainly attributable to more favorable performance within structured equity in 2025 compared to 2024. The decrease in income from credit funds was primarily driven by more favorable credit spread tightening in 2024 compared to 2025.
Strategic capital management fees were $131 million in 2025, an increase of $26 million from $105 million in 2024, primarily driven by additional fees received from ADIP II and Catalina attributable to strong net flows into ACRA 2 and Catalina in 2025.
Cost of funds was $10.1 billion in 2025, an increase of $2.4 billion from $7.7 billion in 2024, primarily driven by significant growth in deferred annuity and funding agreement business, higher rates on new business and runoff of lower rate business compared to existing blocks, earlier origination of new business within the year compared to 2024, a shift in business mix to more institutional business at higher crediting rates and an unfavorable change in unlocking. These impacts were partially offset by lower rates on floating rate funding agreements. Unlocking, net of the non-controlling interests, in 2025 was favorable $5 million primarily related to updated mortality assumptions and changes in policyholder behavior, partially offset by changes to projected interest crediting and updated economic assumptions. Unlocking, net of the non-controlling interests, in 2024 was favorable $16 million primarily related to updated mortality and economic assumptions, partially offset by changes in policyholder behavior and projected interest crediting.
Interest and other financing costs were $560 million in 2025, an increase of $95 million from $465 million in 2024, primarily driven by higher interest expense related to additional issuances of long-term debt in the second quarter of 2025 and a full year of interest on long-term debt issued in the fourth quarter of 2024, partially offset by a decrease in preferred stock dividends due to the redemption of Athene’s Fixed-Rate Reset Perpetual Non-Cumulative Preferred Stock, Series C (“Series C”) in the second quarter of 2025.
Net Investment Spread
| Years ended December 31, | Years ended December 31, | ||||||||||||||||||||||||||||||||||
| 2025 | 2024 | Change | 2024 | 2023 | Change | ||||||||||||||||||||||||||||||
| Fixed income and other net investment earned rate | 5.01 | % | 4.86 | % | 15 bps | 4.86 | % | 4.45 | % | 41 bps | |||||||||||||||||||||||||
| Alternative net investment earned rate | 10.01 | % | 8.03 | % | 198 bps | 8.03 | % | 7.22 | % | 81 bps | |||||||||||||||||||||||||
| Net investment earned rate | 5.25 | % | 5.03 | % | 22 bps | 5.03 | % | 4.61 | % | 42 bps | |||||||||||||||||||||||||
| Strategic capital management fees | 0.05 | % | 0.04 | % | 1 bp | 0.04 | % | 0.03 | % | 1 bp | |||||||||||||||||||||||||
| Cost of funds | (3.69) | % | (3.29) | % | 40 bps | (3.29) | % | (2.71) | % | 58 bps | |||||||||||||||||||||||||
| Net investment spread | 1.61 | % | 1.78 | % | (17) bps | 1.78 | % | 1.93 | % | (15) bps | |||||||||||||||||||||||||
98
Net investment spread was 1.61% in 2025, a decrease of 17 basis points compared to 1.78% in 2024, primarily driven by higher cost of funds, partially offset by a higher net investment earned rate.
Cost of funds was 3.69% in 2025, an increase of 40 basis points compared to 3.29% in 2024, primarily driven by higher rates on new business and runoff of lower rate business compared to existing blocks, earlier origination of new business within the year compared to 2024, a shift in business mix to more institutional business at higher crediting rates and an unfavorable change in unlocking. These impacts were partially offset by lower rates on floating rate funding agreements.
Net investment earned rate was 5.25% in 2025, an increase of 22 basis points compared to 5.03% in 2024, primarily due to higher returns in both Athene’s fixed income and alternative investment portfolios. Fixed income and other net investment earned rate was 5.01% in 2025, an increase from 4.86% in 2024, primarily driven by higher rates on new deployment compared to Athene’s existing portfolio related to the higher interest rate environment and earlier deployment into assets during the year compared to 2024, partially offset by lower floating rate income and prepayment of higher yielding assets. Alternative net investment earned rate was 10.01% in 2025, an increase from 8.03% in 2024, primarily driven by more favorable performance within origination and retirement services platforms as well as equity funds, partially offset by less favorable performance within credit funds. The higher return from origination platforms was mainly attributable to an initial mark from cost to fair value and origination outperformance on Atlas in 2025, robust deployment following a capital raise within Apterra in 2025 and strong growth from origination partnerships within Aqua Finance in 2025 compared to a valuation decrease in 2024, partially offset by stronger growth from Redding Ridge in 2024. The higher return from retirement services platforms was primarily related to a valuation increase on Venerable in 2025 related to the announcement of a reinsurance transaction with Corebridge, unfavorable returns on Athene’s investment in Catalina in 2024 not recurring in 2025 due to the distribution of its Catalina common equity interests as a dividend in the third quarter of 2024 and realized losses from the sale of Challenger common equity shares in 2024. These impacts were partially offset by increased capital requirements related to expanded solvency requirements and competitive dynamics within the pension market impacting the valuation of Athora in 2025. The higher return from equity funds was mainly attributable to more favorable performance within structured equity in 2025 compared to 2024. The lower return from credit funds was primarily driven by more favorable credit spread tightening in 2024 compared to 2025.
Investment Portfolio
Athene had total investments, including related parties and consolidated VIEs, of $386.1 billion and $314.6 billion as of December 31, 2025 and December 31, 2024, respectively. Athene’s investment strategy seeks to achieve sustainable risk-adjusted returns through the disciplined management of its investment portfolio against its long-duration liabilities, coupled with the diversification of risk. The investment strategies focus primarily on a buy and hold asset allocation strategy that may be adjusted periodically in response to changing market conditions and the nature of Athene’s liability profile. Athene takes advantage of its generally persistent liability profile by identifying investment opportunities with an emphasis on earning incremental yield by taking measured liquidity and complexity risk rather than assuming incremental credit risk. Athene is invested in a diverse array of primarily high-grade fixed income assets including corporate bonds, structured securities, and commercial and residential real estate loans, among others. Athene also maintains holdings in floating rate and less rate-sensitive instruments, including CLOs, non-agency RMBS and various types of structured products. In addition to its fixed income portfolio, Athene opportunistically allocates approximately 5% of its portfolio to alternative investments where it primarily focuses on fixed income-like, cash flow-based investments.
99
The following table presents the carrying values of Athene’s total investments, including related parties and consolidated VIEs:
| December 31, 2025 | December 31, 2024 | ||||||||||||||||||||||
| (In millions, except percentages) | Carrying Value | Percentage of Total | Carrying Value | Percentage of Total | |||||||||||||||||||
| Available-for-sale securities, at fair value | |||||||||||||||||||||||
| U.S. government and agencies | $ | 16,898 | 4.4 | % | $ | 7,151 | 2.3 | % | |||||||||||||||
| U.S. state, municipal and political subdivisions | 759 | 0.2 | % | 921 | 0.3 | % | |||||||||||||||||
| Foreign governments | 1,659 | 0.4 | % | 1,568 | 0.5 | % | |||||||||||||||||
| Corporate | 89,431 | 23.2 | % | 83,585 | 26.6 | % | |||||||||||||||||
| CLO | 26,272 | 6.8 | % | 29,182 | 9.3 | % | |||||||||||||||||
| ABS | 35,462 | 9.2 | % | 24,201 | 7.7 | % | |||||||||||||||||
| CMBS | 13,084 | 3.4 | % | 10,741 | 3.4 | % | |||||||||||||||||
| RMBS | 9,032 | 2.3 | % | 8,015 | 2.5 | % | |||||||||||||||||
| Total available-for-sale securities, at fair value | 192,597 | 49.9 | % | 165,364 | 52.6 | % | |||||||||||||||||
| Trading securities, at fair value | 6,409 | 1.7 | % | 1,583 | 0.5 | % | |||||||||||||||||
| Equity securities, at fair value | 822 | 0.2 | % | 1,290 | 0.4 | % | |||||||||||||||||
| Mortgage loans, at fair value | 91,918 | 23.8 | % | 63,239 | 20.1 | % | |||||||||||||||||
| Investment funds | 108 | — | % | 107 | — | % | |||||||||||||||||
| Policy loans | 301 | 0.1 | % | 318 | 0.1 | % | |||||||||||||||||
| Funds withheld at interest | 15,413 | 4.0 | % | 18,866 | 6.0 | % | |||||||||||||||||
| Derivative assets | 9,190 | 2.4 | % | 8,154 | 2.6 | % | |||||||||||||||||
| Short-term investments | 175 | — | % | 447 | 0.2 | % | |||||||||||||||||
| Other investments | 4,148 | 1.1 | % | 2,915 | 0.9 | % | |||||||||||||||||
| Total investments | 321,081 | 83.2 | % | 262,283 | 83.4 | % | |||||||||||||||||
| Investments in related parties | |||||||||||||||||||||||
| Available-for-sale securities, at fair value | |||||||||||||||||||||||
| Corporate | 2,317 | 0.6 | % | 2,137 | 0.7 | % | |||||||||||||||||
| CLO | 7,203 | 1.9 | % | 6,035 | 1.9 | % | |||||||||||||||||
| ABS | 16,366 | 4.2 | % | 10,631 | 3.4 | % | |||||||||||||||||
| CMBS | 161 | — | % | — | — | % | |||||||||||||||||
| Total available-for-sale securities, at fair value | 26,047 | 6.7 | % | 18,803 | 6.0 | % | |||||||||||||||||
| Trading securities, at fair value | 454 | 0.1 | % | 573 | 0.2 | % | |||||||||||||||||
| Equity securities, at fair value | 266 | 0.1 | % | 234 | 0.1 | % | |||||||||||||||||
| Mortgage loans, at fair value | 1,486 | 0.4 | % | 1,297 | 0.4 | % | |||||||||||||||||
| Investment funds | 2,149 | 0.6 | % | 1,853 | 0.6 | % | |||||||||||||||||
| Funds withheld at interest | 4,215 | 1.1 | % | 5,050 | 1.6 | % | |||||||||||||||||
| Short-term investments | 18 | — | % | 743 | 0.2 | % | |||||||||||||||||
| Other investments, at fair value | 344 | 0.1 | % | 331 | 0.1 | % | |||||||||||||||||
| Total related party investments | 34,979 | 9.1 | % | 28,884 | 9.2 | % | |||||||||||||||||
| Total investments, including related parties | 356,060 | 92.3 | % | 291,167 | 92.6 | % | |||||||||||||||||
| Investments of consolidated VIEs | |||||||||||||||||||||||
| Trading securities, at fair value | 3,120 | 0.8 | % | 2,301 | 0.7 | % | |||||||||||||||||
| Mortgage loans, at fair value | 2,140 | 0.5 | % | 2,579 | 0.8 | % | |||||||||||||||||
| Investment funds, at fair value | 23,888 | 6.2 | % | 17,660 | 5.6 | % | |||||||||||||||||
| Other investments | 844 | 0.2 | % | 884 | 0.3 | % | |||||||||||||||||
| Total investments of consolidated VIEs | 29,992 | 7.7 | % | 23,424 | 7.4 | % | |||||||||||||||||
| Total investments, including related parties and consolidated VIEs | $ | 386,052 | 100.0 | % | $ | 314,591 | 100.0 | % | |||||||||||||||
Athene’s total investments, including related parties and consolidated VIEs were $386.1 billion and $314.6 billion as of December 31, 2025 and December 31, 2024, respectively. The $71.5 billion increase was primarily driven by significant growth from gross inflows of $83.4 billion in excess of gross liability outflows of $35.5 billion, reinvestment of earnings and unrealized gains on investments, including foreign exchange impacts. The unrealized gains on investments during the year ended December 31, 2025 included AFS securities of $4.5 billion, as well as gains from mortgage loans and reinsurance assets,
100
attributable to a decrease in U.S. Treasury rates in 2025. Unrealized foreign exchange gains on foreign denominated assets were primarily related to the weakening of the U.S. dollar against foreign currencies in 2025. Additionally, total investments, including related parties and consolidated VIEs, increased due to an increase in VIE investments and an increase in derivative assets primarily related to Athene’s call options, net of derivative swap and forward contract impacts. The increase in VIE investments was primarily driven by third party contributions into AAA Lux and AAA and favorable performance of the underlying assets within AAA and AAA Lux, partially offset by the deconsolidation of several VIEs in 2025.
Athene’s investment portfolio consists largely of high quality fixed maturity securities, loans and short-term investments, as well as additional opportunistic holdings in investment funds and other instruments, including equity holdings. Fixed maturity securities and loans include publicly issued corporate bonds, government and other sovereign bonds, privately placed corporate bonds and loans, mortgage loans, CMBS, RMBS, CLOs and ABS. A significant majority of Athene’s AFS portfolio, 97.3% and 97.1% as of December 31, 2025 and December 31, 2024, respectively, was invested in assets considered investment grade with an NAIC designation of 1 or 2.
Athene invests a portion of its investment portfolio in mortgage loans, which are generally comprised of high quality commercial first lien as well as mezzanine real estate loans. Athene has acquired mortgage loans through acquisitions and reinsurance arrangements, as well as through an active program to invest in new mortgage loans. It invests in CMLs on income producing properties including apartments, office, hotel and retail buildings, and other commercial and industrial properties. Athene’s RML portfolio primarily consists of first lien RMLs collateralized by properties located in the U.S.
Funds withheld at interest represent a receivable for amounts contractually withheld by ceding companies in accordance with modco and funds withheld reinsurance agreements in which Athene acts as the reinsurer. Generally, assets equal to statutory reserves are withheld and legally owned by the ceding company.
While the substantial majority of Athene’s investment portfolio has been allocated to corporate bonds and structured credit products, a key component of Athene’s investment strategy is the opportunistic acquisition of investment funds with attractive risk and return profiles. Athene’s investment fund portfolio consists of funds or similar equity structures that employ various strategies including equity and credit funds. Athene has a strong preference for alternative investments that have some or all of the following characteristics, among others: (1) investments with credit- or debt-like characteristics (for example, a stipulated maturity and par value), or alternatively, investments with reduced volatility when compared to pure equity; or (2) investments that Athene believes have less downside risk.
Athene holds derivatives for economic hedging purposes to reduce its exposure to the cash flow variability of assets and liabilities, equity market risk, foreign exchange risk and interest rate risk. Athene’s primary use of derivative instruments relates to providing the income needed to fund the annual index credits on its indexed annuity products. Athene primarily uses indexed options to economically hedge indexed annuity products that guarantee the return of principal to the policyholder and credit interest based on a percentage of the gain in a specific market index. Athene also uses derivative instruments, such as forward contracts and swaps, to hedge foreign currency exposure resulting from foreign denominated assets and liabilities and to help manage its net floating rate position.
101
Net Invested Assets
The following summarizes Athene’s net invested assets:
| December 31, 2025 | December 31, 2024 | ||||||||||||||||||||||
| (In millions, except percentages) | Net Invested Asset Value1 | Percentage of Total | Net Invested Asset Value1 | Percentage of Total | |||||||||||||||||||
| Corporate | $ | 86,664 | 29.6 | % | $ | 86,051 | 34.6 | % | |||||||||||||||
| CLO | 25,401 | 8.7 | % | 27,698 | 11.2 | % | |||||||||||||||||
| Credit | 112,065 | 38.3 | % | 113,749 | 45.8 | % | |||||||||||||||||
| CML | 31,789 | 10.9 | % | 28,055 | 11.3 | % | |||||||||||||||||
| RML | 43,326 | 14.8 | % | 27,848 | 11.2 | % | |||||||||||||||||
| RMBS | 7,592 | 2.6 | % | 7,635 | 3.1 | % | |||||||||||||||||
| CMBS | 9,877 | 3.4 | % | 8,243 | 3.3 | % | |||||||||||||||||
| Real estate | 92,584 | 31.7 | % | 71,781 | 28.9 | % | |||||||||||||||||
| ABS | 38,417 | 13.1 | % | 28,670 | 11.5 | % | |||||||||||||||||
| Alternative investments | 13,868 | 4.7 | % | 12,000 | 4.8 | % | |||||||||||||||||
| State, municipal, political subdivisions and foreign government | 3,081 | 1.0 | % | 3,237 | 1.3 | % | |||||||||||||||||
| Equity securities | 2,039 | 0.7 | % | 2,201 | 0.9 | % | |||||||||||||||||
| Short-term investments | 207 | 0.1 | % | 1,015 | 0.4 | % | |||||||||||||||||
| U.S. government and agencies | 14,225 | 4.9 | % | 5,531 | 2.2 | % | |||||||||||||||||
| Other investments | 71,837 | 24.5 | % | 52,654 | 21.1 | % | |||||||||||||||||
| Cash and cash equivalents | 10,490 | 3.6 | % | 6,794 | 2.7 | % | |||||||||||||||||
| Other | 5,438 | 1.9 | % | 3,665 | 1.5 | % | |||||||||||||||||
| Net invested assets | $ | 292,414 | 100.0 | % | $ | 248,643 | 100.0 | % | |||||||||||||||
1 See “Managing Business Performance - Key Segment and Non-U.S. GAAP Performance Measures” for the definition of net invested assets. | |||||||||||||||||||||||
Athene’s net invested assets were $292.4 billion and $248.6 billion as of December 31, 2025 and December 31, 2024, respectively. The $43.8 billion increase was primarily driven by growth from net inflows of $63.2 billion in excess of net liability outflows of $29.7 billion, the reinvestment of earnings, the issuance of $1.6 billion of long-term debt in 2025 and favorable alternative investment performance in 2025, partially offset by the payment of common and preferred stock dividends and cash paid to redeem Athene’s Series C preferred stock in the second quarter of 2025.
In managing its business, Athene utilizes net invested assets as presented in the above table. Net invested assets do not correspond to Athene’s total investments, including related parties, on the consolidated statements of financial condition, as discussed previously in “Managing Business Performance — Key Segment and Non-U.S. GAAP Performance Measures.” Net invested assets represent Athene’s investments that directly back its net reserve liabilities and surplus assets. Athene believes this view of its portfolio provides a view of the assets for which it has economic exposure. Athene adjusts the presentation for assumed and ceded reinsurance transactions to include or exclude the underlying investments based upon the contractual transfer of economic exposure to such underlying investments. Athene also adjusts for VIEs to show the net investment in the funds, which are included in the alternative investments line above, as well as adjusting for the allowance for credit losses. Net invested assets include Athene’s proportionate share of ACRA investments, based on its economic ownership, but exclude the proportionate share of investments associated with the non-controlling interests.
Net invested assets is utilized by management to evaluate Athene’s investment portfolio. Net invested assets is used in the computation of net investment earned rate, which allows Athene to analyze the profitability of its investment portfolio. Net invested assets is also used in Athene’s risk management processes for asset purchases, product design and underwriting, stress scenarios, liquidity and ALM.
102
Principal Investing
The following table presents Principal Investing Income, the performance measure of our Principal Investing segment.
| Years ended December 31, | Total Change | Percentage Change | Years ended December 31, | Total Change | Percentage Change | ||||||||||||||||||||||||||||||||||||||||||
| (In millions, except percentages) | 2025 | 2024 | 2024 | 2023 | |||||||||||||||||||||||||||||||||||||||||||
| Principal Investing: | |||||||||||||||||||||||||||||||||||||||||||||||
| Realized performance fees | $ | 1,198 | $ | 921 | $ | 277 | 30.1% | $ | 921 | $ | 742 | $ | 179 | 24.1% | |||||||||||||||||||||||||||||||||
| Realized investment income (loss) | 95 | 74 | 21 | 28.4 | 74 | (2) | 76 | NM | |||||||||||||||||||||||||||||||||||||||
| Principal investing compensation | (892) | (664) | 228 | 34.3 | (664) | (601) | 63 | 10.5 | |||||||||||||||||||||||||||||||||||||||
| Other operating expenses | (63) | (60) | 3 | 5.0 | (60) | (56) | 4 | 7.1 | |||||||||||||||||||||||||||||||||||||||
| Principal Investing Income (PII) | $ | 338 | $ | 271 | $ | 67 | 24.7% | $ | 271 | $ | 83 | $ | 188 | 226.5% | |||||||||||||||||||||||||||||||||
As described in “Item 7. Management’s Discussion and Analysis of Financial Condition and Results of Operations—General”, earnings from our Principal Investing segment are inherently more volatile in nature than earnings from our Asset Management segment due to the intrinsic cyclical nature of performance fees, one of the key drivers of PII performance.
A discussion of our Principal Investing segment analysis for the year ended December 31, 2024 as compared to the year ended December 31, 2023 is included in the Company’s 2024 Annual Report.
Year Ended December 31, 2025 Compared to the Year Ended December 31, 2024
In this section, references to 2025 refer to the year ended December 31, 2025 and references to 2024 refer to the year ended December 31, 2024.
PII was $338 million in 2025, an increase of $67 million, as compared to $271 million in 2024. This increase was primarily attributable to increases in realized performance fees and realized investment income of $277 million and $21 million, respectively, partially offset by an increase in principal investing compensation expense of $228 million.
The increase in realized performance fees of $277 million in 2025 was primarily driven by an increase in realized performance fees generated from Fund X, HVF II and Accord+, partially offset by a decrease in realized performance fees earned from Freedom Parent Holdings and Fund IX.
The increase in realized investment income of $21 million in 2025 was primarily attributable to realized gains from the partial sale of the Company’s investment in Global Business Travel Group, Inc.
Principal investing compensation expense of $892 million in 2025 increased $228 million, as compared to $664 million in 2024. The increase in 2025 was primarily due to an increase in profit sharing expense corresponding to the increase in realized performance fees. In any period, the blended profit sharing percentage is impacted by the respective profit sharing ratios of the funds generating performance allocations in the period. The increase in 2025 was also driven by profit sharing expense attributable to the Company’s other incentive compensation plans through which certain employees are allocated discretionary compensation based on realized performance fees in a given year, and are included within principal investing compensation. These incentive plans are separate from the fund related profit sharing expense and may result in greater variability in compensation and have a variable impact on the blended profit sharing percentage during a particular period.
103
The Historical Investment Performance of Our Funds
Below we present information relating to the historical performance of the funds we manage, including certain legacy Apollo funds that do not have a meaningful amount of unrealized investments, and in respect of which the general partner interest has not been contributed to us.
When considering the data presented below, you should note that the historical results of funds we manage are not indicative of the future results that you should expect from such funds, from any future funds we may raise or from your investment in our common stock.
An investment in our common stock is not an investment in any of the Apollo managed funds, and the assets and revenues of the funds we manage are not directly available to us. The historical and potential future returns of the funds we manage are not directly linked to returns on our common stock. Therefore, you should not conclude that continued positive performance of the funds we manage will necessarily result in positive returns on an investment in our common stock. However, poor performance of the funds that we manage would cause a decline in our revenue from such funds, and would therefore have a negative effect on our performance and in all likelihood the value of our common stock.
Moreover, the historical returns of funds we manage should not be considered indicative of the future results you should expect from such funds or from any future funds we may raise. There can be no assurance that any Apollo fund will continue to achieve the same results in the future.
Finally, our private equity IRRs have historically varied greatly from fund to fund. For example, Fund VI generated a 12% gross IRR and a 9% net IRR since its inception through December 31, 2025, while Fund V generated a 61% gross IRR and a 44% net IRR since its inception through its liquidation in 2023. Accordingly, the IRR going forward for any current or future fund may vary considerably from the historical IRR generated by any particular fund, or for our private equity funds as a whole. Future returns will also be affected by the applicable risks, including risks of the industries and businesses in which a particular fund invests. See “Item 1A. Risk Factors—Risks Relating to Our Asset Management Business—“Historical performance metrics are unreliable indicators of our current or future results of operations.”
104
Investment Record
The following table summarizes the investment record by strategy of Apollo’s significant commitment-based funds that have a defined maturity date in which investors make a commitment to provide capital at the formation of such funds and deliver capital when called as investment opportunities become available. All amounts are as of December 31, 2025, unless otherwise noted.
| (In millions, except IRR) | Vintage Year | Total AUM | Committed Capital | Total Invested Capital | Realized Value | Remaining Cost | Unrealized Value | Total Value | Gross IRR | Net IRR | |||||||||||||||||||||||||||||||||||||||||||||||||
| Credit: | |||||||||||||||||||||||||||||||||||||||||||||||||||||||||||
Accord VII1,5 | N/A | $ | 1,531 | $ | 1,383 | $ | 40 | $ | — | $ | 40 | $ | 40 | $ | 40 | NM4 | NM4 | ||||||||||||||||||||||||||||||||||||||||||
Accord I, II, III, III B, IV, V & VI1 | Various | 608 | 9,693 | 7,455 | 7,974 | — | — | 7,974 | 18 | % | 13 | % | |||||||||||||||||||||||||||||||||||||||||||||||
| Accord+ II | 2025 | 5,469 | 4,796 | 5,266 | 1,977 | 3,570 | 3,747 | 5,724 | NM4 | NM4 | |||||||||||||||||||||||||||||||||||||||||||||||||
| Accord+ | 2021 | 2,476 | 2,370 | 7,062 | 8,006 | 8 | 32 | 8,038 | 14 | 11 | |||||||||||||||||||||||||||||||||||||||||||||||||
| ADIP II | 2024 | 7,061 | 6,016 | 3,069 | — | 3,069 | 3,875 | 3,875 | 20 | 14 | |||||||||||||||||||||||||||||||||||||||||||||||||
| ADIP I | 2020 | 5,303 | 3,254 | 2,620 | 2,014 | 2,438 | 3,010 | 5,024 | 21 | 18 | |||||||||||||||||||||||||||||||||||||||||||||||||
| EPF IV | 2023 | 3,267 | 3,146 | 1,851 | 836 | 1,213 | 1,386 | 2,222 | 16 | 10 | |||||||||||||||||||||||||||||||||||||||||||||||||
| EPF III | 2017 | 2,070 | 4,580 | 5,146 | 4,822 | 1,347 | 1,152 | 5,974 | 6 | 1 | |||||||||||||||||||||||||||||||||||||||||||||||||
| Total Credit | $ | 27,785 | $ | 35,238 | $ | 32,509 | $ | 25,629 | $ | 11,685 | $ | 13,242 | $ | 38,871 | |||||||||||||||||||||||||||||||||||||||||||||
| Equity: | |||||||||||||||||||||||||||||||||||||||||||||||||||||||||||
| Fund X | 2023 | $ | 23,014 | $ | 19,877 | $ | 10,765 | $ | 3,319 | $ | 8,670 | $ | 11,938 | $ | 15,257 | 36 | % | 22 | % | ||||||||||||||||||||||||||||||||||||||||
| Fund IX | 2018 | 28,303 | 24,729 | 23,236 | 17,304 | 15,923 | 23,556 | 40,860 | 22 | 15 | |||||||||||||||||||||||||||||||||||||||||||||||||
| Fund VIII | 2013 | 5,410 | 18,377 | 16,926 | 24,516 | 3,370 | 3,602 | 28,118 | 13 | 9 | |||||||||||||||||||||||||||||||||||||||||||||||||
| Fund VII | 2008 | — | 14,677 | 16,461 | 34,294 | — | — | 34,294 | 33 | 25 | |||||||||||||||||||||||||||||||||||||||||||||||||
| Fund VI | 2006 | 377 | 10,136 | 12,457 | 21,136 | 405 | — | 21,136 | 12 | 9 | |||||||||||||||||||||||||||||||||||||||||||||||||
| Fund V | 2001 | — | 3,742 | 5,192 | 12,724 | — | — | 12,724 | 61 | 44 | |||||||||||||||||||||||||||||||||||||||||||||||||
Fund I, II, III, IV & MIA2 | Various | 8 | 7,320 | 8,753 | 17,400 | — | — | 17,400 | 39 | 26 | |||||||||||||||||||||||||||||||||||||||||||||||||
Traditional Private Equity Funds3 | $ | 57,112 | $ | 98,858 | $ | 93,790 | $ | 130,693 | $ | 28,368 | $ | 39,096 | $ | 169,789 | 39 | 24 | |||||||||||||||||||||||||||||||||||||||||||
| AIOF III | 2024 | 2,455 | 2,399 | 669 | — | 669 | 811 | 811 | NM4 | NM4 | |||||||||||||||||||||||||||||||||||||||||||||||||
| AIOF II | 2020 | 2,788 | 2,542 | 2,434 | 1,153 | 1,652 | 2,049 | 3,202 | 14 | 9 | |||||||||||||||||||||||||||||||||||||||||||||||||
| AIOF I | 2018 | 15 | 897 | 803 | 1,280 | — | — | 1,280 | 22 | 16 | |||||||||||||||||||||||||||||||||||||||||||||||||
HVF III5 | N/A | 4,107 | 4,128 | 446 | — | 446 | 446 | 446 | NM4 | NM4 | |||||||||||||||||||||||||||||||||||||||||||||||||
| HVF II | 2022 | 5,614 | 4,592 | 4,821 | 1,444 | 4,030 | 5,204 | 6,648 | 16 | 13 | |||||||||||||||||||||||||||||||||||||||||||||||||
| HVF I | 2019 | 2,000 | 3,238 | 3,711 | 4,593 | 804 | 1,313 | 5,906 | 21 | 17 | |||||||||||||||||||||||||||||||||||||||||||||||||
| Total Equity | $ | 74,091 | $ | 116,654 | $ | 106,674 | $ | 139,163 | $ | 35,969 | $ | 48,919 | $ | 188,082 | |||||||||||||||||||||||||||||||||||||||||||||
1 Accord funds have investment periods shorter than 24 months, therefore Gross and Net IRR are presented after 12 months of investing. | |||||||||||||||||||||||||||||||||||||||||||||||||||||||||||
2 The general partners and managers of Funds I, II and MIA, as well as the general partner of Fund III, were excluded assets in connection with the reorganization of the Company that occurred in 2007. As a result, Apollo did not receive the economics associated with these entities. The investment performance of these funds, combined with Fund IV, is presented to illustrate fund performance associated with Apollo’s investment professionals. | |||||||||||||||||||||||||||||||||||||||||||||||||||||||||||
3 Total IRR is calculated based on total cash flows for all funds presented. | |||||||||||||||||||||||||||||||||||||||||||||||||||||||||||
4 Data has not been presented as the fund’s effective date is less than 24 months prior to the period indicated and such information was deemed not meaningful. | |||||||||||||||||||||||||||||||||||||||||||||||||||||||||||
5 Vintage Year is not yet applicable as the fund has not had its final closing. | |||||||||||||||||||||||||||||||||||||||||||||||||||||||||||
105
Equity
The following tables provide additional detail on the composition of the Fund X, Fund IX and Fund VIII private equity portfolios based on investment strategy as of December 31, 2025:
Fund X
| (In millions) | Total Invested Capital | Total Value | |||||||||
| Corporate Carve-outs | $ | 2,904 | $ | 3,846 | |||||||
| Opportunistic Buyouts | 7,572 | 10,208 | |||||||||
Deleveraging Investment1 | 289 | 1,203 | |||||||||
| Total | $ | 10,765 | $ | 15,257 | |||||||
Fund IX
| (In millions) | Total Invested Capital | Total Value | |||||||||
| Corporate Carve-outs | $ | 6,368 | $ | 12,220 | |||||||
| Opportunistic Buyouts | 15,081 | 23,856 | |||||||||
Deleveraging Investment1 | 1,787 | 4,784 | |||||||||
| Total | $ | 23,236 | $ | 40,860 | |||||||
Fund VIII
| (In millions) | Total Invested Capital | Total Value | |||||||||
| Corporate Carve-outs | $ | 3,122 | $ | 7,299 | |||||||
| Opportunistic Buyouts | 13,236 | 20,065 | |||||||||
Deleveraging Investment1 | 568 | 754 | |||||||||
| Total | $ | 16,926 | $ | 28,118 | |||||||
1 The deleveraging investment strategy includes deleveraging for control, non-control deleveraging and other credit. Other credit is defined as investments in debt securities of issuers other than portfolio companies that are not considered to be deleveraging. | |||||||||||
106
Perpetual Capital
The following table summarizes the investment record for the perpetual capital vehicles we manage, excluding Athene and Athora-related assets.
| Total Returns | |||||||||||||||||||||||
| (In millions) | IPO Year1 | Total AUM | For the Year Ended December 31, 2025 | For the Year Ended December 31, 2024 | |||||||||||||||||||
ADS2 | N/A | $ | 27,656 | 8 | % | 11 | % | ||||||||||||||||
MidCap FinCo3 | N/A | 13,152 | 15 | % | 18 | % | |||||||||||||||||
ARI4,5 | 2009 | 9,572 | 23 | % | (8) | % | |||||||||||||||||
MFIC4,5 | 2004 | 3,865 | (4) | % | 11 | % | |||||||||||||||||
ADREF6 | N/A | 4,769 | 1 | % | 4 | % | |||||||||||||||||
ADCF6 | N/A | 2,353 | 10 | % | 12 | % | |||||||||||||||||
ARIS6 | N/A | 2,081 | 6 | % | 6 | % | |||||||||||||||||
Other7 | N/A | 22,807 | N/A | N/A | |||||||||||||||||||
| Total | $ | 86,255 | |||||||||||||||||||||
1 An IPO year represents the year in which the vehicle commenced trading on a national securities exchange. | |||||||||||||||||||||||
2 ADS is not a publicly traded vehicle and therefore IPO year is not applicable. The returns presented are net returns based on NAV. | |||||||||||||||||||||||
3 MidCap FinCo is not a publicly traded vehicle and therefore IPO year is not applicable. The returns presented are a gross return based on NAV. The net returns based on NAV were 13% and 15% for the years ended December 31, 2025 and 2024, respectively. | |||||||||||||||||||||||
4 Total returns are based on the change in closing trading prices during the respective periods presented taking into account dividends and distributions, if any, as if they were reinvested without regard to commission. | |||||||||||||||||||||||
5 AUM is presented on a three-month lag, as of September 30, 2025, based upon the availability of the information. | |||||||||||||||||||||||
6 ADREF, ADCF and ARIS are not publicly traded vehicles and therefore IPO years are not applicable. The returns presented are for their respective Class I shares and are net returns based on NAV. | |||||||||||||||||||||||
7 Other includes, among others, AUM of $1.9 billion related to a publicly traded business development company from which Apollo earns investment-related service fees, but for which Apollo does not provide management or advisory services, as of September 30, 2025. Returns and IPO year are not provided for these AUM. Other also includes AUM of $11.0 billion and $3 billion related to third-party capital within AAA and Bridge funds, respectively. | |||||||||||||||||||||||
107
Summary of Non-U.S. GAAP Measures
The table below sets forth a reconciliation of net income attributable to Apollo Global Management, Inc. common stockholders to Segment Income and Adjusted Net Income:
| Years ended December 31, | |||||||||||||||||
| (In millions) | 2025 | 2024 | 2023 | ||||||||||||||
| GAAP Net Income (Loss) Attributable to Apollo Global Management, Inc. | $ | 3,395 | $ | 4,480 | $ | 5,001 | |||||||||||
| Preferred dividends | 97 | 97 | 46 | ||||||||||||||
| Net income (loss) attributable to non-controlling interests | 1,909 | 1,796 | 1,462 | ||||||||||||||
| GAAP Net Income (Loss) | 5,401 | 6,373 | 6,509 | ||||||||||||||
| Income tax provision (benefit) | 1,276 | 1,062 | (923) | ||||||||||||||
| GAAP Income (Loss) Before Income Tax Provision (Benefit) | 6,677 | 7,435 | 5,586 | ||||||||||||||
| Asset Management Adjustments: | |||||||||||||||||
Equity-based profit sharing expense1 | 211 | 321 | 239 | ||||||||||||||
| Equity-based compensation | 439 | 308 | 662 | ||||||||||||||
| Net (income) loss attributable to non-controlling interests in consolidated entities | (2,157) | (1,840) | (1,556) | ||||||||||||||
| Unrealized performance fees | 64 | (264) | (127) | ||||||||||||||
| Unrealized profit sharing expense | (34) | 145 | 179 | ||||||||||||||
HoldCo interest and other financing costs2 | 143 | 80 | 88 | ||||||||||||||
| Unrealized principal investment (income) loss | (25) | 9 | (88) | ||||||||||||||
| Unrealized net (gains) losses from investment activities | 362 | (46) | (37) | ||||||||||||||
Transaction-related costs, restructuring and other non-operating expenses3 | 487 | 184 | 147 | ||||||||||||||
| Retirement Services Adjustments: | |||||||||||||||||
| Investment (gains) losses, net of offsets | (19) | (217) | (170) | ||||||||||||||
Non-operating change in insurance liabilities and related derivatives4 | (91) | (846) | (182) | ||||||||||||||
| Integration, restructuring and other non-operating items | 121 | 239 | 130 | ||||||||||||||
| Equity-based compensation | 49 | 50 | 88 | ||||||||||||||
| Segment Income | 6,227 | 5,558 | 4,959 | ||||||||||||||
HoldCo interest and other financing costs2 | (143) | (80) | (88) | ||||||||||||||
| Taxes and related payables | (889) | (913) | (789) | ||||||||||||||
| Adjusted Net Income | $ | 5,195 | $ | 4,565 | $ | 4,082 | |||||||||||
1 Equity-based profit sharing expense includes stock-based grants that are tied to realized performance within the Principal Investing segment. | |||||||||||||||||
2 Represents interest and other financing costs related to AGM not attributable to any specific segment. | |||||||||||||||||
3 Transaction-related costs, restructuring and other non-operating expenses includes; (a) contingent consideration, certain equity-based charges, amortization of intangible assets and certain other expenses associated with acquisitions; (b) gains (losses) from changes in the tax receivable agreement liability; (c) merger-related transaction and integration costs associated with the Company’s merger with Athene; and (d) other non-operating expenses, including the issuance of shares of AGM common stock for charitable contributions. In the year ended December 31, 2025, other non-operating expenses includes $200 million in charitable contributions related to the issuance of shares to the Apollo DAF in February 2025. | |||||||||||||||||
4 Includes change in fair values of derivatives and embedded derivatives, non-operating change in funding agreements, change in fair value of market risk benefits, and non-operating change in liability for future policy benefits. | |||||||||||||||||
108
The table below sets forth a reconciliation of common stock outstanding to our Adjusted Net Income Shares Outstanding:
| December 31, 2025 | December 31, 2024 | ||||||||||
| Total GAAP Common Stock Outstanding | 578,981,398 | 565,738,933 | |||||||||
| Non-GAAP Adjustments: | |||||||||||
Mandatory Convertible Preferred Stock1 | 14,564,883 | 14,536,019 | |||||||||
| Vested RSUs | 19,437,942 | 21,337,132 | |||||||||
| Unvested RSUs Eligible for Dividend Equivalents | 10,518,154 | 11,455,245 | |||||||||
| Adjusted Net Income Shares Outstanding | 623,502,377 | 613,067,329 | |||||||||
1 Reflects the number of shares of underlying common stock assumed to be issuable upon conversion of the Mandatory Convertible Preferred Stock during each period. | |||||||||||
The table below sets forth a reconciliation of Athene’s total investments, including related parties, to net invested assets:
| (In millions) | December 31, 2025 | December 31, 2024 | |||||||||
| Total investments, including related parties | $ | 356,060 | $ | 291,167 | |||||||
| Derivative assets | (9,190) | (8,154) | |||||||||
| Cash and cash equivalents (including restricted cash) | 16,326 | 13,676 | |||||||||
| Accrued investment income | 3,395 | 2,816 | |||||||||
| Net receivable (payable) for collateral on derivatives | (3,458) | (4,602) | |||||||||
| Reinsurance impacts | (6,350) | (4,435) | |||||||||
| VIE and VOE assets, liabilities and non-controlling interests | 19,420 | 17,613 | |||||||||
| Unrealized (gains) losses | 10,002 | 18,320 | |||||||||
| Ceded policy loans | (160) | (167) | |||||||||
| Net investment receivables (payables) | 217 | 97 | |||||||||
| Allowance for credit losses | 763 | 720 | |||||||||
| Other investments | (52) | (87) | |||||||||
| Total adjustments to arrive at gross invested assets | 30,913 | 35,797 | |||||||||
| Gross invested assets | 386,973 | 326,964 | |||||||||
| ACRA non-controlling interests | (94,559) | (78,321) | |||||||||
| Net invested assets | $ | 292,414 | $ | 248,643 | |||||||
Liquidity and Capital Resources
Overview
The Company primarily derives revenues and cash flows from the assets it manages and the retirement savings products it issues, reinsures and acquires. Based on management’s experience, we believe the Company’s current liquidity position, together with the cash generated from revenues will be sufficient to meet the Company’s anticipated expenses and other working capital needs for at least the next 12 months. For the longer-term liquidity needs of the asset management business, we expect to continue to fund the asset management business’ operations through management fees and performance fees received. The principal sources of liquidity for the retirement services business, in the ordinary course of business, are operating cash flows and holdings of cash, cash equivalents and other readily marketable assets.
AGM is a holding company whose primary source of cash flow is distributions and other intercompany transfers from its subsidiaries, which are expected to be sufficient to fund cash flow requirements based on current estimates of future obligations. AGM’s primary liquidity needs include the cash-flow requirements relating to its corporate activities, including its day-to-day operations, common stock and preferred stock dividend payments and strategic transactions, such as acquisitions.
At December 31, 2025, the Company had $18.3 billion of unrestricted cash and cash equivalents, as well as $5.1 billion of available funds from the AGM credit facility, AHL credit facility and AHL liquidity facility.
109
Primary Uses of Cash
Over the next 12 months, we expect the Company’s primary liquidity needs will be to:
•support the future growth of Apollo’s businesses through strategic corporate investments;
•pay the Company’s operating expenses, including, compensation, general, administrative, and other expenses;
•make payments to policyholders for surrenders, withdrawals and payout benefits;
•make interest and principal payments on funding agreements;
•make payments to satisfy pension group annuity obligations and policy acquisition costs;
•make interest and principal payments on the Company’s debt;
•pay taxes and tax related payments;
•pay cash dividends;
•repurchase common stock; and
•make payments under the tax receivable agreements.
Over the long term, we believe we will be able to (i) grow Apollo’s Assets Under Management and generate positive investment performance in the funds we manage, which we expect will allow us to grow the Company’s management fees and performance fees and (ii) grow the investment portfolio of retirement services, in each case in amounts sufficient to cover our long-term liquidity requirements, which may include:
•supporting the future growth of our businesses;
•creating new or enhancing existing products and investment platforms;
•making payments to policyholders;
•pursuing new strategic corporate investment opportunities;
•paying interest and principal on the Company’s financing arrangements;
•repurchasing common stock;
•making payments under the tax receivable agreements; and
•paying cash dividends.
Cash Flow Analysis
The section below discusses in more detail the Company’s primary sources and uses of cash and the primary drivers of cash flows within the Company’s consolidated statements of cash flows:
| Years ended December 31, | |||||||||||||||||
| (In millions) | 2025 | 2024 | 2023 | ||||||||||||||
| Operating Activities | $ | 7,246 | $ | 3,253 | $ | 6,322 | |||||||||||
| Investing Activities | (63,972) | (61,801) | (42,407) | ||||||||||||||
| Financing Activities | 60,200 | 57,972 | 42,638 | ||||||||||||||
| Effect of exchange rate changes on cash and cash equivalents | 5 | (3) | 10 | ||||||||||||||
| Net increase (decrease) in cash and cash equivalents, restricted cash and cash held at consolidated variable interest entities | $ | 3,479 | $ | (579) | $ | 6,563 | |||||||||||
110
The assets of our consolidated funds and VIEs, on a gross basis, could have a substantial effect on the accompanying statement of cash flows. Because our consolidated funds and VIEs are generally treated as investment companies for accounting purposes, their investing cash flow amounts are included in our cash flows from operating activities. The table below summarizes our consolidated statements of cash flow by activity attributable to the Company and to our consolidated funds and VIEs.
| Years ended December 31, | |||||||||||||||||
| (In millions) | 2025 | 2024 | 2023 | ||||||||||||||
| Net cash provided by the Company's operating activities | $ | 7,263 | $ | 3,781 | $ | 6,519 | |||||||||||
| Net cash used in the Consolidated Funds and VIEs operating activities | (17) | (528) | (197) | ||||||||||||||
| Net cash provided by operating activities | 7,246 | 3,253 | 6,322 | ||||||||||||||
| Net cash used in the Company's investing activities | (62,250) | (60,547) | (39,834) | ||||||||||||||
| Net cash used in the Consolidated Funds and VIEs investing activities | (1,722) | (1,254) | (2,573) | ||||||||||||||
| Net cash used in investing activities | (63,972) | (61,801) | (42,407) | ||||||||||||||
| Net cash provided by the Company's financing activities | 58,010 | 55,577 | 42,021 | ||||||||||||||
| Net cash provided by the Consolidated Funds and VIEs financing activities | 2,190 | 2,395 | 617 | ||||||||||||||
| Net cash provided by financing activities | $ | 60,200 | $ | 57,972 | $ | 42,638 | |||||||||||
Operating Activities
The Company’s operating activities support its Asset Management, Retirement Services and Principal Investing activities. The primary sources of cash within operating activities include: (a) management fees, (b) advisory and transaction fees, (c) realized performance revenues, (d) realized principal investment income, (e) investment sales from our consolidated funds and VIEs, (f) net investment income and (g) insurance premiums. The primary uses of cash within operating activities include: (a) compensation and non-compensation related expenses, (b) interest and taxes, (c) investment purchases from our consolidated funds and VIEs, (d) benefit payments and (e) other operating expenses.
•During the year ended December 31, 2025, cash provided by operating activities reflects cash inflows of management fees, advisory and transaction fees, realized performance revenues, realized principal investment income, net investment income and premium received from both a whole life block reinsurance transaction and pension group annuity transaction, partially offset by cash paid for pension group annuity and other payout annuity benefits, interest on funding agreements and debt, policy acquisition expenses and other operating expenses. Net cash used in operating activities includes net cash used by our consolidated funds and VIEs, which primarily includes net purchases of VIE investments, partially offset by proceeds from the sale of VIE investments.
•During the year ended December 31, 2024, cash provided by operating activities reflects cash inflows of management fees, advisory and transaction fees, realized performance revenues, realized principal investment income, and net investment income, partially offset by pension group annuity benefit payments, net of cash inflows, and cash paid for interest on funding agreements, taxes, policy acquisition costs and other operating expenses. Net cash provided by operating activities includes net cash used in our consolidated funds and VIEs, which primarily includes purchases of VIEs’ investments offset by net proceeds from the sale of VIEs’ investments.
•During the year ended December 31, 2023, cash provided by operating activities reflects cash inflows of management fees, advisory and transaction fees, realized performance revenues, realized principal investment income, cash received from pension group annuity premiums, net of outflows, and net investment income, partially offset by cash paid for policy acquisition and other operating expenses. Net cash provided by operating activities includes net cash used in our consolidated funds and VIEs, which primarily includes purchases of VIEs’ investments, offset by net proceeds from the sale of VIEs’ investments.
Investing Activities
The Company’s investing activities support the growth of its business. The primary sources of cash within investing activities include: (a) distributions from investments and (b) sales, maturities and repayments of investments. The primary uses of cash within investing activities include: (a) capital expenditures, (b) purchases and acquisitions of new investments, including purchases of U.S. Treasury securities and (c) equity method investments in the funds we manage.
111
•During the year ended December 31, 2025, cash used in investing activities primarily reflects the purchase of investments, mainly AFS and mortgage loans, due to the deployment of significant cash inflows from Athene’s strong growth, an increase in cash collateral posted by Athene for derivative transactions and cash paid for the settlement of derivatives, partially offset by the sales, maturities and repayments of investments.
•During the year ended December 31, 2024, cash used in investing activities primarily reflects the purchase of investments, mainly AFS and mortgage loans, due to the deployment of significant cash inflows from Athene’s organic growth, partially offset by the sales, maturities and repayments of investments.
•During the year ended December 31, 2023, cash used in investing activities primarily reflects the purchase of investments due to the deployment of significant cash inflows from Athene’s organic growth, partially offset by the sales, maturities and repayments of investments.
Financing Activities
The Company’s financing activities reflect its capital market transactions and transactions with equity holders. The primary sources of cash within financing activities includes: (a) proceeds from debt and preferred equity issuances, (b) inflows on Athene’s investment-type policies and contracts, (c) changes of cash collateral for derivative transactions posted by counterparties, (d) capital contributions, and (e) proceeds from other borrowing activities. The primary uses of cash within financing activities include: (a) dividends, (b) payments under the tax receivable agreement, (c) share repurchases, (d) cash paid to settle tax withholding obligations in connection with net share settlements of equity-based awards, (e) repayments of debt, (f) withdrawals on Athene’s investment-type policies and contracts, (g) changes of cash collateral for derivative transactions posted by counterparties and (h) capital distributions.
•During the year ended December 31, 2025, cash provided by financing activities primarily reflects cash received from deferred annuity, funding agreement and guaranteed investment contract inflows, net of cash outflows, net capital contributions and cash proceeds from the issuance of long-term debt and repurchase agreements, partially offset by the repayment of debt, the payment of common and preferred stock dividends and cash paid for the redemption of Athene’s Series C preferred stock. Cash provided by financing activities of our consolidated funds and VIEs primarily includes proceeds from the issuance of debt and contributions from non-controlling interests, partially offset by repayment of debt and distributions to non-controlling interests.
•During the year ended December 31, 2024, cash provided by financing activities primarily reflects cash received from strong retail and funding agreement inflows, net of cash outflows, a favorable change in cash collateral posted by counterparties for derivative transactions related to the favorable equity market performance in 2024, issuances of debt by AGM and our subsidiaries, net capital contributions from non-controlling interests and the issuance of short-term repurchase agreements, net of the repayment of a long-term repurchase agreement, partially offset by the payment of common and preferred stock dividends, repurchases of common stock and repayments of debt. Cash provided by financing activities of our consolidated funds and VIEs primarily includes proceeds from the issuance of debt and contributions from non-controlling interests, partially offset by repayment of debt and distributions to non-controlling interests.
•During the year ended December 31, 2023, cash provided by financing activities primarily reflects cash received from the strong organic inflows from retail, flow reinsurance and funding agreements, net of outflows, a favorable change in cash collateral posted for derivative transactions related to the favorable equity market performance in 2023, net capital contributions from non-controlling interests, issuances of the 2053 Subordinated Notes, 2033 Senior Notes and Mandatory Convertible Preferred Stock, and the issuance of debt by our subsidiary, partially offset by the redemption of the AAM Preferred Stock, the payment of stock dividends, the repayment of short-term repurchase obligations and distribution to redeemable non-controlling interest. Cash provided by financing activities of our consolidated funds and VIEs primarily includes proceeds from the issuance of debt, offset by payments for borrowings under repurchase agreements.
Contractual Obligations, Commitments and Contingencies
For a summary and a description of the nature of the Company’s commitments, contingencies and contractual obligations, see note 19 to the consolidated financial statements and “—Contractual Obligations, Commitments and Contingencies.” The Company’s commitments are primarily fulfilled through cash flows from operations and financing activities.
112
Consolidated Funds and VIEs
The Company manages its liquidity needs by evaluating unconsolidated cash flows; however, the Company’s financial statements reflect the financial position of Apollo as well as Apollo’s consolidated funds and VIEs. The primary sources and uses of cash at Apollo’s consolidated funds and VIEs include: (a) raising capital from their investors, which have been reflected historically as non-controlling interests of the consolidated subsidiaries in our financial statements, (b) using capital to make investments, (c) generating cash flows from operations through distributions, interest and the realization of investments, (d) distributing cash flow to investors, and (e) issuing debt to finance investments (CLOs).
Dividends and Distributions
For information regarding the quarterly dividends that were made to common stockholders and distribution equivalents on participating securities, see note 16 to the consolidated financial statements. Although the Company currently expects to pay dividends, we may not pay dividends if, among other things, we do not have the cash necessary to pay the dividends. To the extent we do not have cash on hand sufficient to pay dividends, we may have to borrow funds to pay dividends, or we may determine not to pay dividends. The declaration, payment and determination of the amount of our dividends are at the sole discretion of the AGM board of directors.
Because AGM is a holding company, the primary source of funds for AGM’s dividends is distributions and other intercompany transfers from its operating subsidiaries, AAM and AHL, which are expected to be adequate to fund AGM’s dividends and other cash flow requirements based on current estimates of future obligations. The ability of these operating subsidiaries to make distributions to AGM will depend on satisfying applicable law with respect to such distributions, including surplus and minimum solvency requirements among others, as well as making prior distributions on AHL outstanding preferred stock. Moreover, the ability of AAM and AHL to receive distributions from their own respective subsidiaries will continue to depend on applicable law with respect to such distributions.
On February 9, 2026, AGM declared a cash dividend of $0.51 per share of its common stock, which will be paid on February 27, 2026 to holders of record at the close of business on February 19, 2026.
On February 9, 2026, the Company also declared and set aside a cash dividend of $0.8438 per share of its Mandatory Convertible Preferred Stock, which will be paid on April 30, 2026 to holders of record at the close of business on April 15, 2026.
Repurchase of Securities
Share Repurchase Program
For information regarding the Company’s share repurchase program, see note 16 to the consolidated financial statements.
Repurchase of Other Securities
We may from time to time seek to retire or purchase our other outstanding debt or equity securities through cash purchases and/or exchanges for other securities, purchases in the open market, privately negotiated transactions or otherwise. Any such repurchases will be dependent upon several factors, including our liquidity requirements, contractual restrictions, general market conditions and applicable regulatory, legal and accounting factors. Whether or not we repurchase any of our other securities and the size and timing of any such repurchases will be determined at our discretion.
Mandatory Convertible Preferred Stock
On August 11, 2023, the Company issued 28,750,000 shares, or $1.4 billion aggregate liquidation preference, of its 6.75% Series A Mandatory Convertible Preferred Stock. There were 28,749,665 shares of Mandatory Convertible Preferred Stock issued and outstanding as of December 31, 2025. See note 16 to the consolidated financial statements for further details.
113
Asset Management Liquidity
Our asset management business requires limited capital resources to support the working capital or operating needs of the business. For the asset management business’ longer-term liquidity needs, we expect to continue to fund the asset management business’ operations through management fees and performance fees received. Liquidity needs are also met (to a limited extent) through proceeds from borrowings and equity issuances as described in notes 14 and 16 to the consolidated financial statements, respectively. From time to time, if the Company determines that market conditions are favorable after taking into account our liquidity requirements, we may seek to raise proceeds through the issuance of additional debt or equity instruments. AGM has a registration statement on Form S-3 to provide it with access to the capital markets, subject to market conditions and other factors.
At December 31, 2025, the asset management business had $3.4 billion of unrestricted cash and cash equivalents, as well as $1.25 billion of available funds from the AGM credit facility.
Future Debt Obligations
The asset management business had debt of $5.5 billion at December 31, 2025, which includes notes with various maturities from 2026 through 2054. See note 14 to the consolidated financial statements for further information regarding the asset management business’ debt arrangements.
Future Cash Flows
Our ability to execute our business strategy, particularly our ability to increase our AUM, depends on our ability to establish new funds and to raise additional investor capital within such funds. Our liquidity will depend on a number of factors, such as our ability to project our financial performance, which is highly dependent on the funds we manage and our ability to manage our projected costs, fund performance, access to credit facilities, compliance with existing credit agreements, as well as industry and market trends. Also during economic downturns the funds we manage might experience cash flow issues or liquidate entirely. In these situations we might be asked to reduce or eliminate the management fee and performance fees we charge, which could adversely impact our cash flow in the future.
An increase in the fair value of the investments of the funds we manage, by contrast, could favorably impact our liquidity through higher management fees where the management fees are calculated based on the net asset value, gross assets or adjusted assets. Additionally, higher performance fees not yet realized would generally result when investments appreciate over their cost basis which would not have an impact on the asset management business’ cash flow until realized.
Consideration of Financing Arrangements
As noted above, in limited circumstances, the asset management business may issue debt or equity to supplement its liquidity. The decision to enter into a particular financing arrangement is made after careful consideration of various factors, including the asset management business’ cash flows from operations, future cash needs, current sources of liquidity, demand for the asset management business’ debt or equity, and prevailing interest rates.
Revolver Facility
Under the AGM credit facility, AGM and AMH, as parent borrower and subsidiary borrower, respectively, may borrow in an aggregate amount not to exceed $1.25 billion and may incur incremental facilities in an aggregate amount not to exceed $250 million plus additional amounts so long as AGM and AMH are in compliance with a net leverage ratio not to exceed 4.00 to 1.00. Borrowings under the AGM credit facility may be used for working capital and general corporate purposes, including without limitation, permitted acquisitions. The AGM credit facility has a final maturity date of November 21, 2029.
Tax Receivable Agreements
The Apollo TRA provides for the payment to the Former Managing Partners and Contributing Partners of 85% of the amount of cash savings, if any, in U.S. federal, state, local and foreign income taxes that AGM and its subsidiaries realize as a result of the increases in tax basis of assets resulting from exchanges of AOG Units for Class A shares that occurred in prior years. The Bridge TRA provides for the payment to Bridge TRA holders based on 85% of the tax benefits realized from the Bridge acquisition. For more information regarding the tax receivable agreements, see note 18 to the consolidated financial statements.
114
Athora
Athora is a strategic liabilities platform that acquires and reinsures traditional closed life insurance policies and provides capital and reinsurance solutions to insurers in Europe. In 2017, an AAM subsidiary made a €125 million commitment to Athora, which was fully drawn as of April 2020. An AAM subsidiary committed an incremental €58 million in 2020 to purchase new equity interests. Additionally, in 2021, an AAM subsidiary acquired approximately €21.9 million of new equity interests in Athora.
In December 2021, an AAM subsidiary committed an additional €250 million to purchase new equity interests to support Athora’s ongoing growth initiatives, of which €180 million was drawn as of December 31, 2025. On July 3, 2025, AAM made a conditional commitment to invest, or cause one or more of its affiliates to invest, in Athora for up to an additional $2.0 billion, in connection with the Athora transaction. The Athora transaction remains subject to closing conditions, including receipt of regulatory approvals. The amount ultimately funded pursuant to the conditional commitment, and sources of funding, are subject to change as a result of an anticipated capital raise by Athora between signing and closing of the Athora transaction.
An AAM subsidiary and Athene are minority investors in Athora with a long-term strategic relationship. Through its share ownership, the AAM subsidiary has approximately 16% of the total voting power in Athora, and Athene holds shares in Athora representing 10% of the total voting power in Athora. In addition, Athora shares held by funds and other accounts managed by Apollo represent, in the aggregate, approximately 3.9% of the total voting power in Athora. See note 18 to the consolidated financial statements for additional details on AAM’s and Athene’s conditional commitments to Athora.
Fund Escrow
As of December 31, 2025, the remaining investments and escrow cash of Fund VIII was valued at 87% of the fund’s unreturned capital, which was below the required escrow ratio of 115%. As a result, the fund is required to place in escrow current and future performance fee distributions to the general partner until the specified return ratio of 115% is met (at the time of a future distribution) or upon liquidation. Realized performance fees currently distributed to the general partner are limited to potential tax distributions and interest on escrow balances per the fund’s partnership agreement.
Clawback
Performance fees from certain of the funds we manage are subject to contingent repayment by the general partner in the event of future losses to the extent that the cumulative performance fees distributed from inception to date exceeds the amount computed as due to the general partner at the final distribution. See “—Overview of Results of Operations—Performance Fees” for the maximum performance fees subject to potential reversal by each fund.
Indemnification Liability
The asset management business recorded an indemnification liability in the event that the Former Managing Partners, Contributing Partners and certain investment professionals are required to pay amounts in connection with a general partner obligation to return previously distributed performance fees. See note 18 to the consolidated financial statements for further information regarding the asset management business’ indemnification liability.
Retirement Services Liquidity
There are two forms of liquidity relevant to our retirement services business: funding liquidity and balance sheet liquidity. Funding liquidity relates to the ability to fund operations. Balance sheet liquidity relates to the ability to sell assets held in Athene’s investment portfolio without incurring significant costs from fees, bid-offer spreads, or market impact. Athene manages its liquidity position by matching projected cash demands with adequate sources of cash and other liquid assets. The principal sources of liquidity for our retirement services business, in the ordinary course of business, are operating cash flows and holdings of cash, cash equivalents and other readily marketable assets.
Athene’s investment portfolio is structured to ensure a strong liquidity position over time to permit timely payment of policy and contract benefits without requiring asset sales at inopportune times or at depressed prices. In general, liquid assets include cash and cash equivalents, highly rated bonds, short-term investments, unaffiliated preferred stock and publicly traded common stock, all of which generally have liquid markets with a large number of buyers, but exclude pledged assets, mainly associated
115
with funding agreement and repurchase agreement liabilities. Assets included in modified coinsurance and funds withheld portfolios, including assets held in reinsurance trusts, are available to fund the benefits for the associated obligations but are restricted from other uses. Although the investment portfolio of our retirement services business does contain assets that are generally considered less liquid for liquidity monitoring purposes (primarily mortgage loans, policy loans, real estate and investment funds), there is some ability to raise cash from these assets if needed. In periods of economic downturn, Athene may seek to raise or hold additional cash and liquid assets to manage its liquidity risk and to take advantage of market dislocations as they arise.
Athene has access to additional liquidity through its AHL credit facility and AHL liquidity facility. The AHL credit facility has a borrowing capacity of $1.25 billion, subject to being increased up to $1.75 billion in total on the terms described in the AHL credit facility. The AHL credit facility has a commitment termination date of June 30, 2028, subject to up to two one-year extensions, and was undrawn as of December 31, 2025. Athene entered into a new AHL liquidity facility on June 27, 2025, which replaced its previous agreement dated as of June 28, 2024. The AHL liquidity facility has a borrowing capacity of $2.6 billion, subject to being increased up to $3.1 billion in total on the terms described in the AHL liquidity facility. The AHL liquidity facility has a commitment termination date of June 26, 2026, subject to additional 364-day extensions, and was undrawn as of December 31, 2025. Athene also has access to $2.0 billion of committed repurchase facilities. Athene has a registration statement on Form S-3 to provide it with access to the capital markets, subject to market conditions and other factors. Athene is also the counterparty to repurchase agreements with several different financial institutions, pursuant to which it may obtain short-term liquidity, to the extent available. In addition, through Athene’s membership in the FHLB, it is eligible to borrow under variable rate short-term federal funds arrangements to provide additional liquidity.
Athene proactively manages its liquidity position to meet cash needs while minimizing adverse impacts on investment returns. Athene analyzes its cash-flow liquidity over the upcoming 12 months by modeling potential demands on liquidity under a variety of scenarios, taking into account the provisions of its policies and contracts in force, its cash flow position, and the volume of cash and readily marketable securities in its portfolio.
Liquidity risk is monitored, managed and mitigated through a number of stress tests and analyses to assess Athene’s ability to meet its cash flow requirements, as well as the ability of its reinsurance and insurance subsidiaries to meet their collateral obligations, under various stress scenarios. Athene further seeks to mitigate liquidity risk by maintaining access to alternative, external sources of liquidity.
Insurance Subsidiaries’ Operating Liquidity
The primary cash flow sources for Athene’s insurance subsidiaries include retirement services product inflows (premiums and deposits), investment income, principal repayments on its investments, net transfers from separate accounts and financial product inflows. Uses of cash include investment purchases, payments to policyholders for surrenders, withdrawals and payout benefits, interest and principal payments on funding agreements and outstanding debt, payments to satisfy pension group annuity obligations, policy acquisition and general operating costs and payment of cash dividends.
Athene’s policyholder obligations are generally long-term in nature. However, policyholders may elect to withdraw some, or all, of their account value in amounts that exceed Athene’s estimates and assumptions over the life of an annuity contract. Athene includes provisions within its annuity policies, such as surrender charges and MVAs, which are intended to protect it from early withdrawals. As of December 31, 2025 and December 31, 2024, approximately 85% and 82%, respectively, of Athene’s deferred annuity liabilities were subject to penalty upon surrender. In addition, as of December 31, 2025 and December 31, 2024, approximately 69% and 66%, respectively, of policies contained MVAs that may also have the effect of limiting early withdrawals if interest rates increase but may encourage early withdrawals by effectively subsidizing a portion of surrender charges when interest rates decrease. As of December 31, 2025, approximately 36% of Athene’s net reserve liabilities were generally non-surrenderable, including buy-out pension group annuities other than those that can be withdrawn as lump sums, funding agreements and payout annuities, while 53% were subject to penalty upon surrender.
Membership in Federal Home Loan Bank
Through its membership in the FHLB, Athene is eligible to borrow under variable rate short-term federal funds arrangements to provide additional liquidity. The borrowings must be secured by eligible collateral such as mortgage loans, eligible CMBS or RMBS, government or agency securities and guaranteed loans. As of each of December 31, 2025 and December 31, 2024, Athene had no outstanding borrowings under these arrangements.
116
Athene has issued funding agreements to the FHLB. These funding agreements were issued in an investment spread strategy, consistent with other investment spread operations. As of December 31, 2025 and December 31, 2024, Athene had funding agreements outstanding with the FHLB in the aggregate principal amount of $23.3 billion and $15.6 billion, respectively.
The maximum FHLB indebtedness by a member is determined by the amount of collateral pledged and cannot exceed a specified percentage of the member’s total statutory assets dependent on the internal credit rating assigned to the member by the FHLB. As of December 31, 2025, Athene’s total maximum borrowing capacity under the FHLB facilities was limited to $66.4 billion. However, Athene’s ability to borrow under the facilities is constrained by the availability of assets that qualify as eligible collateral under the facilities and certain other limitations. Considering these limitations, as of December 31, 2025, Athene had the ability to draw up to an estimated $30.7 billion, inclusive of borrowings then outstanding. This estimate is based on Athene’s internal analysis and assumptions and may not accurately measure collateral which is ultimately acceptable to the FHLB.
Securities Repurchase Agreements
Athene engages in repurchase transactions whereby it sells fixed income securities to third parties, primarily major brokerage firms or commercial banks, with a concurrent agreement to repurchase such securities at a determined future date. Athene requires that, at all times during the term of the repurchase agreements, it maintains sufficient cash or other liquid assets to allow it to fund substantially all of the repurchase price. Proceeds received from the sale of securities pursuant to these arrangements are generally invested in short-term investments or maintained in cash, with the offsetting obligation to repurchase the security included within payables for collateral on derivatives and securities to repurchase on the consolidated statements of financial condition. As per the terms of the repurchase agreements, Athene monitors the market value of the securities sold and may be required to deliver additional collateral (which may be in the form of cash or additional securities) to the extent that the value of the securities sold decreases prior to the repurchase date.
As of December 31, 2025 and December 31, 2024, the payables for repurchase agreements were $6.0 billion and $5.7 billion, respectively, while the fair value of securities and collateral held by counterparties backing the repurchase agreements was $6.2 billion and $5.9 billion, respectively. As of December 31, 2025, payables for repurchase agreements, based on original issuance, were comprised of $2.8 billion of short-term and $3.2 billion of long-term repurchase agreements. As of December 31, 2024, payables for repurchase agreements, based on original issuance, were comprised of $3.0 billion of short-term and $2.7 billion of long-term repurchase agreements.
Dividends from Insurance Subsidiaries
AHL is a holding company whose primary liquidity needs include the cash-flow requirements relating to its corporate activities, including its day-to-day operations, debt servicing, preferred and common stock dividend payments and strategic transactions, such as acquisitions. The primary sources of AHL’s cash flows are dividends from its subsidiaries, capital market issuances and intercompany borrowings, which are expected to be adequate to fund cash flow requirements based on current estimates of future obligations.
The ability of AHL’s insurance subsidiaries to pay dividends is limited by applicable laws and regulations of the jurisdictions where the subsidiaries are domiciled, as well as agreements entered into with regulators. These laws and regulations require, among other things, the insurance subsidiaries to maintain minimum solvency requirements and limit the amount of dividends these subsidiaries can pay.
Subject to these limitations and prior notification to the appropriate regulatory agency, Athene’s U.S. insurance subsidiaries are permitted to pay ordinary dividends based on calculations specified under insurance laws of the relevant state of domicile. Any distributions above the amount permitted by statute in any twelve-month period are considered to be extraordinary dividends, and require the approval of the appropriate regulator prior to payment. AHL does not currently plan on having the U.S. subsidiaries pay any dividends to their parents.
Dividends from AHL’s subsidiaries are projected to be the primary source of AHL’s liquidity. Under the Bermuda Insurance Act, each of Athene’s Bermuda insurance subsidiaries is prohibited from paying a dividend in an amount exceeding 25% of the prior year’s statutory capital and surplus, unless at least two members of the board of directors of the Bermuda insurance subsidiary and its principal representative in Bermuda sign and submit to the BMA an affidavit attesting that a dividend in excess of this amount would not cause the Bermuda insurance subsidiary to fail to meet its relevant margins. In certain
117
instances, the Bermuda insurance subsidiary would also be required to provide prior notice to the BMA in advance of the payment of dividends. In the event that such an affidavit is submitted to the BMA in accordance with the Bermuda Insurance Act, and further subject to the Bermuda insurance subsidiary meeting its relevant margins, the Bermuda insurance subsidiary is permitted to distribute up to the sum of 100% of statutory surplus and an amount less than 15% of its total statutory capital. Distributions in excess of this amount require the approval of the BMA.
The maximum distribution permitted by law or contract is not necessarily indicative of the insurance subsidiaries’ actual ability to pay such distributions, which may be further restricted by business and other considerations, such as the impact of such distributions on surplus, which could affect Athene’s ratings or competitive position and the amount of premiums that can be written. Specifically, the level of capital needed to maintain desired financial strength ratings from rating agencies, including S&P Global, Inc., A.M. Best Company, Inc., Fitch Ratings, Inc. and Moody’s Ratings, Inc., is of particular concern when determining the amount of capital available for distributions. AHL believes its insurance subsidiaries have sufficient statutory capital and surplus, combined with additional capital available to be provided by AHL, to meet their financial strength ratings objectives. Finally, state insurance laws and regulations require that the statutory surplus of Athene’s insurance subsidiaries following any dividend or distribution must be reasonable in relation to their outstanding liabilities and adequate for the insurance subsidiaries’ financial needs.
Other Sources of Funding
Athene may seek to secure additional funding at the AHL level by means other than dividends from subsidiaries, such as by drawing on its undrawn $1.25 billion AHL credit facility, drawing on its undrawn $2.6 billion AHL liquidity facility or by pursuing future issuances of debt or preferred stock to third-party investors. The AHL credit facility contains various standard covenants with which Athene must comply, including maintaining a consolidated debt-to-capitalization ratio of not greater than 35%, maintaining a minimum consolidated net worth of no less than $14.8 billion and restrictions on the ability to incur liens, with certain exceptions. Rates, ratios and terms are as defined in the AHL credit facility. The AHL liquidity facility also contains various standard covenants with which Athene must comply, including maintaining an AARe minimum consolidated net worth of no less than $23.2 billion and restrictions on the ability to incur liens, with certain exceptions. Rates and terms are as defined in the AHL liquidity facility.
Future Debt Obligations
Athene had long-term debt of $7.8 billion as of December 31, 2025, which includes notes with various maturities from 2028 through 2064. See note 14 to the consolidated financial statements for further information regarding Athene’s debt arrangements.
Capital
Athene believes it has a strong capital position and is well positioned to meet policyholder and other obligations. Athene measures capital sufficiency using various internal capital metrics which reflect management’s view on the various risks inherent to its business, the amount of capital required to support its core operating strategies and the amount of capital necessary to maintain its current ratings in a recessionary environment. The amount of capital required to support Athene’s core operating strategies is determined based upon internal modeling and analysis of economic risk, as well as inputs from rating agency capital models and consideration of both NAIC RBC and Bermuda capital requirements. Capital in excess of this required amount is considered excess equity capital, which is available to deploy. As of December 31, 2025, Athene’s estimated U.S., Bermuda and consolidated RBC ratios were 436%, 454% and 441%, respectively. As of December 31, 2024, Athene’s U.S., Bermuda and consolidated RBC ratios were 419%, 450% and 430%, respectively. The formulas for determining the amount of RBC specify various weighting factors that are applied to financial balances or various levels of activity based on the perceived degree of risk. Bermuda Capital, as used in the calculation of Bermuda RBC, represents the capital of Athene’s non-U.S. reinsurance subsidiaries as reported in the Bermuda statutory financial statements, adjusted to exclude deferred tax assets related to Bermuda CIT. Bermuda statutory financial statements apply U.S. statutory accounting principles for policyholder reserve liabilities, which Athene also subjects to U.S. cash flow testing requirements. There are certain differences between Bermuda statutory and U.S. statutory frameworks that result in Consolidated RBC being approximately 20 RBC points higher as of December 31, 2025. The primary driver of this difference is that Bermuda statutory financial statements require that assets assumed as part of a reinsurance transaction and any assets sold are recorded at their market value, without posting an interest maintenance reserve. Athene expects this difference to reduce over time, and to decline to immaterial levels over the next five years.
118
ACRA
ACRA 1 provided Athene with access to on-demand capital to support its growth strategies and capital deployment opportunities. ACRA 1 provided a capital source to fund both Athene’s inorganic and organic channels. ALRe directly owns 37% of the economic interests in ACRA 1 and all of ACRA 1’s voting interests, with ADIP I owning the remaining 63% of the economic interests. The commitment period for ACRA 1 expired in August 2023.
Similar to ACRA 1, ACRA 2 was funded in December 2022 as another long-duration, on-demand capital vehicle. ALRe directly owns 37% of the economic interests in ACRA 2 and all of ACRA 2’s voting interests, with ADIP II owning the remaining 63% of the economic interests. ACRA 2 participates in certain transactions by drawing a portion of the required capital for such transactions from third-party investors equal to ADIP II’s proportionate economic interests in ACRA 2.
These strategic capital solutions allow Athene the flexibility to simultaneously deploy capital across multiple accretive avenues, while maintaining a strong financial position.
Bermuda Corporate Income Tax
On December 27, 2023, the Government of Bermuda enacted the Bermuda CIT in response to the OECD’s Pillar Two initiative. In connection with the enactment of the Bermuda CIT, the Company made interim elections to align the membership of the Company’s Bermuda CIT tax group with the membership of the Company’s Pillar Two Bermuda tax group, and recorded a deferred tax asset of $2.0 billion as of December 31, 2024 for entry into the Bermuda CIT regime. As of December 31, 2025, the Company had $1.7 billion of net Bermuda deferred tax assets and concluded that it was more likely than not that sufficient future taxable income would be generated to realize these deferred tax assets.
On January 5, 2026, the OECD issued guidance exempting U.S.-parented groups from the IIR or UTPR taxes under the Pillar Two regime. The U.K. government has publicly announced its intention to enact this guidance into law. While the precise timing of such enactment is subject to the U.K. government’s legislative process, once enacted, the Company expects that Athene and ACRA Bermuda entities would be exempt from the IIR and UTPR taxes in the U.K. In light of these developments, and the Company’s expectation that maintaining alignment between the Bermuda CIT and Pillar Two tax groups would no longer be beneficial, in January 2026, the Company revoked ACRA’s election to be subject to the Bermuda CIT.
Although the Company believes such an outcome would be unlikely, if the U.K. government does not enact the announced legislation, or subsequently amends its legislation in a manner that does not conform to the OECD guidance, the Company expects to re-elect ACRA into the Bermuda CIT regime at that time and utilize the Bermuda deferred tax assets to offset any resulting Bermuda CIT or Pillar Two cash tax obligations.
As a result of the foregoing, in the first quarter of 2026, the Company will record a full valuation allowance against its Bermuda deferred tax assets, as the Company no longer expects Athene or ACRA to incur Bermuda CIT or Pillar Two tax expense against which such deferred tax assets could be utilized. This will result in a reduction to other assets and a corresponding increase to income tax provision, which results in a reduction to equity, equal to the net amount of the Bermuda deferred tax assets of $1.7 billion. Notwithstanding this near-term impact on these financial metrics, and without assurance as to future results, the Company believes that these developments, including the revocation of ACRA’s election to be subject to the Bermuda CIT, will have favorable implications for the Company’s overall tax position over the longer term.
Critical Accounting Estimates and Policies
This Management’s Discussion and Analysis of Financial Condition and Results of Operations is based upon the consolidated financial statements, which have been prepared in accordance with U.S. GAAP. The preparation of financial statements in accordance with U.S. GAAP requires the use of estimates and assumptions that could affect the reported amounts of assets and liabilities, the disclosure of contingent assets and liabilities and the reported amounts of revenues and expenses. Actual results could differ from these estimates. A summary of our significant accounting policies is presented in note 2 to our consolidated financial statements. The following is a summary of our accounting policies that are affected most by judgments, estimates and assumptions.
119
Critical Accounting Estimates and Policies - Overall
Consolidation
We consolidate entities on a variable interest or voting interest model or, if applicable, apply specialized accounting guidance for investment companies. Significant judgment may be required for the application of the VIE guidance and to determine whether entities qualify as investment companies under U.S. GAAP.
The assessment of whether an entity is a variable interest entity and the determination of whether Apollo should consolidate requires judgment. Those judgments include, but are not limited to: (i) determining whether the total equity investment at risk is sufficient to permit the entity to finance its activities without additional subordinated financial support, (ii) evaluating whether the holders of equity investment at risk, as a group, can make decisions that have a significant effect on the success of the entity, (iii) determining whether the equity investors have proportionate voting rights to their obligations to absorb losses or rights to receive the expected residual returns from an entity and (iv) evaluating the nature of the relationship and activities of those related parties with shared power or under common control for purposes of determining which party within the related-party group is most closely associated with the VIE. Judgments are also made in determining whether a member in the equity group has a controlling financial interest, including power to direct activities that most significantly impact the VIE’s economic performance and rights to receive benefits or obligations to absorb losses that could be potentially significant to the VIE. This analysis considers all relevant economic interests, including proportionate interests held through related parties.
Additionally, evaluating an entity to determine whether it meets the characteristics of an investment company under U.S. GAAP is qualitative in nature and may involve significant judgment. The Company has retained this specialized accounting for investment companies in consolidation.
Equity-Based Compensation
Equity-based compensation is generally measured based on the grant date fair value of the award. Certain RSUs granted by the Company vest subject to continued employment and the Company’s receipt of performance fees, within prescribed periods, sufficient to cover the associated equity-based compensation expense. Equity-based compensation expense for such awards, if and when granted, will be recognized on an accelerated recognition method over the requisite service period to the extent the performance fee metrics are met or deemed probable. The addition of these performance measures helps to promote the interests of our shareholders and fund investors by making RSU vesting contingent on the realization and distribution of profits on our funds. For more information regarding Apollo’s equity-based compensation awards, see note 15 to our consolidated financial statements. The Company’s assumptions made to determine the fair value on grant date are embodied in the calculations of compensation expense.
A significant part of our compensation expense is derived from amortization of RSUs. The fair value of all RSU grants is based on the grant date fair value, which considers the public share price of AGM. The Company grants service-based RSUs, which vest subject to continued employment, and performance-based RSUs, which generally vest subject to continued employment and other performance metrics, described above. RSUs may or may not provide the right to receive dividend equivalents until the RSUs vest and the underlying shares are generally issued by March 15th after the year in which they vest. The grant date fair value is based on the public share price of the Company, and is discounted for transfer restrictions and lack of dividends until vested, if applicable
120
We utilize the present value of a growing annuity formula to calculate a discount for the lack of pre-vesting dividends on certain RSUs, when applicable. The weighted average for the inputs utilized for the shares granted are presented in the table below for service-based grants and performance-based grants:
| Years ended December 31, | |||||||||||||||||
| 2025 | 2024 | 2023 | |||||||||||||||
| Service-Based Grants: | |||||||||||||||||
Dividend Yield1 | 1.1% | 1.5% | 2.3% | ||||||||||||||
Cost of Equity Capital Rate2 | 15.5% | 13.7% | 12.6% | ||||||||||||||
| Performance-Based Grants: | |||||||||||||||||
Dividend Yield1 | 1.4% | 1.3% | 2.2% | ||||||||||||||
Cost of Equity Capital Rate2 | 15.1% | 14.4% | 12.6% | ||||||||||||||
1 Calculated based on the historical dividends paid during the year ended December 31, 2025 and the price of the Company’s common stock as of the measurement date of the grant on a weighted average basis. | |||||||||||||||||
2 Assumes a discount rate that was equivalent to the opportunity cost of foregoing distributions on unvested RSUs as of the valuation date, based on the Capital Asset Pricing Model (“CAPM”). CAPM is a commonly used mathematical model for developing expected returns. | |||||||||||||||||
We utilize the Finnerty Model to calculate a marketability discount on the service-based and performance-based grant RSUs to account for the lag between vesting and issuance. The Finnerty Model provides for a valuation discount reflecting the holding period restriction embedded in a restricted security preventing its sale over a certain period of time.
The Finnerty Model proposes to estimate a discount for lack of marketability such as transfer restrictions by using an option pricing theory. This model has gained recognition through its ability to address the magnitude of the discount by considering the volatility of a company’s stock price and the length of restriction. The concept underpinning the Finnerty Model is that a restricted security cannot be sold over a certain period of time. Further simplified, a restricted share of equity in a company can be viewed as having forfeited a put on the average price of the marketable equity over the restriction period (also known as an “Asian Put Option”). If we price an Asian Put Option and compare this value to that of the assumed fully marketable underlying security, we can effectively estimate the marketability discount. The inputs utilized in the Finnerty Model are (i) length of holding period, (ii) volatility and (iii) dividend yield.
The weighted average for the inputs utilized for the shares granted are presented in the table below for service-based and performance-based grants:
| Years ended December 31, | |||||||||||||||||
| 2025 | 2024 | 2023 | |||||||||||||||
| Service-Based Grants: | |||||||||||||||||
| Holding Period Restriction (in years) | 0.8 | 0.3 | 0.2 | ||||||||||||||
Volatility1 | 35.9% | 25.2% | 38.3% | ||||||||||||||
Dividend Yield2 | 1.1% | 1.5% | 2.3% | ||||||||||||||
| Performance Grants: | |||||||||||||||||
| Holding Period Restriction (in years) | 5.0 | 2.3 | 1.1 | ||||||||||||||
Volatility1 | 38.5% | 34.9% | 41.9% | ||||||||||||||
Dividend Yield2 | 1.4% | 1.3% | 2.2% | ||||||||||||||
1 The Company determined the expected volatility based on the volatility of the Company’s common stock price as of the grant date with consideration to comparable companies. | |||||||||||||||||
2 Calculated based on the historical dividends paid during the years ended December 31, 2025, 2024 and 2023 and the Company’s common stock price as of the measurement date of the grant on a weighted average basis. | |||||||||||||||||
Income Taxes
Significant judgment is required in determining tax expense and in evaluating certain and uncertain tax positions. The Company recognizes the tax benefit of uncertain tax positions when the position is “more likely than not” to be sustained upon examination, including resolution of any related appeals or litigation processes, based on the technical merits of the position.
121
The tax benefit is measured as the largest amount of benefit that has a greater than 50% likelihood of being realized upon ultimate settlement. If a tax position is not considered more likely than not to be sustained, then no benefits of the position are recognized. The Company’s tax positions are reviewed and evaluated quarterly to determine whether the Company has uncertain tax positions that require financial statement recognition.
Deferred tax assets and liabilities are recognized for the expected future tax consequences of differences between the carrying amount of assets and liabilities and their respective tax bases using currently enacted tax rates. The effect on deferred tax assets and liabilities of a change in tax rates is recognized in income in the period during which the change is enacted. Deferred tax assets are reduced by a valuation allowance when it is more likely than not that all or a portion of the deferred tax assets will not be realized.
Critical Accounting Estimates and Policies – Asset Management
Investments, at Fair Value
On a quarterly basis, Apollo utilizes valuation committees consisting of members from senior management, to review and approve the valuation results related to the investments of the funds it manages. The Company also retains external valuation firms to provide third-party valuation consulting services to Apollo, which consist of certain limited procedures that management identifies and requests them to perform. The limited procedures provided by the external valuation firms assist management with validating their valuation results or determining fair value. The Company performs various back-testing procedures to validate their valuation approaches, including comparisons between expected and observed outcomes, forecast evaluations and variance analyses. However, because of the inherent uncertainty of valuation, the estimated values may differ significantly from the values that would have been used had a ready market for the investments existed, and the differences could be material.
The fair values of the investments in the funds we manage can be impacted by changes to the assumptions used in the underlying valuation models. For further discussion on the impact of changes to valuation assumptions see “Item 7A. Quantitative and Qualitative Disclosures About Market Risk—Sensitivities” in this report. There have been no material changes to the valuation approaches utilized during the periods that our financial results are presented in this report.
Fair Value of Financial Instruments
Except for the Company’s debt obligations (each as defined in note 14 to our consolidated financial statements), Apollo’s financial instruments are recorded at fair value or at amounts whose carrying values approximate fair value. See “—Investments, at Fair Value” above. While Apollo’s valuations of portfolio investments are based on assumptions that Apollo believes are reasonable under the circumstances, the actual realized gains or losses will depend on, among other factors, future operating results, the value of the assets and market conditions at the time of disposition, any related transaction costs and the timing and manner of sale, all of which may ultimately differ significantly from the assumptions on which the valuations were based. Financial instruments’ carrying values generally approximate fair value because of the short-term nature of those instruments or variable interest rates related to the borrowings.
Revenue Recognition
Performance Fees
Apollo earns performance fees from funds we manage as a result of such funds achieving specified performance criteria. Such performance fees generally are earned based upon a fixed percentage of realized and unrealized gains of various funds after meeting any applicable hurdle rate or threshold minimum.
Performance allocations are performance fees that are generally structured from a legal standpoint as an allocation of capital to the Company. Performance allocations from certain of the funds that we manage are subject to contingent repayment and are generally paid to us as particular investments made by the funds are realized. If, however, upon liquidation of a fund, the aggregate amount paid to us as performance fees exceeds the amount actually due to us based upon the aggregate performance of the fund, the excess (in certain cases net of taxes) is required to be returned by us to that fund. We account for performance allocations as an equity method investment, and accordingly, we accrue performance allocations quarterly based on fair value of the underlying investments and separately assess if contingent repayment is necessary. The determination of performance allocations and contingent repayment considers both the terms of the respective partnership agreements and the current fair
122
value of the underlying investments within the funds. Estimates and assumptions are made when determining the fair value of the underlying investments within the funds and could vary depending on the valuation methodology that is used. See “Investments, at Fair Value” below for further discussion related to significant estimates and assumptions used for determining fair value of the underlying investments in our credit and equity funds.
Incentive fees are performance fees structured as a contractual fee arrangement rather than a capital allocation. Incentive fees are generally received from the management of perpetual capital vehicles and managed accounts. For a majority of our incentive fees, once the quarterly or annual incentive fees have been determined, there is no look-back to prior periods for a potential contingent repayment, however, certain other incentive fees can be subject to contingent repayment at the end of the life of the entity. In accordance with the revenue recognition standard, certain incentive fees are considered a form of variable consideration and therefore are deferred until fees are probable to not be significantly reversed. There is significant judgment involved in determining if the incentive fees are probable to not be significantly reversed, but generally the Company will defer the revenue until the fees are crystallized or are no longer subject to clawback or reversal.
Management Fees
Management fees related to the credit funds we manage can be based on net asset value, gross assets, adjusted cost of all unrealized portfolio investments, capital commitments, adjusted assets, capital contributions, or stockholders’ equity, all as defined in the respective partnership agreements. The management fee calculations for the credit funds we manage that consider net asset value, gross assets, adjusted cost of all unrealized portfolio investments and adjusted assets are normally based on the terms of the respective partnership agreements and the current fair value of the underlying investments within the funds. Estimates and assumptions are made when determining the fair value of the underlying investments within the funds and could vary depending on the valuation methodology that is used. The management fees related to equity funds we manage, by contrast, are generally based on a fixed percentage of the committed capital or invested capital. The corresponding fee calculations that consider committed capital or invested capital are both objective in nature and therefore do not require the use of significant estimates or assumptions. See “Investments, at Fair Value” below for further discussion related to significant estimates and assumptions used for determining fair value of the underlying investments in the credit and equity funds.
Profit Sharing Expense
Profit sharing expense is primarily a result of agreements with employees to compensate them based on the ownership interest they have in the general partners of the Apollo funds. Therefore, changes in the fair value of the underlying investments in the funds we manage and advise affect profit sharing expense. Employees are generally allocated approximately 30% to 61%, of the total performance fees which is driven primarily by changes in fair value of the underlying fund’s investments and is treated as compensation expense. Additionally, profit sharing expenses paid may be subject to clawback from employees and former employees to the extent not indemnified. When applicable, the accrual for potential clawback of previously distributed profit sharing amounts, which is a component of due from related parties on the consolidated statements of financial condition, represents all amounts previously distributed to employees and former employees that would need to be returned to the general partner if the Apollo funds were to be liquidated based on the current fair value of the underlying funds’ investments as of the reporting date. The actual general partner receivable, however, would not become realized until the end of a fund’s life.
Several of the Company’s employee remuneration programs are dependent upon performance fee realizations, including the incentive pool, and dedicated performance fee rights and certain RSU awards for which vesting is contingent, in part, on the realization of performance fees in a specified period. The Company established these programs to attract and retain, and provide incentive to employees of the Company and to more closely align the overall compensation of employees with the overall realized performance of the Company. Dedicated performance fee rights entitle their holders to payments arising from performance fee realizations. The incentive pool enables certain employees to earn discretionary compensation based on realized performance fees in a given year, which amounts are reflected in profit sharing expense in the Company’s consolidated financial statements. Amounts earned by participants as a result of their performance fee rights (whether dedicated or incentive pool) will vary year-to-year depending on the overall realized performance of the Company (and, in the case of the incentive pool, on their individual performance). There is no assurance that the Company will continue to compensate individuals through the same types of arrangements in the future and there may be periods when the Company determines that allocations of realized performance fees are not sufficient to compensate individuals, which may result in an increase in salary, bonus and benefits, the modification of existing programs or the use of new remuneration programs. Reductions in performance fee revenues could also make it harder to retain employees and cause employees to seek other employment opportunities.
123
Critical Accounting Estimates and Policies – Retirement Services
Investments
The Company is responsible for the fair value measurement of investments presented in the consolidated financial statements. The Company performs regular analysis and review of its valuation techniques, assumptions and inputs used in determining fair value to evaluate if the valuation approaches are appropriate and consistently applied, and the various assumptions are reasonable. The Company also performs quantitative and qualitative analysis and review of the information and prices received from commercial pricing services and broker-dealers, to verify it represents a reasonable estimate of the fair value of each investment. In addition, the Company uses both internally-developed and commercially-available cash flow models to analyze the reasonableness of fair values using credit spreads and other market assumptions, where appropriate. For investment funds, the Company typically recognizes its investment, including those for which it has elected the fair value option, based on net asset value information provided by the general partner or related asset manager. For a discussion of investment funds for which it has elected the fair value option, see note 7 to the consolidated financial statements.
Valuation of Fixed Maturity Securities, Equity Securities and Mortgage Loans
The following table presents the fair value of fixed maturity securities, equity securities and mortgage loans, including those with related parties and those held by consolidated VIEs, by pricing source within the fair value hierarchy:
| December 31, 2025 | |||||||||||||||||||||||
| (In millions, except percentages) | Total | Level 1 | Level 2 | Level 3 | |||||||||||||||||||
| Fixed maturity securities | |||||||||||||||||||||||
| AFS securities | |||||||||||||||||||||||
| Priced via commercial pricing services | $ | 166,398 | $ | 17,424 | $ | 148,974 | $ | — | |||||||||||||||
| Priced via independent broker-dealer quotations | 2,542 | — | 6 | 2,536 | |||||||||||||||||||
| Priced via models or other methods | 49,704 | — | 5,081 | 44,623 | |||||||||||||||||||
| Trading securities | |||||||||||||||||||||||
| Priced via commercial pricing services | 6,391 | 24 | 6,367 | — | |||||||||||||||||||
| Priced via independent broker-dealer quotations | 5 | — | — | 5 | |||||||||||||||||||
| Priced via models or other methods | 467 | — | — | 467 | |||||||||||||||||||
| Trading securities of consolidated VIEs | 3,120 | — | 683 | 2,437 | |||||||||||||||||||
| Total fixed maturity securities, including related parties and consolidated VIEs | 228,627 | 17,448 | 161,111 | 50,068 | |||||||||||||||||||
| Equity securities | |||||||||||||||||||||||
| Priced via commercial pricing services | 814 | 185 | 629 | — | |||||||||||||||||||
| Priced via independent broker-dealer quotations | — | — | — | — | |||||||||||||||||||
| Priced via models or other methods | 274 | — | — | 274 | |||||||||||||||||||
| Total equity securities, including related parties | 1,088 | 185 | 629 | 274 | |||||||||||||||||||
| Mortgage loans | |||||||||||||||||||||||
| Priced via commercial pricing services | 87,380 | — | — | 87,380 | |||||||||||||||||||
| Priced via independent broker-dealer quotations | — | — | — | — | |||||||||||||||||||
| Priced via models or other methods | 6,024 | — | — | 6,024 | |||||||||||||||||||
| Mortgage loans of consolidated VIEs | 2,140 | — | — | 2,140 | |||||||||||||||||||
| Total mortgage loans, including related parties and consolidated VIEs | 95,544 | — | — | 95,544 | |||||||||||||||||||
| Total fixed maturity securities, equity securities and mortgage loans, including related parties and consolidated VIEs | $ | 325,259 | $ | 17,633 | $ | 161,740 | $ | 145,886 | |||||||||||||||
| Percentage of total | 100.0 | % | 5.4 | % | 49.7 | % | 44.9 | % | |||||||||||||||
The Company measures the fair value of its securities based on assumptions used by market participants in pricing the assets, which may include inherent risk, restrictions on the sale or use of an asset, or nonperformance risk. The estimate of fair value is the price that would be received to sell a security in an orderly transaction between market participants in the principal market, or the most advantageous market in the absence of a principal market, for that security. Market participants are assumed to be
124
independent, knowledgeable, able and willing to transact an exchange while not under duress. The valuation of securities involves judgment, is subject to considerable variability and is revised as additional information becomes available. As such, changes in, or deviations from, the assumptions used in such valuations can significantly affect the Company’s consolidated financial statements. Financial markets are susceptible to severe events evidenced by rapid depreciation in security values accompanied by a reduction in asset liquidity. The Company’s ability to sell securities, or the price ultimately realized upon the sale of securities, depends upon the demand and liquidity in the market and increases the use of judgment in determining the estimated fair value of certain securities. Accordingly, estimates of fair value are not necessarily indicative of the amounts that could be realized in a current or future market exchange.
For fixed maturity securities, the Company obtains the fair values, when available, based on quoted prices in active markets that are regularly and readily obtainable. Generally, these are liquid securities and the valuation does not require significant management judgment. When quoted prices in active markets are not available, fair value is based on market standard valuation techniques, giving priority to observable inputs. The Company obtains the fair value for most marketable bonds without an active market from several commercial pricing services. The pricing services incorporate a variety of market observable information in their valuation techniques, including benchmark yields, broker-dealer quotes, credit quality, issuer spreads, bids, offers, and other reference data. For certain fixed maturity securities without an active market, an internally-developed discounted cash flow or other approach is utilized to calculate the fair value. A discount rate is used, which adjusts a market comparable base rate for securities with similar characteristics for credit spread, market illiquidity or other adjustments. The fair value of privately placed fixed maturity securities is based on the credit quality and duration of comparable marketable securities, which may be securities of another issuer with similar characteristics. In some instances, the Company uses a matrix-based pricing model, which considers the current level of risk-free interest rates, corporate spreads, credit quality of the issuer and cash flow characteristics of the security. The Company also considers additional factors, such as net worth of the borrower, value of collateral, capital structure of the borrower, presence of guarantees and its evaluation of the borrower’s ability to compete in its relevant market.
For equity securities, the Company obtains the fair value, when available, based on quoted market prices. Other equity securities, typically private equities or equity securities not traded on an exchange, are valued based on other sources, such as commercial pricing services or brokers.
For mortgage loans, the Company uses independent commercial pricing services. Discounted cash flow analysis is performed through which the loans’ contractual cash flows are modeled and an appropriate discount rate is determined to discount the cash flows to arrive at a present value. Financial factors, credit factors, collateral characteristics and current market conditions are all taken into consideration when performing the discounted cash flow analysis.
The Company performs vendor due diligence exercises annually for all asset classes to review vendor processes, models and assumptions. Additionally, the Company reviews price movements on a quarterly basis to ensure reasonableness.
Derivatives
Valuation of Embedded Derivatives on Indexed Annuities
Athene issues and reinsures products, primarily indexed annuity products, or purchases investments that contain embedded derivatives. If Athene determines the embedded derivative has economic characteristics not clearly and closely related to the economic characteristics of the host contract, and a separate instrument with the same terms would qualify as a derivative instrument, the embedded derivative is bifurcated from the host contract and accounted for separately, unless the fair value option is elected on the host contract.
Indexed annuities and indexed universal life insurance contracts allow the policyholder to elect a fixed interest rate return or an equity market component for which interest credited is based on the performance of certain equity market indices. The equity market option is an embedded derivative, similar to a call option. The benefit reserve is equal to the sum of the fair value of the embedded derivative and the host (or guaranteed) component of the contracts. The fair value of the embedded derivative represents the present value of cash flows attributable to the indexed strategies. The embedded derivative cash flows are based on assumptions for future policy growth, which include assumptions for expected index credits on the next policy anniversary date, future equity option costs, volatility, interest rates and policyholder behavior. The embedded derivative cash flows are discounted using a rate that reflects Athene’s own credit rating. The host contract is established at contract inception as the initial account value less the initial fair value of the embedded derivative and accreted over the policy’s life. Contracts acquired through a business combination which contain an embedded derivative are re-bifurcated as of the acquisition date.
125
In general, the change in the fair value of the embedded derivatives will not directly correspond to the change in fair value of the hedging derivative assets. The derivatives are intended to hedge the index credits expected to be granted at the end of the current term. The options valued in the embedded derivatives represent the rights of the policyholder to receive index credits over the period indexed strategies are made available to the policyholder, which is typically longer than the current term of the options. From an economic basis, Athene believes it is suitable to hedge with options that align with the index terms of its indexed annuity products because policyholder accounts are credited with index performance at the end of each index term. However, because the value of an embedded derivative in an indexed annuity contract is longer-dated, there is a duration mismatch which may lead to differences in the recognition of income and expense for accounting purposes.
A significant assumption in determining policy liabilities for indexed annuities is the vector of rates used to discount indexed strategy cash flows. The change in risk-free rates is expected to drive most of the movement in the discount rates between periods. Changes to credit spreads for a given credit rating, as well as any change to Athene’s credit rating requiring a revised level of nonperformance risk would also be factors in the changes to the discount rate. If the discount rates used to discount the indexed strategy cash flows were to fluctuate, there would be a resulting change in reserves for indexed annuities recorded through the consolidated statements of operations.
As of December 31, 2025, Athene had embedded derivative liabilities classified as Level 3 in the fair value hierarchy of $14.7 billion. The increase (decrease) to the embedded derivatives on indexed annuity products from hypothetical changes in discount rates is summarized as follows:
| (In millions) | December 31, 2025 | ||||
| +100 bps discount rate | $ | (714) | |||
| –100 bps discount rate | 783 | ||||
However, these estimated effects do not take into account potential changes in other variables, such as equity price levels and market volatility, which can also contribute significantly to changes in carrying values. Therefore, the quantitative impact presented in the table above does not necessarily correspond to the ultimate impact on the consolidated financial statements. In determining the ranges, Athene has considered current market conditions, as well as the market level of discount rates that can reasonably be anticipated over the near-term. For additional information regarding sensitivities to interest rate risk and public equity risk, see “Item 7A. Quantitative and Qualitative Disclosures About Market Risk—Sensitivities”.
Future Policy Benefits
The future policy benefit liabilities associated with long duration contracts include term and whole-life products, accident and health, disability, and deferred and immediate annuities with life contingencies, which include pension group annuities and structured settlements with life contingencies. Liabilities for nonparticipating long duration contracts are established as the estimated present value of benefits Athene expects to pay to or on behalf of the policyholder and related expenses less the present value of the net premiums to be collected. For immediate annuities with life contingencies, the liability for future policy benefits is equal to the present value of future benefits and related expenses.
Liabilities for nonparticipating long-duration contracts are established using accepted actuarial valuation methods which require the use of assumptions related to discount rate, expenses and policyholder behavior. Athene bases certain key assumptions related to policyholder behavior on industry standard data, adjusted to align with company experience, if needed. All cash flow assumptions, apart from expense assumptions, are established at contract issuance and reviewed annually, or more frequently, if actual experience suggests a revision is necessary.
Immediate annuities with life contingencies, which include pension group annuities with life contingencies, and assumed whole life contracts represent the significant majority of Athene’s liabilities for future policy benefits. Significant assumptions for its immediate annuities with life contingencies include discount rates, assumptions for policyholder longevity and policyholder utilization for contracts with deferred lives, while significant assumptions for its whole life contracts include discount rates and assumptions for policyholder mortality, morbidity and lapse rates.
In general, the reserve for future policy benefits associated with life-contingent payout annuities will decrease when longevity decreases, resulting in remeasurement gains in the consolidated statements of operations. Changes in the discount rate in periods after a cohort has closed will not impact interest expense recognition within the consolidated statements of operations.
126
However, changes in the discount rate will impact the recorded reserve on the consolidated statements of financial condition, with an offsetting unrealized gain or loss recorded to other comprehensive income (loss). Athene uses a single A rate to calculate the present value of reserves related to its immediate annuities with life contingencies and assumed whole life products.
For limited-payment contracts where premiums are due over a significantly shorter period than the period over which benefits are provided, a deferred profit liability is established to the extent that gross premium exceeds the net premium reserve and included within future policy benefits. When the net premium ratio for the corresponding future policy benefit is updated for actual experience and changes to projected cash flow assumptions, both the future policy benefit reserve and deferred profit liability are retrospectively recalculated from the contract issuance date. Also included within the liability for future policy benefits is negative VOBA that was established for blocks of insurance contracts acquired through the Mergers. Negative VOBA is related to Athene’s immediate annuities with life contingencies and is subsequently measured on a basis generally consistent with the deferred profit liability.
The increase (decrease) to future policy benefit reserves from hypothetical changes in discount rates is summarized as follows:
| (In millions) | December 31, 2025 | ||||
| +100 bps discount rate | $ | (3,023) | |||
| –100 bps discount rate | 3,486 | ||||
Market Risk Benefits
Market risk benefits represent contracts or contract features that both provide protection to the contract holder from, and expose the insurance entity to, other-than-nominal capital market risk. Athene issues and reinsures deferred annuity contracts, which include both traditional deferred and indexed annuities, that contain GLWB and GMDB riders. These riders meet the criteria for and are classified as market risk benefits.
Market risk benefits are measured at fair value at the contract level and may be recorded as a liability or an asset. At contract inception, Athene assesses the fees and assessments that are collectible from the policyholder, which include explicit rider fees and other contract fees, and allocates them to the extent they are attributable to the market risk benefit. These attributed fees are used in the valuation of the market risk benefits and are never negative or exceed total explicit fees collectible from the policyholder. Athene is also required to project the expected benefits that will be required for the riders in excess of the projected account balance. Determining the projected benefits in excess of the projected account balance requires judgment for economic and actuarial assumptions, both of which are used in determining future policyholder account growth that will drive the amount of benefits required.
Economic assumptions include interest rates and implied equity volatilities throughout the duration of the liability. For riders on indexed annuities, this also includes assumptions about projected equity returns, which impact expected index credits on the next policy anniversary date and future equity option costs. When economic assumptions lead to an increase in expected future policy growth from higher interest and index crediting during the accumulation period, the higher projected account balance at the time of rider utilization decreases the inherent value of the rider as less payments for benefits are required in excess of the account balance. All else constant, the increase in the projected account balance will, therefore, result in a decrease to the market risk benefit liability, or an increase if the market risk benefit is in an asset position, with remeasurement gains recorded in the consolidated statements of operations.
Policyholder behavior assumptions are established using accepted actuarial valuation methods to estimate decrements to policies with riders including lapses, full and partial withdrawals (surrender rate) and mortality and the utilization of the benefit riders. Base lapse rates consider the level of surrender charges and are dynamically adjusted based on the level of current interest rates relative to the guaranteed rates and the amount by which any rider guarantees are in a net positive position. Rider utilization assumptions consider the number and timing of policyholders electing the riders. Athene tracks and updates this assumption as experience emerges. Mortality assumptions are set at the product level and are generally based on standard industry tables with adjustments for historical experience and a provision for mortality improvement. While economic assumptions impact the projected account value and the benefits paid in excess of the account value, policyholder behavior assumptions, such as surrenders, impact the expected number of policies that will elect to utilize the rider. An expected increase in decrements and decrease in rider utilization, all else constant, will result in a decrease to the market risk benefit liability or an increase in the market risk benefit asset with remeasurement gains recorded in the consolidated statements of operations.
127
All inputs, including expected fees and assessments and economic and policyholder behavior assumptions, are used to project excess benefits and fees over a range of risk-neutral, stochastic interest rate scenarios. For riders on indexed annuities, stochastic equity return scenarios are also included within the range. The discount rate used to present value the projected cash flows is a significant assumption, with the change in risk-free rates expected to drive most of the movement in discount rates between periods. A risk margin is deducted from the discount rate to reflect the uncertainty in the projected cash flows, such as variations in policyholder behavior, and a credit spread is added to reflect Athene’s risk of nonperformance. If the discount rates used were to fluctuate, there would be a resulting change in reserves for the market risk benefits recorded through the consolidated statements of operations, except for the portion related to the change in nonperformance risk, which is recorded through other comprehensive income (loss).
The increase (decrease) to the net market risk benefit balance from hypothetical changes in the discount rate is summarized as follows:
| (In millions) | December 31, 2025 | ||||
| +100 bps discount rate | $ | (859) | |||
| –100 bps discount rate | 1,063 | ||||
Recent Accounting Pronouncements
A list of recent accounting pronouncements that are relevant to Apollo and its industries is included in note 2 to our consolidated financial statements.
128
Contractual Obligations, Commitments and Contingencies
Fixed and determinable payments due in connection with the Company’s material contractual obligations are as follows as of December 31, 2025:
| (In millions) | 2026 | 2027 - 2028 | 2029 - 2030 | 2031 and Thereafter | Total | ||||||||||||||||||||||||
| Asset Management | |||||||||||||||||||||||||||||
Operating lease obligations1 | $ | 91 | $ | 188 | $ | 181 | $ | 481 | $ | 941 | |||||||||||||||||||
Other long-term obligations2 | 30 | 3 | — | — | 33 | ||||||||||||||||||||||||
AGM credit facility3 | 1 | 2 | 1 | — | 4 | ||||||||||||||||||||||||
Debt obligations3 | 783 | 549 | 1,655 | 7,228 | 10,215 | ||||||||||||||||||||||||
| 905 | 742 | 1,837 | 7,709 | 11,193 | |||||||||||||||||||||||||
| Retirement Services | |||||||||||||||||||||||||||||
| Interest sensitive contract liabilities | 27,794 | 93,823 | 82,381 | 111,891 | 315,889 | ||||||||||||||||||||||||
| Future policy benefits | 3,262 | 6,200 | 5,470 | 35,332 | 50,264 | ||||||||||||||||||||||||
| Market risk benefits | — | — | — | 7,489 | 7,489 | ||||||||||||||||||||||||
| Other policy claims and benefits | 121 | — | — | — | 121 | ||||||||||||||||||||||||
| Dividends payable to policyholders | 9 | 16 | 13 | 50 | 88 | ||||||||||||||||||||||||
Debt obligations3 | 440 | 1,859 | 1,282 | 13,692 | 17,273 | ||||||||||||||||||||||||
Securities to repurchase4 | 2,980 | 2,380 | 1,145 | — | 6,505 | ||||||||||||||||||||||||
| 34,606 | 104,278 | 90,291 | 168,454 | 397,629 | |||||||||||||||||||||||||
| Obligations | $ | 35,511 | $ | 105,020 | $ | 92,128 | $ | 176,163 | $ | 408,822 | |||||||||||||||||||
1 Operating lease obligations excludes $141 million of other operating expenses associated with operating leases. | |||||||||||||||||||||||||||||
2 Includes (i) payments on management service agreements related to certain assets and (ii) payments with respect to certain consulting agreements entered into by the Company. Note that a significant portion of these costs are reimbursable by funds. | |||||||||||||||||||||||||||||
3 The obligations for debt payments include contractual maturities of principal and estimated future interest payments based on the terms of the debt agreements. See note 14 of the consolidated financial statements for further discussion of these debt obligations. | |||||||||||||||||||||||||||||
4 The obligations for securities to repurchase payments include contractual maturities of principal and estimated future interest payments based on the terms of the agreements. Future interest payments on floating rate repurchase agreements were calculated using the December 31, 2025 interest rate. | |||||||||||||||||||||||||||||
Note: Due to the fact that the timing of certain amounts to be paid cannot be determined or for other reasons discussed below, the following contractual commitments have not been presented in the table above.
(i)We have tax receivable agreements that require us to pay tax savings the Company may receive to the holders under those agreements. See note 18 to the consolidated financial statements for further information regarding the tax receivable agreements. The tax savings achieved may not ensure that we have sufficient cash available to pay this liability and we might be required to incur additional debt to satisfy this liability.
(ii)Debt amounts related to the consolidated VIEs are not presented in the table above as the Company is not a guarantor of these non-recourse liabilities.
(iii)In connection with the Stone Tower acquisition, Apollo agreed to pay the former owners of Stone Tower a specified percentage of any future performance fees earned from certain of the Stone Tower funds, CLOs and strategic investment accounts. These contingent consideration liabilities are remeasured to fair value at each reporting period until the obligations are satisfied. See note 19 to the consolidated financial statements for further information regarding the contingent consideration liabilities.
(iv)Commitments from certain of our subsidiaries to contribute to the funds we manage and certain related parties.
Atlas
In connection with the Company and CS’s previously announced transaction, certain subsidiaries of Atlas acquired certain assets of the CS Securitized Products Group (the “Transaction”). Under the terms of the Transaction, Atlas originally agreed to pay CS an amount of $3.3 billion by February 8, 2028. This deferred purchase price is an obligation first of Atlas, second of AAA, third of AAM, fourth of AHL and fifth of AARe. Each of AARe and AAM issued an assurance letter to CS for the full deferred purchase obligation amount of $3.3 billion. In March 2024, in connection with Atlas concluding its investment management agreement with CS, Atlas will no longer receive $0.8 billion of fees and the deferred purchase price obligation is reduced by a corresponding amount from $3.3 billion to $2.5 billion. In addition, certain strategic investors have made equity commitments to Atlas which therefore obligates these investors for a portion of the deferred purchase price obligation.
In exchange for the purchase price, Atlas originally received approximately $0.4 billion in cash and a portfolio of senior secured warehouse assets, subject to debt, with approximately $1 billion of tangible equity value. These warehouse assets are senior secured assets at industry standard loan-to-value ratios, structured to investment grade-equivalent criteria, and were approved by Atlas in connection with this Transaction. Atlas also benefits generally from the net spread earned on these assets in excess of its cost of financing. Finally, Atlas will earn total fees of $0.4 billion under the terms of the investment management agreement with CS, including management fees and transition and termination payments. As a result, the
129
guarantee related to the Company’s aforementioned assurance letter is not probable of payment and, therefore, a liability has not been reflected on the consolidated financial statements.
Supplemental Guarantor Financial Information
The 2031 Senior Notes, 2033 Senior Notes, the 2035 Senior Notes and the 2054 Senior Notes issued by AGM are each guaranteed on a senior, unsecured basis, and the 2053 Subordinated Notes and the 2054 Subordinated Notes issued by AGM are guaranteed on a junior, unsecured basis, by AAM, together with certain Apollo intermediary holding companies (collectively, the “Guarantors”). The Guarantors fully and unconditionally guarantee payments of principal, premium, if any, and interest (i) on the 2031 Senior Notes, the 2033 Senior Notes, the 2035 Senior Notes and the 2054 Senior Notes on a senior, unsecured basis and (ii) on the 2053 Subordinated Notes and the 2054 Subordinated Notes on a subordinated, unsecured basis. See note 14 of the consolidated financial statements for further discussion on these debt obligations.
AGM, as issuer, and the Guarantors are holding companies. The primary sources of cash flow are dependent upon distributions from their respective subsidiaries to meet their future obligations under the notes and the guarantees, respectively. The 2031 Senior Notes, 2033 Senior Notes, the 2035 Senior Notes, the 2054 Senior Notes, the 2053 Subordinated Notes and the 2054 Subordinated Notes are not guaranteed by any fee generating businesses, Apollo-managed funds, or Athene and its direct and indirect subsidiaries. Holders of the guaranteed registered debt securities will have a direct claim only against AGM as issuer.
The following tables present summarized financial information of AGM, as the issuer of the debt securities, and the Guarantors on a combined basis after elimination of intercompany transactions and balances within the Guarantors and equity in the earnings from and investments in any non-guarantor subsidiary. As used herein, “obligor group” means AGM, as the issuer of the debt securities, and the Guarantors on a combined basis. The summarized financial information is provided in accordance with the reporting requirements of Rule 13-01 under SEC Regulation S-X for the obligor group and is not intended to present the financial position or results of operations of the obligor group in accordance with generally accepted accounting principles as such principles are in effect in the U.S.
| (In millions) | December 31, 2025 | December 31, 2024 | |||||||||
Summarized Statements of Financial Condition | |||||||||||
| Current assets, less receivables from non-guarantor subsidiaries | $ | 3,061 | $ | 2,545 | |||||||
| Non-current assets | 8,724 | 8,897 | |||||||||
| Due from related parties, excluding non-guarantor subsidiaries | 647 | 598 | |||||||||
| Current liabilities, less payables to non-guarantor subsidiaries | 934 | 521 | |||||||||
| Non-current liabilities | 8,278 | 7,122 | |||||||||
| Due to related parties, excluding non-guarantor subsidiaries | 277 | 305 | |||||||||
| Non-controlling interests | 35 | 11 | |||||||||
| Year ended December 31, | |||||
| (In millions) | 2025 | ||||
Summarized Statements of Operations | |||||
| Revenues | $ | 4,300 | |||
| Net income (loss) | (99) | ||||
| Net income (loss) attributable to obligor group | (204) | ||||
130
The following are transactions of the obligor group with non-guarantor subsidiaries.
| (In millions) | December 31, 2025 | December 31, 2024 | |||||||||
| Due from non-guarantor subsidiaries | $ | 1,150 | $ | 160 | |||||||
| Due to non-guarantor subsidiaries | 1,364 | 1,193 | |||||||||
| Year ended December 31, | |||||||||||
| (In millions) | 2025 | ||||||||||
| Intercompany revenue | $ | 1,441 | |||||||||
| Intercompany expense | 559 | ||||||||||
| Intercompany interest income | 11 | ||||||||||
ITEM 7A. QUANTITATIVE AND QUALITATIVE DISCLOSURES ABOUT MARKET RISK
Market risk is the risk of incurring losses due to adverse changes in market rates and prices. Potential risk exposures include credit and counterparty risk, interest rate risk, currency risk, commodity price risk, equity price risk and inflation risk.
In our asset management business, our predominant exposure to market risk is related to our role as investment manager and general partner for the funds we manage and the sensitivity to movements in the fair value of their investments and resulting impact on performance fees and management fee revenues. Our direct investments in the funds we manage also expose us to market risk whereby movements in the fair values of the underlying investments will increase or decrease both net gains (losses) from investment activities and income (loss) from equity method investments.
Our retirement services business is exposed to market risk through its investment portfolio, its counterparty exposures and its hedging and reinsurance activities. Athene’s primary market risk exposures are to credit risk, interest rate risk and equity price risk.
Risk Management Framework
The Company’s risk management frameworks are designed to identify, assess and prioritize risks to ensure that senior management understands and can manage our risk profile. Governance over risk exists at both the board level and management level for both the asset management and retirement services businesses. The audit committee of the board of directors of AGM is tasked with reviewing major financial risk exposures of the Company and management’s risk assessment and risk management policies.
Asset Management
In our asset management business, risks are analyzed across strategies from both a “bottom up” and “top down” perspective. We gather and analyze data, monitor investments and markets in detail, and constantly strive to better quantify, qualify and circumscribe relevant risks.
Each risk management process is subject to our overall risk tolerance and philosophy and our asset management enterprise risk management framework. This framework governs all business units within the asset management business and (1) conveys our risk culture; (2) outlines our risk management methodology; (3) identifies key roles and responsibilities, and (4) summarizes our core risk areas including, but not limited to, market, credit and operational risks.
Investment and risk management processes are tailored to each respective investment portfolio subject to our overall risk tolerance and philosophy:
•With respect to the credit funds we manage, we continuously monitor a variety of markets for attractive trading opportunities, applying a number of traditional and customized risk management metrics to analyze risk related to specific assets or portfolios.
•The investment process of the equity funds we manage involves a detailed analysis of potential acquisitions, with investment management teams assigned to monitor the strategic development, financing and capital deployment decisions of each portfolio investment.
131
The AAM Global Risk Committee is tasked with assisting AAM in monitoring and managing enterprise risk for the asset management business. The AAM Global Risk Committee is chaired by the President of AGM and includes other members of senior management of Apollo’s asset management business. Managing risk is the responsibility of all AAM employees. Businesses and investment professionals are responsible for all the risk taken on and managed in their business areas and risk management groups provide an objective challenge to, and oversight of, the business’ risk management.
Risk management groups of the Company’s asset management business provide summary analysis of fund level market and credit risk to the portfolio managers of the funds managed by Apollo and the heads of the various business units. On a periodic basis, risk management groups also provide analyses of select market and credit risk components to various members of senior management. In addition, the business and risk leaders of the Company’s asset management business review specific investments from the perspective of risk mitigation and discuss such analysis with the AAM Global Risk Committee or other members of senior management, when needed.
Retirement Services
The processes supporting risk management for our retirement services business are designed to ensure that Athene’s risk profile is consistent with its stated risk appetite and that it maintains sufficient capital and liquidity to support its corporate plan, while meeting the requirements imposed by its policyholders, regulators and other stakeholders. The risk management function at Athene strives to maximize the value of its existing business platform to the Company’s stockholders, preserve the ability to realize business and market opportunities under stressed market conditions and withstand the impact of severely adverse events.
AHL’s risk management framework includes a governance committee structure that supports accountability in current risk-based decision making and effective risk management. Governance committees are established at three levels: the AHL board of directors, AHL management and subsidiary management. AHL utilizes a host of assessment tools to monitor and assess its risk profile, results of which are shared with senior management periodically at management level committees, such as the risk committee (“RC”) and the investment and asset liability committee (“IALC”), and with the AHL board of directors quarterly. Business management retains the primary responsibility for day-to-day management of risk.
The risk management team at Athene consists of seven teams: Strategic, Liability and Model Risk; Market, Credit and ALM Risk; Liquidity, Business and Operational Risk; Risk Platform and Analytics; Derivatives and Structured Solutions; Derivatives Risk Management; and Risk Operations and Change Management. The risk management team is led by AHL’s Chief Risk Officer, who reports to the chair of the AHL Risk Committee. AHL’s risk management team is comprised of more than 60 dedicated, full-time employees.
Asset and Liability Management
Asset and liability risk management is a joint effort that spans business management and the entire risk management team. Processes established to analyze and manage the risks of Athene’s assets and liabilities include but are not limited to:
•analyzing AHL’s liabilities to ascertain their sensitivity to behavioral variations and changes in market conditions and actuarial assumptions;
•analyzing interest rate risk, cash flow mismatch, and liquidity risk;
•performing scenario and stress analyses to examine their impacts on capital and earnings;
•performing cash flow testing and capital modeling;
•modeling the values of the derivatives embedded in its policy liabilities so that they can be effectively hedged;
•hedging unwanted risks, including from embedded derivatives, interest rate exposures and currency risks;
•reviewing its corporate plan and strategic objectives, and identifying prospective risks to those objectives under normal and stressed economic, behavioral and actuarial conditions; and
•providing appropriate risk reports that show consolidated risk exposures from assets and liabilities, as well as the economic consequences of stress events and scenarios.
132
Market Risk and Management of Market Risk Exposures
Asset Management
Impact on Management Fees
Our management fees are based on one of the following:
•capital commitments to an Apollo fund;
•capital invested in an Apollo fund;
•the gross, net or adjusted asset value of an Apollo fund, as defined; or
•as otherwise defined in the respective agreements.
Management fees could be impacted by changes in market risk factors, including (i) changes in invested capital or in market values to below cost, due to which management could consider an investment permanently impaired, in the case of certain funds or (ii) changes in gross or net asset value, for the credit funds. The proportion of our management fees that are based on NAV is dependent on the number and types of funds in existence and the current stage of each fund’s life cycle.
Impact on Advisory and Transaction Fees—We earn transaction fees relating to certain credit and equity transactions and may obtain reimbursement for certain out-of-pocket expenses incurred. Subsequently, on a quarterly or annual basis, ongoing advisory fees, and additional transaction fees in connection with additional purchases, dispositions, or follow-on transactions, may be earned. Management fee offsets and any broken deal costs, if applicable, are reflected as a reduction to advisory and transaction fees. Advisory and transaction fees will be impacted by changes in market risk factors to the extent that they limit our opportunities to engage in credit and equity transactions or impair our ability to consummate such transactions. The impact of changes in market risk factors on advisory and transaction fees is not readily predicted or estimated.
Impact on Performance Fees
We earn performance fees from the funds we manage as a result of such funds achieving specified performance criteria. Our performance fees will be impacted by changes in market risk factors. However, several major factors will influence the degree of impact:
•the performance criteria for each individual fund in relation to how that fund’s results of operations are impacted by changes in market risk factors;
•whether such performance criteria are annual or over the life of the fund;
•to the extent applicable, the previous performance of each fund in relation to its performance criteria; and
•whether each fund’s performance fee distributions are subject to contingent repayment.
As a result, the impact of changes in market risk factors on performance fees will vary widely from fund to fund. The impact is heavily dependent on the prior and future performance of each fund, and therefore is not readily predicted or estimated.
Market Risk
We are directly and indirectly affected by changes in market conditions. Market risk generally represents the risk that values of investments will be adversely affected by changes in market conditions. Market risk is inherent in each of the investments of the funds we manage, including equity investments, loans, short-term borrowings, long-term debt, hedging instruments, credit default swaps and other derivatives. Just a few of the market conditions that may shift from time to time, thereby exposing us to market risk, include fluctuations in interest, currency exchange rates and credit spreads, equity prices or changes in the implied volatility of interest rates. Volatility in debt and equity markets can impact our pace of capital deployment, the timing of receipt of transaction fee revenues and the timing of realizations. These market conditions could have an impact on the value of fund investments and rates of return. Accordingly, depending on the instruments or activities impacted, market risks can have wide ranging, complex adverse effects on our results from operations and our overall financial condition. We monitor market risk using certain strategies and methodologies which management evaluates periodically for appropriateness. We intend to continue to monitor this risk going forward and continue to monitor our exposure to all market factors.
133
Concentration Risk
The Company is subject to a concentration risk related to the investors in the funds it manages. There are more than 1,000 investors in Apollo’s active credit and equity funds, and no individual investor accounts for more than 10% of the total committed capital to Apollo’s active funds.
Interest Rate Risk
Interest rate risk represents exposure we and the funds we manage have to instruments whose values vary with the change in interest rates. These instruments include, but are not limited to, loans, borrowings, investments in interest bearing securities and derivative instruments. We may seek to mitigate risks associated with the exposures by having the funds take offsetting positions in derivative contracts. Hedging instruments allow us to seek to mitigate risks by reducing the effect of movements in the level of interest rates, changes in the shape of the yield curve, as well as, changes in interest rate volatility. Hedging instruments used to mitigate these risks may include related derivatives such as options, futures and swaps.
Credit Risk
Credit risk represents exposure we and the funds we manage have to investments or other activity whose value varies with the change in credit spreads, the change in the probability of default by the borrow or the actual default and failure to repay a loan or contractual obligation. Certain of the funds we manage are subject to certain inherent risks through their investments.
Certain entities we manage invest substantially all of their excess cash in open-end money market funds and money market demand accounts, which are included in cash and cash equivalents. The money market funds invest primarily in government securities and other short-term, highly liquid instruments with a low risk of loss. We continually monitor the funds’ performance in order to manage any risk associated with these investments.
Certain funds we manage hold derivative instruments that contain an element of risk in the event that the counterparties may be unable to meet the terms of such agreements. We seek to minimize risk exposure by limiting the counterparties with which the funds enter into contracts to banks and investment banks who meet established credit and capital guidelines. Counterparty risk may be further mitigated by the exchange of collateral with a counterparty as a form of credit support for derivative transactions. As of December 31, 2025, we do not expect any counterparty to default on its obligations and therefore do not expect to incur any loss due to counterparty default.
Certain investments of the funds we manage include lower-rated and comparable quality unrated distressed investments and other instruments. Investments in such debt instruments are accompanied by a greater degree of risk of loss due to default by the issuer because such debt instruments are generally unsecured and subordinated to other creditors of the issuer. These issuers generally have high levels of indebtedness and can be more sensitive to adverse market conditions, such as a recession or increasing interest rates, as compared to higher rated issuers. We seek to minimize risk exposure by subjecting each prospective investment to rigorous credit analysis and by making investment decisions based upon objectives that include capital preservation and appreciation, and industry and issuer diversification.
Foreign Exchange Risk
Foreign exchange risk represents exposures the funds we manage have to changes in the values of current fund holdings and future cash flows denominated in other currencies and investments in non-U.S. companies. The types of investments exposed to this risk include investments in foreign subsidiaries, foreign currency-denominated loans, foreign currency-denominated transactions, and various foreign exchange derivative instruments whose values fluctuate with changes in currency exchange rates or foreign interest rates. Instruments used to mitigate this risk are foreign exchange options, currency swaps, futures and forwards. These instruments may be used to help insulate the funds we manage against losses that may arise due to volatile movements in foreign exchange rates and/or interest rates.
In our capacity as investment manager of the funds we manage, we continuously monitor a variety of markets for attractive opportunities for managing risk. For example, certain of the funds we manage may put in place foreign exchange hedges or borrowings with respect to certain foreign currency denominated investments to provide a hedge against foreign exchange exposure.
134
Non-U.S. Operations
We have offices and conduct business throughout the world and are continuing to expand into foreign markets. Our fund investments and our revenues are primarily derived from our U.S. operations. With respect to our non-U.S. operations, we are subject to risk of loss from currency fluctuations, social instability, changes in governmental policies or policies of central banks, expropriation, nationalization, unfavorable political and diplomatic developments and changes in legislation relating to non-U.S. ownership. The funds we manage also invest in equity or debt of companies which are located in non-U.S. jurisdictions. As we continue to expand globally, we will continue to focus on monitoring and managing these risk factors as they relate to specific non-U.S. investments.
Retirement Services
Credit Risk and Counterparty Risk
To operate Athene’s business model, which is based on generating spread related earnings, it must bear credit risk. However, as Athene assumes credit risk through its investment, reinsurance and hedging activities, it endeavors to ensure that risk exposures remain diversified, that it is adequately compensated for the risks it assumes and that the level of risk is consistent with its risk appetite and objectives.
Credit risk is a key risk taken in the asset portfolio, as the credit spread on Athene’s investments is what drives its spread related earnings. Athene manages credit risk by evaluating and calibrating idiosyncratic risk concentrations, understanding and managing its systematic exposure to economic and market conditions through stress testing, monitoring investment activity and distinguishing between price and default risk from credit exposures. Concentration and portfolio limits are designed to ensure that exposure to default and impairment risk is sufficiently modest to not represent a solvency risk, even in severe economic conditions.
The approach to taking credit risk in our retirement services business is formulated based on:
•a fundamental view on existing and potential opportunities at the security level;
•an assessment of the current risk/reward proposition for each market segment;
•identification of downside risks and assigning a probability for those risks; and
•establishing a plan for best execution of the investment action.
A dedicated set of AHL risk managers monitor the asset risks to ensure that such risks are consistent with Athene’s risk appetite, standards for committing capital and overall strategic objectives. Athene’s risk management team is also a key contributor to the credit impairment evaluation process.
In addition to credit-risk exposures from its investment portfolio, Athene is also exposed to credit risk from its counterparty exposures related to derivative hedging and reinsurance activities. Derivative counterparty risk is managed by trading on a collateralized basis with counterparties under International Swaps and Derivatives Association documents with a credit support annex having zero-dollar collateral thresholds.
Athene utilizes reinsurance to mitigate risks that are inconsistent with its strategy or objectives. For example, Athene has reinsured much of the mortality risk it would otherwise have accumulated through its various acquisitions and block reinsurance transactions, allowing it to focus on its core annuity business. These reinsurance agreements expose Athene to the credit risk of its counterparties. Athene manages this risk to avoid counterparty risk concentrations through various mechanisms: utilization of reinsurance structures such as funds withheld or modco to retain ownership of the assets and limit counterparty risk to the cost of replacing the counterparty; diversification across counterparties; and when possible, novating policies to eliminate counterparty risk altogether.
Interest Rate Risk—Significant interest rate risk may arise from mismatches in the timing of cash flows from Athene’s assets and liabilities. Management of interest rate risk at the company-wide level, and at the various operating company levels, is one of the main risk management activities in which AHL senior management engages.
Depending upon the materiality of the risk and Athene’s assessment of how it would perform across a spectrum of interest rate environments, Athene may seek to mitigate interest rate risk using on-balance-sheet strategies (portfolio management) or off-balance-sheet strategies (derivative hedges such as interest rate swaps and futures). Athene monitors ALM metrics (such as key-
135
rate durations and convexity) and employs quarterly cash flow testing requirements across all of its insurance companies to assure the asset and liability portfolios are managed to maintain net interest rate exposures at levels that are consistent with its risk appetite. Athene has established a set of exposure and stress limits to communicate its risk tolerance and to ensure adherence to those risk tolerance levels. Risk management personnel and the RC and/or IALC (together, “AHL management committees”) are notified in the event that risk tolerance levels are exceeded. Depending on the specific risk threshold that is exceeded, the appropriate AHL management committee then makes a decision as to what actions, if any, should be undertaken.
Active portfolio management is performed by our asset management business, with direction from the AHL management committees. ALM risk is also managed by the AHL management committees. The performance of Athene’s investment portfolio is reviewed periodically by the AHL management committees and board of directors. The AHL management committees strive to improve returns to stockholders and protect policyholders, while dynamically managing the risk within Athene’s expectations.
Equity Risk—Athene’s indexed annuities require it to make payments to policyholders that are dependent on the performance of equity market indices. Athene seeks to minimize the equity risk from its liabilities by economically defeasing this equity exposure with granular, policy-level-based hedging. In addition, Athene’s investment portfolio can be invested in strategies involving public and private equity positions, though in general, it has limited appetite for passive, public equity investments.
The equity index hedging framework implemented is one of static and dynamic replication. Unique policy-level liability options are matched with static OTC options and residual risk arising from (1) policyholder behavior and other trading constraints (for example minimum trade size) and (2) the decision by the organization to enhance the value of the product offerings by dynamically managing a small portion of the exposure on custom indices, are managed dynamically by decomposing the risk of the portfolio (asset and liability positions) into market risk measures which are managed to pre-established risk limits. The portfolio risks are measured overnight and rebalanced daily to ensure that the risk profile remains within risk appetite. Valuation is done at the position level, and risks are aggregated and shown at the level of each underlying index. Risk measures that have term structure sensitivity, such as index volatility risk and interest rate risk, are monitored and risk managed along the term structure.
Athene is also exposed to equity risk in its alternative investment portfolio. The form of those investments is typically a limited partnership interest in a fund. Athene generally targets fund investments that have characteristics resembling fixed income or hybrid investments versus those resembling pure equity investments, but as holders of partnership positions, Athene’s investments are generally held as equity positions. Alternative investments are comprised of several categories, including at the most liquid end of the spectrum “liquid strategies”, (which is mostly exposure to publicly traded equities), followed by “equity” and “credit” strategies. Athene’s alternatives portfolio also includes equity investments in origination platforms, insurance platforms and others.
Athene’s investment mandate in its alternative investment portfolio is inherently opportunistic. Each investment is examined and analyzed on its own merits to gain a full understanding of the risks present, and with a view toward determining likely return scenarios, including the ability to withstand stress in a downturn. Athene has a strong preference for alternative investments that have some or all of the following characteristics, among others: (1) investments with credit- or debt-like characteristics (for example, a stipulated maturity and par value), or alternatively, investments with reduced volatility when compared to pure equity; or (2) investments that Athene believes have less downside risk.
The alternative investment portfolio is monitored to ensure diversification across asset classes and strategy, and the portfolio's performance under stress scenarios is evaluated routinely as part of management and board reviews. Since alternative investments are marked-to-market on the consolidated statements of financial condition, risk analyses focus on potential changes in valuation across a variety of market stresses.
Currency Risk—Athene manages its currency risk to maintain minimal exposure to currency fluctuations. It attempts to hedge completely the currency risk arising on its statement of financial condition. In general, Athene matches currency exposure of assets and liabilities. When the currency denominations of the assets and liabilities do not match, Athene generally undertakes hedging activities to eliminate or mitigate currency mismatch risk.
Inflation Risk—Exposure to inflation-linked outflows (liabilities) is not a significant risk. These liabilities generally have caps on the amount of inflation applied to annual growth of payments. Additionally, inflation-linked liabilities are priced to parity with other payout options available to the policyholders accounting for the forward-looking risk. Athene attempts to hedge the majority of inflation risk arising from the pension group annuity business that it reinsures.
136
Scenario Analysis—Athene evaluates exposure to credit risk by analyzing its portfolio’s performance during simulated periods of economic stress. Athene manages business, capital and liquidity needs to withstand stress scenarios and target capital it believes will maintain its current ratings in a moderate recession scenario and maintain investment grade ratings under a deep recession scenario, a substantially severe financial crisis akin to the Lehman scenario in 2008. In the recession scenario, Athene calibrates recessionary shocks to several key risk factors (including but not limited to default rates, recoveries, credit spreads and U.S. Treasury yields) using data from the 1991, 2001 and 2008 recessions, and estimates impacts to the various sectors in its portfolio. In the deep recession scenario, Athene uses default probabilities from the 2008-2009 period, along with recovery and ratings migration rates, to estimate impairment impacts, and uses credit spread and interest rate movements from the 2008–2009 period to estimate mark to market changes. Management reviews the impacts of its stress test analyses on a quarterly basis.
Sensitivities
Asset Management
Interest Rate Risk
We are primarily subject to interest rate risk through the investments of the funds we manage. For funds that pay management fees based on NAV or other bases that are sensitive to market value fluctuations, we anticipate our management fees would change consistent with the increase or decrease experienced by the underlying funds’ portfolios. In the event that interest rates were to increase by one percentage point, we estimate that management fees earned that were dependent upon estimated fair value would decrease by approximately $25 million and $21 million during the years ended December 31, 2025 and 2024, respectively.
Credit Risk
Similar to interest rate risk, we are also subject to credit risk through the investments of the funds we manage. In the event that credit spreads were to increase by one percentage point, we estimate that management fees earned that were dependent upon estimated fair value would decrease by approximately $32 million and $21 million during the years ended December 31, 2025 and 2024, respectively.
Foreign Exchange Risk
We estimate for the years ended December 31, 2025 and 2024, a 10% decline in the rate of exchange of all foreign currencies against the U.S. dollar would result in the following declines in management fees and investment income (loss):
| Years ended December 31, | |||||||||||
| (In millions) | 2025 | 2024 | |||||||||
| Management fees | $ | 31 | $ | 29 | |||||||
| Investment income (loss) | 7 | 3 | |||||||||
Net Gains from Investment Activities and Investment Income
Our assets and unrealized gains, and our related equity and net income are sensitive to changes in the valuations of the underlying investments of the funds we manage and could vary materially as a result of changes in our valuation assumptions and estimates. See “Item 7. Management’s Discussion and Analysis of Financial Conditions and Results of Operations—Critical Accounting Estimates and Policies—Asset Management—Investments, at Fair Value” for details related to the valuation methods that are used and the key assumptions and estimates employed by such methods. We also quantify the Level 3 investments that are included on our consolidated statements of financial condition by valuation methodology in note 7 to the consolidated financial statements. We employ a variety of valuation methods. Furthermore, the investments that we manage but are not on our consolidated statements of financial condition, and therefore impact performance fees, also employ a variety of valuation methods of which no single methodology is used more than any other.
137
Management Fees
Management fees are primarily based on the net asset value of the relevant fund, gross assets, adjusted equity, capital commitments, invested capital, or as defined in the respective fund’s management agreements. Changes in the fair values of the investments that earn management fees based on net asset value, gross assets or adjusted equity will have a direct impact on the amount of management fees that are earned. Management fees earned that were dependent upon estimated fair value during the years ended December 31, 2025 and 2024 would decrease by approximately $90 million and $75 million, respectively, if the fair values of the investments held by such funds were 10% lower during the same respective periods.
Management fees for equity funds we manage are generally charged on either (a) a fixed percentage of committed capital over a stated investment period or (b) a fixed percentage of invested capital of unrealized portfolio investments. Changes in values of investments could indirectly affect future management fees from such funds by, among other things, reducing the funds’ access to capital or liquidity and their ability to currently pay the management fees or if such change resulted in a write-down of investments below their associated invested capital.
Investment Income (Loss) and Net Gains from Investment Activities
Performance Allocations—Performance allocations from the funds we manage generally are earned based on achieving specified performance criteria and are impacted directly by changes in the fair value of the funds’ investments. We anticipate that a 10% decline in the fair values of investments held by all of the funds we manage would decrease performance allocations by approximately $2.0 billion and $1.9 billion at December 31, 2025 and 2024, respectively.
Principal Investment Income—For select funds managed by Apollo, our share of income from equity method investments as a general partner in such funds is derived from unrealized gains or losses on investments in funds included in the consolidated financial statements. For funds in which we have an interest, but are not consolidated, our share of investment income is limited to our direct investments in the funds.
We anticipate that a 10% decline in the fair value of investments at December 31, 2025 and 2024 would result in an approximately $278 million and $230 million decrease in principal investment income and net gains (losses) from investment activities in our consolidated financial statements, respectively.
Retirement Services
Interest Rate Risk
Athene assesses interest rate exposure for financial assets and liabilities using hypothetical stress tests and exposure analyses. Assuming all other factors are constant, if there was an immediate parallel increase in interest rates of 100 basis points from levels as of December 31, 2025, Athene estimates a net decrease to its point-in-time income (loss) before income tax (provision) benefit from changes in the fair value of these financial instruments of $4.2 billion, net of offsets. If there was a similar parallel increase in interest rates from levels as of December 31, 2024, Athene estimates a net decrease to its point-in-time income (loss) before income tax (provision) benefit from changes in the fair value of these financial instruments of $3.0 billion, net of offsets. The increase in sensitivity to point-in-time income (loss) before income tax (provision) benefit from changes in the fair value of these financial instruments as of December 31, 2025, when compared to December 31, 2024, is primarily driven by the growth experienced in 2025. The financial instruments included in the sensitivity analysis are carried at fair value and changes in fair value are recognized in earnings. These financial instruments include derivative instruments, embedded derivatives, mortgage loans, certain fixed maturity securities and market risk benefits. The sensitivity analysis excludes those financial instruments carried at fair value for which changes in fair value are recognized in equity, such as AFS fixed maturity securities.
Assuming a 25 basis point increase in interest rates that persists for a 12-month period, the estimated impact to spread related earnings due to the change in net investment spread from floating rate assets and liabilities would be an increase of approximately $10 to $15 million, and a 25 basis point decrease would generally result in a similar decrease. This is calculated without regard to future changes to assumptions and excludes the impact of rate changes on cash and cash equivalents. As of December 31, 2025 the balance in cash and cash equivalents plus restricted cash, net investment payables and receivables, reinsurance impacts and the net derivative collateral offsetting the related cash positions, was $10.5 billion, net of the amount attributable to the non-controlling interests. The decrease in sensitivity to spread related earnings due to the change in net
138
investment spread from floating rate assets and liabilities as of December 31, 2025, when compared to December 31, 2024, was driven by the decrease in Athene’s net floating rate position primarily related to hedging actions undertaken in 2025.
Changes in the fair value of market risk benefits due to current period movement in the interest rate curve used to discount the reserve are reflected in net income but excluded from spread related earnings. However, changes in interest rates that impact the cost of the projected GLWB and GMDB rider benefits, included within Athene’s market risk benefit reserve, are amortized within cost of funds in spread related earnings over the life of the business. Assuming a parallel increase in interest rates of 25 basis points, the estimated impact to spread related earnings over a 12-month period related to market risk benefits would be an increase of approximately $30 to $50 million, and a parallel decrease in interest rates of 25 basis points would generally result in a similar decrease. This is calculated without regard to future changes to assumptions.
Athene is unable to make forward-looking estimates regarding the impact on net income of changes in interest rates that persist for a longer period of time, or changes in the shape of the yield curve over time, as a result of an inability to determine how such changes will affect certain of the items that Athene characterizes as “adjustments to income before income taxes” in its reconciliation between net income available to Athene Holding Ltd. common stockholder and spread related earnings. See “Item 7. Management’s Discussion and Analysis of Financial Condition and Results of Operations—Summary of Non-U.S. GAAP Measures” for the reconciliation of net income (loss) attributable to Apollo Global Management, Inc. common stockholders to adjusted net income, of which spread related earnings is a component. The impact of changing rates on these adjustments is likely to be significant. See above for a discussion regarding the estimated impact on income (loss) before income tax (provision) benefit of an immediate, parallel increase in interest rates of 100 basis points from levels as of December 31, 2025, which discussion encompasses the impact of such an increase on certain of the adjustment items.
The models used to estimate the impact of changes in market interest rates incorporate numerous assumptions, require significant estimates and assume an immediate change in interest rates without any discretionary management action to counteract such a change. Consequently, potential changes in Athene’s valuations indicated by these simulations will likely be different from the actual changes experienced under any given interest rate scenarios and these differences may be material. Because Athene actively manages its assets and liabilities, the net exposure to interest rates can vary over time. However, any such decreases in the fair value of fixed maturity securities, unless related to credit concerns of the issuer requiring recognition of credit losses, would generally be realized only if Athene were required to sell such securities at losses to meet liquidity needs.
Public Equity Risk
Athene assesses public equity market risk for financial assets and liabilities using hypothetical stress tests and exposure analyses. Assuming all other factors are constant, if there was a decline in public equity market prices of 10% as of December 31, 2025, Athene estimates a net decrease to its point-in-time income (loss) before income tax (provision) benefit from changes in the fair value of these financial instruments of $833 million. As of December 31, 2024, Athene estimates that a decline in public equity market prices of 10% would cause a net decrease to its point-in-time income (loss) before income tax (provision) benefit from changes in the fair value of these financial instruments of $617 million. The increase in sensitivity to point-in-time income (loss) before income tax (provision) benefit from changes in the fair value of these financial instruments as of December 31, 2025, when compared to December 31, 2024, is primarily driven by equity market performance during the year, which has resulted in more equity exposure to public equity market price declines. The financial instruments included in the sensitivity analysis are carried at fair value and changes in fair value are recognized in earnings. These financial instruments include public equity investments, derivative instruments, market risk benefits and the indexed annuity embedded derivative.
139
ITEM 8. FINANCIAL STATEMENTS AND SUPPLEMENTARY DATA
Index to Consolidated Financial Statements
140
REPORT OF INDEPENDENT REGISTERED PUBLIC ACCOUNTING FIRM
To the Stockholders and the Board of Directors of Apollo Global Management, Inc.
Opinions on the Financial Statements and Internal Control over Financial Reporting
We have audited the accompanying consolidated statements of financial condition of Apollo Global Management, Inc. and subsidiaries (the "Company") as of December 31, 2025 and 2024, the related consolidated statements of operations, comprehensive income (loss), equity, and cash flows, for each of the three years in the period ended December 31, 2025, and the related notes and the schedule listed in the Index at Item 15 (collectively referred to as the "financial statements"). We also have audited the Company’s internal control over financial reporting as of December 31, 2025, based on criteria established in Internal Control — Integrated Framework (2013) issued by the Committee of Sponsoring Organizations of the Treadway Commission (COSO).
In our opinion, the financial statements referred to above present fairly, in all material respects, the financial position of the Company as of December 31, 2025 and 2024, and the results of its operations and its cash flows for each of the three years in the period ended December 31, 2025, in conformity with accounting principles generally accepted in the United States of America. Also, in our opinion, the Company maintained, in all material respects, effective internal control over financial reporting as of December 31, 2025, based on criteria established in Internal Control — Integrated Framework (2013) issued by COSO.
As described in Management’s Report on Internal Control Over Financial Reporting, management excluded from its assessment the internal control over financial reporting at Bridge Investment Group Holdings Inc. (“Bridge”), which was acquired on September 2, 2025, and whose financial statements constitute 0.5% of total assets, 0.3% of revenues, and (1.2)% of net income (loss) of the consolidated financial statement amounts as of and for the year ended December 31, 2025. Accordingly, our audit did not include the internal control over financial reporting at Bridge.
Basis for Opinions
The Company’s management is responsible for these financial statements, for maintaining effective internal control over financial reporting, and for its assessment of the effectiveness of internal control over financial reporting, included in the accompanying Management’s Report on Internal Control over Financial Reporting. Our responsibility is to express an opinion on these financial statements and an opinion on the Company’s internal control over financial reporting based on our audits. We are a public accounting firm registered with the Public Company Accounting Oversight Board (United States) (PCAOB) and are required to be independent with respect to the Company in accordance with the U.S. federal securities laws and the applicable rules and regulations of the Securities and Exchange Commission and the PCAOB.
We conducted our audits in accordance with the standards of the PCAOB. Those standards require that we plan and perform the audits to obtain reasonable assurance about whether the financial statements are free of material misstatement, whether due to error or fraud, and whether effective internal control over financial reporting was maintained in all material respects.
Our audits of the financial statements included performing procedures to assess the risks of material misstatement of the financial statements, whether due to error or fraud, and performing procedures to respond to those risks. Such procedures included examining, on a test basis, evidence regarding the amounts and disclosures in the financial statements. Our audits also included evaluating the accounting principles used and significant estimates made by management, as well as evaluating the overall presentation of the financial statements. Our audit of internal control over financial reporting included obtaining an understanding of internal control over financial reporting, assessing the risk that a material weakness exists, and testing and evaluating the design and operating effectiveness of internal control based on the assessed risk. Our audits also included performing such other procedures as we considered necessary in the circumstances. We believe that our audits provide a reasonable basis for our opinions.
Definition and Limitations of Internal Control over Financial Reporting
A company’s internal control over financial reporting is a process designed to provide reasonable assurance regarding the reliability of financial reporting and the preparation of financial statements for external purposes in accordance with generally accepted accounting principles. A company’s internal control over financial reporting includes those policies and procedures that (1) pertain to the maintenance of records that, in reasonable detail, accurately and fairly reflect the transactions and
141
dispositions of the assets of the company; (2) provide reasonable assurance that transactions are recorded as necessary to permit preparation of financial statements in accordance with generally accepted accounting principles, and that receipts and expenditures of the company are being made only in accordance with authorizations of management and directors of the company; and (3) provide reasonable assurance regarding prevention or timely detection of unauthorized acquisition, use, or disposition of the company’s assets that could have a material effect on the financial statements.
Because of its inherent limitations, internal control over financial reporting may not prevent or detect misstatements. Also, projections of any evaluation of effectiveness to future periods are subject to the risk that controls may become inadequate because of changes in conditions, or that the degree of compliance with the policies or procedures may deteriorate.
Critical Audit Matters
The critical audit matters communicated below are matters arising from the current-period audit of the financial statements that were communicated or required to be communicated to the audit committee and that (1) relate to accounts or disclosures that are material to the financial statements and (2) involved our especially challenging, subjective, or complex judgments. The communication of critical audit matters does not alter in any way our opinion on the financial statements, taken as a whole, and we are not, by communicating the critical audit matters below, providing separate opinions on the critical audit matters or on the accounts or disclosures to which they relate.
Fair Value of Certain Underlying Investments to Determine Performance Allocations— Refer to Note 2, Summary of Significant Accounting Policies and Note 4, Investments
Critical Audit Matter Description
The Company, through its asset management business, recognizes performance allocations from certain funds it manages within investment income to the extent these funds meet or achieve certain performance criteria. The Company recognizes performance allocations each reporting period based on the terms outlined in the respective fund governing agreements. The change in the fair value of the underlying investments held by the funds is the significant input into the calculation of performance allocations to be recognized in investment income.
Certain funds may hold significant illiquid investments whose fair values are based on unobservable inputs. These investments have limited observable market activity and the inputs used in the determination of the investments fair value require significant management judgement or estimation. Changes in the fair value of these investments directly impact the amount of performance allocations the Company is entitled to recognize as investment income for the period.
We considered the valuation of certain investments without readily determinable fair values used in the calculation of performance allocations as a critical audit matter because of the valuation techniques, assumptions, market impacts and the degree of subjectivity of certain unobservable inputs used in the valuation. Auditing the fair value of these investments required a high degree of auditor judgment and increased effort, including the involvement of our internal fair value specialists as needed, who possess significant fair value methodology and modeling expertise.
How the Critical Audit Matter Was Addressed in the Audit
Our audit procedures related to the valuation models and significant unobservable inputs utilized by the Company to estimate the fair value of certain illiquid investments held by the funds included the following, among others:
•We involved senior, more experienced audit team members in the performance of our audit procedures.
•We tested the design and operating effectiveness of controls over management’s determination of the fair value of certain illiquid investments.
•With the assistance of our fair value specialists, we evaluated the valuation methods, assumptions and unobservable inputs used by the Company to determine the fair value of certain illiquid investments held by the funds.
•We evaluated the Company’s historical ability to accurately estimate the fair value of illiquid investments by comparing previous estimates of fair value to market transactions with third parties.
142
Valuation of Certain Structured Level 3 Asset-Backed Securities - Refer to Note 4, Investments, Note 7, Fair Value, and Note 18, Related Parties
Critical Audit Matter Description
Investments in certain structured Level 3 asset-backed securities held by the Company, through its retirement services business, are reported at fair value in the consolidated financial statements. These investments without readily determinable market values, are valued using significant unobservable inputs that involve considerable judgment by management. The Company uses internal modeling techniques based on projected cash flows and certain other unobservable inputs to value its structured Level 3 asset-backed securities. The significant unobservable inputs may include discount rates, issue specific credit adjustments, material non-public financial information, estimation of future earnings and cash flows, default rate assumptions, and liquidity assumptions.
Given that the Company utilizes valuation models and significant unobservable inputs to estimate the fair value for certain of its structured Level 3 asset-backed securities, performing audit procedures to evaluate these inputs required a high degree of auditor judgment and an increased extent of effort, including the involvement of our fair value specialists.
How the Critical Audit Matter Was Addressed in the Audit
Our audit procedures related to the valuation models and significant unobservable inputs utilized by the Company to estimate the fair value of investments in certain structured Level 3 asset-backed securities included the following, among others:
•We involved senior, more experienced audit team members in the performance of our audit procedures.
•We tested the design and operating effectiveness of controls over management’s determination of the fair value of these securities.
•With the assistance of our fair value specialists, we:
–Evaluated the valuation models and unobservable inputs used by the Company to estimate fair value for a sample of these securities.
–Developed independent fair value estimates and compared our estimates to the Company’s estimates for a sample of these securities.
•On a sample basis, we evaluated the Company’s historical ability to accurately estimate the fair value of these securities by comparing previous estimates of fair value to market transactions with third parties adjusted for changes in market conditions.
Certain Assumptions Used in the Valuation of Market Risk Benefits and Interest Sensitive Contract Liabilities - Refer to Note 2, Summary of Significant Accounting Policies, Note 7, Fair Value, and Note 11, Long-duration Contracts
Critical Audit Matter Description
The Company determines estimated valuations of Market Risk Benefits and Interest Sensitive Contract Liabilities, which include embedded derivatives. The Company’s valuations are based on actuarial methodologies and include significant unobservable inputs associated with underlying economic and future policyholder behavior assumptions.
Significant judgment is applied by the Company in determining these assumptions. Specifically, the future policyholder behavior assumptions related to lapses and the use of benefit riders, as well as the assumptions for the future equity option costs or option budget and risk margin involve significant unobservable inputs and may materially impact the estimated valuation of Market Risk Benefits and Interest Sensitive Contract Liabilities, which include embedded derivatives.
Given the significant judgement involved with determining these economic and policyholder behavior assumptions, auditing these estimates requires a high degree of auditor judgment and an increased extent of effort, including the involvement of our fair value and actuarial specialists.
143
How the Critical Audit Matter Was Addressed in the Audit
Our audit procedures related to these economic and policyholder behavior assumptions determined by the Company included the following, among others:
•We involved senior, more experienced audit team members, including fair value and actuarial specialists, to plan and perform audit procedures.
•We tested the design and operating effectiveness of controls over management’s development of these assumptions, including those controls over the underlying data.
•With the assistance of our fair value and actuarial specialists, we:
–Evaluated the methods, models, and judgements applied by the Company in determining these assumptions, including evaluating the results of experience studies or other data used as a basis for setting those assumptions.
–Evaluated the reasonableness of the Company’s assumptions by comparing those selected by management to those independently developed by our fair value and actuarial specialists, drawing upon standard actuarial and industry practices.
/s/ Deloitte & Touche LLP
February 25, 2026
We have served as the Company's auditor since 2007.
144
| (In millions, except share data) | As of December 31, 2025 | As of December 31, 2024 | |||||||||
| Assets | |||||||||||
| Asset Management | |||||||||||
| Cash and cash equivalents | $ | $ | |||||||||
| Restricted cash and cash equivalents | |||||||||||
| Investments | |||||||||||
| Assets of consolidated variable interest entities | |||||||||||
| Cash and cash equivalents | |||||||||||
| Investments | |||||||||||
| Due from related parties | |||||||||||
| Other assets | |||||||||||
| Due from related parties | |||||||||||
| Goodwill | |||||||||||
| Other assets | |||||||||||
| Retirement Services | |||||||||||
| Cash and cash equivalents | |||||||||||
| Restricted cash and cash equivalents | |||||||||||
| Investments | |||||||||||
| Investments in related parties | |||||||||||
| Assets of consolidated variable interest entities | |||||||||||
| Cash and cash equivalents | |||||||||||
| Investments | |||||||||||
| Other assets | |||||||||||
| Reinsurance recoverable | |||||||||||
| Deferred acquisition costs, deferred sales inducements and value of business acquired | |||||||||||
| Goodwill | |||||||||||
| Other assets | |||||||||||
| Total Assets | $ | $ | |||||||||
| (Continued) | |||||||||||
See accompanying notes to the consolidated financial statements. | |||||||||||
145
| (In millions, except share data) | As of December 31, 2025 | As of December 31, 2024 | |||||||||
| Liabilities, Redeemable non-controlling interests and Equity | |||||||||||
| Liabilities | |||||||||||
| Asset Management | |||||||||||
| Accounts payable, accrued expenses, and other liabilities | $ | $ | |||||||||
| Due to related parties | |||||||||||
| Debt | |||||||||||
| Liabilities of consolidated variable interest entities | |||||||||||
Accounts payable, accrued expenses, and other liabilities | |||||||||||
| Retirement Services | |||||||||||
| Interest sensitive contract liabilities | |||||||||||
| Future policy benefits | |||||||||||
| Market risk benefits | |||||||||||
| Debt | |||||||||||
| Payables for collateral on derivatives and securities to repurchase | |||||||||||
| Other liabilities | |||||||||||
| Liabilities of consolidated variable interest entities | |||||||||||
| Other liabilities | |||||||||||
| Total Liabilities | |||||||||||
Commitments and Contingencies (note 19) | |||||||||||
| Redeemable non-controlling interests | |||||||||||
| Redeemable non-controlling interests | |||||||||||
| Equity | |||||||||||
Mandatory Convertible Preferred Stock, | |||||||||||
Common Stock, $ | |||||||||||
| Additional paid in capital | |||||||||||
| Retained earnings (accumulated deficit) | |||||||||||
| Accumulated other comprehensive income (loss) | ( | ( | |||||||||
| Total Apollo Global Management, Inc. Stockholders’ Equity | |||||||||||
| Non-controlling interests | |||||||||||
| Total Equity | |||||||||||
| Total Liabilities, Redeemable non-controlling interests and Equity | $ | $ | |||||||||
| (Concluded) | |||||||||||
See accompanying notes to the consolidated financial statements. | |||||||||||
146
| Years ended December 31, | |||||||||||||||||
| (In millions, except per share data) | 2025 | 2024 | 2023 | ||||||||||||||
| Revenues | |||||||||||||||||
| Asset Management | |||||||||||||||||
| Management fees | $ | $ | $ | ||||||||||||||
| Advisory and transaction fees, net | |||||||||||||||||
| Investment income (loss) | |||||||||||||||||
| Incentive fees | |||||||||||||||||
| Property management, development and other fees | |||||||||||||||||
| Retirement Services | |||||||||||||||||
| Premiums | |||||||||||||||||
| Product charges | |||||||||||||||||
| Net investment income | |||||||||||||||||
| Investment related gains (losses) | |||||||||||||||||
| Revenues of consolidated variable interest entities | |||||||||||||||||
| Other revenues | |||||||||||||||||
| Total Revenues | |||||||||||||||||
| Expenses | |||||||||||||||||
| Asset Management | |||||||||||||||||
| Compensation and benefits | |||||||||||||||||
| Interest expense | |||||||||||||||||
| General, administrative and other | |||||||||||||||||
| Retirement Services | |||||||||||||||||
| Interest sensitive contract benefits | |||||||||||||||||
| Future policy and other policy benefits | |||||||||||||||||
| Market risk benefits remeasurement (gains) losses | ( | ||||||||||||||||
| Amortization of deferred acquisition costs, deferred sales inducements and value of business acquired | |||||||||||||||||
| Policy and other operating expenses | |||||||||||||||||
| Total Expenses | |||||||||||||||||
Other income (loss) – Asset Management | |||||||||||||||||
| Net gains (losses) from investment activities | ( | ||||||||||||||||
| Net gains (losses) from investment activities of consolidated variable interest entities | |||||||||||||||||
| Other income (loss), net | ( | ||||||||||||||||
| Total Other income (loss) | ( | ||||||||||||||||
| Income (loss) before income tax (provision) benefit | |||||||||||||||||
| Income tax (provision) benefit | ( | ( | |||||||||||||||
| Net income (loss) | |||||||||||||||||
| Net (income) loss attributable to non-controlling interests | ( | ( | ( | ||||||||||||||
| Net income (loss) attributable to Apollo Global Management, Inc. | |||||||||||||||||
| Preferred stock dividends | ( | ( | ( | ||||||||||||||
| Net income (loss) attributable to Apollo Global Management, Inc. common stockholders | $ | $ | $ | ||||||||||||||
| Earnings (loss) per share | |||||||||||||||||
Net income (loss) attributable to common stockholders – Basic | $ | $ | $ | ||||||||||||||
Net income (loss) attributable to common stockholders – Diluted | $ | $ | $ | ||||||||||||||
| Weighted average shares outstanding – Basic | |||||||||||||||||
| Weighted average shares outstanding – Diluted | |||||||||||||||||
See accompanying notes to the consolidated financial statements. | |||||||||||||||||
147
APOLLO GLOBAL MANAGEMENT, INC.
CONSOLIDATED STATEMENTS OF COMPREHENSIVE INCOME (LOSS)
| Years ended December 31, | |||||||||||||||||
| (In millions) | 2025 | 2024 | 2023 | ||||||||||||||
| Net income (loss) | $ | $ | |||||||||||||||
| Other comprehensive income (loss), before tax | |||||||||||||||||
| Unrealized investment gains (losses) on available-for-sale securities | ( | ||||||||||||||||
| Unrealized gains (losses) on hedging instruments | ( | ( | |||||||||||||||
| Remeasurement gains (losses) on future policy benefits related to discount rate | ( | ( | |||||||||||||||
| Remeasurement gains (losses) on market risk benefits related to credit risk | ( | ( | ( | ||||||||||||||
| Foreign currency translation and other adjustments | ( | ||||||||||||||||
| Other comprehensive income (loss), before tax | |||||||||||||||||
| Income tax provision (benefit) related to other comprehensive income (loss) | |||||||||||||||||
| Other comprehensive income (loss) | ( | ||||||||||||||||
| Comprehensive income (loss) | |||||||||||||||||
| Comprehensive (income) loss attributable to non-controlling interests | ( | ( | ( | ||||||||||||||
| Comprehensive income (loss) attributable to Apollo Global Management, Inc. | $ | $ | $ | ||||||||||||||
See accompanying notes to the consolidated financial statements. | |||||||||||||||||
148
| For the Year Ended December 31, 2023 | |||||||||||||||||||||||||||||||||||||||||||||||
| Apollo Global Management, Inc. Stockholders | |||||||||||||||||||||||||||||||||||||||||||||||
| (In millions, except share data) | Common Stock | Series A Mandatory Convertible Preferred Stock | Additional Paid in Capital | Retained Earnings (Accumulated Deficit) | Accumulated Other Comprehensive Income (Loss) | Total Apollo Global Management, Inc. Stockholders’ Equity (Deficit) | Non-Controlling Interests | Total Equity | |||||||||||||||||||||||||||||||||||||||
| Balance at January 1, 2023 | $ | $ | $ | ( | $ | ( | $ | $ | $ | ||||||||||||||||||||||||||||||||||||||
| Other changes in equity of non-controlling interests | — | — | — | — | — | — | ( | ( | |||||||||||||||||||||||||||||||||||||||
| Accretion of redeemable non-controlling interests | — | — | ( | — | — | ( | — | ( | |||||||||||||||||||||||||||||||||||||||
| Liquidation of SPACs | — | — | — | — | |||||||||||||||||||||||||||||||||||||||||||
| Equity issued in connection with Mandatory Convertible Preferred Stock | — | — | — | — | — | ||||||||||||||||||||||||||||||||||||||||||
| Capital increase related to equity-based compensation | — | — | — | — | — | ||||||||||||||||||||||||||||||||||||||||||
| Capital contributions | — | — | — | — | — | — | |||||||||||||||||||||||||||||||||||||||||
| Dividends/distributions | — | ( | ( | ( | — | ( | ( | ( | |||||||||||||||||||||||||||||||||||||||
| Payments related to issuances of common stock for equity-based awards | — | ( | — | ( | — | ( | |||||||||||||||||||||||||||||||||||||||||
| Repurchase of common stock | ( | — | ( | — | — | ( | — | ( | |||||||||||||||||||||||||||||||||||||||
| Stock option exercises | — | — | — | — | |||||||||||||||||||||||||||||||||||||||||||
| Redemption of subsidiary equity interests | — | — | ( | — | — | ( | ( | ( | |||||||||||||||||||||||||||||||||||||||
| Subsidiary issuance of equity interests | — | — | — | ||||||||||||||||||||||||||||||||||||||||||||
| Net income (loss) | — | — | — | ||||||||||||||||||||||||||||||||||||||||||||
| Other comprehensive income (loss) | — | — | — | — | |||||||||||||||||||||||||||||||||||||||||||
| Balance at December 31, 2023 | $ | $ | $ | $ | ( | $ | $ | $ | |||||||||||||||||||||||||||||||||||||||
| (Continued) | |||||||||||||||||||||||||||||||||||||||||||||||
149
| For the Year Ended December 31, 2024 | |||||||||||||||||||||||||||||||||||||||||||||||
| Apollo Global Management, Inc. Stockholders | |||||||||||||||||||||||||||||||||||||||||||||||
| (In millions, except share data) | Common Stock | Series A Mandatory Convertible Preferred Stock | Additional Paid in Capital | Retained Earnings (Accumulated Deficit) | Accumulated Other Comprehensive Income (Loss) | Total Apollo Global Management, Inc. Stockholders’ Equity (Deficit) | Non-Controlling Interests | Total Equity | |||||||||||||||||||||||||||||||||||||||
Balance at January 1, 2024 | $ | $ | $ | $ | ( | $ | $ | $ | |||||||||||||||||||||||||||||||||||||||
| Consolidation/deconsolidation of VIEs | — | — | — | — | — | — | |||||||||||||||||||||||||||||||||||||||||
| Issuance of warrants | — | — | — | — | — | ||||||||||||||||||||||||||||||||||||||||||
| Other changes in equity of non-controlling interests | — | — | — | — | — | — | |||||||||||||||||||||||||||||||||||||||||
| Issuance of common stock related to equity transactions | — | — | — | — | |||||||||||||||||||||||||||||||||||||||||||
| Accretion of redeemable non-controlling interests | — | — | ( | — | — | ( | — | ( | |||||||||||||||||||||||||||||||||||||||
| Capital increase related to equity-based compensation | — | — | — | — | — | ||||||||||||||||||||||||||||||||||||||||||
| Capital contributions | — | — | — | — | — | — | |||||||||||||||||||||||||||||||||||||||||
| Dividends/distributions | — | ( | — | ( | — | ( | ( | ( | |||||||||||||||||||||||||||||||||||||||
| Payments related to issuances of common stock for equity-based awards | — | ( | — | ( | — | ( | |||||||||||||||||||||||||||||||||||||||||
| Repurchase of common stock | ( | — | ( | — | — | ( | — | ( | |||||||||||||||||||||||||||||||||||||||
| Stock option exercises | — | — | — | — | |||||||||||||||||||||||||||||||||||||||||||
| Subsidiary issuance of equity interests | — | — | — | — | |||||||||||||||||||||||||||||||||||||||||||
| Net income (loss) | — | — | — | ||||||||||||||||||||||||||||||||||||||||||||
| Other comprehensive income (loss) | — | — | — | — | ( | ( | |||||||||||||||||||||||||||||||||||||||||
Balance at December 31, 2024 | $ | $ | $ | $ | ( | $ | $ | $ | |||||||||||||||||||||||||||||||||||||||
| (Continued) | |||||||||||||||||||||||||||||||||||||||||||||||
150
| For the Year Ended December 31, 2025 | |||||||||||||||||||||||||||||||||||||||||||||||
| Apollo Global Management, Inc. Stockholders | |||||||||||||||||||||||||||||||||||||||||||||||
| (In millions, except share data) | Common Stock | Series A Mandatory Convertible Preferred Stock | Additional Paid in Capital | Retained Earnings (Accumulated Deficit) | Accumulated Other Comprehensive Income (Loss) | Total Apollo Global Management, Inc. Stockholders’ Equity (Deficit) | Non-Controlling Interests | Total Equity | |||||||||||||||||||||||||||||||||||||||
Balance at January 1, 2025 | $ | $ | $ | $ | ( | $ | $ | $ | |||||||||||||||||||||||||||||||||||||||
| Consolidation/deconsolidation of VIEs | — | — | — | — | — | — | |||||||||||||||||||||||||||||||||||||||||
| Issuance of warrants | — | — | — | — | — | ||||||||||||||||||||||||||||||||||||||||||
| Acquisition of Bridge | — | — | — | ||||||||||||||||||||||||||||||||||||||||||||
| Other changes in equity of non-controlling interests | — | — | — | — | — | — | ( | ( | |||||||||||||||||||||||||||||||||||||||
| Issuance of common stock related to equity transactions | — | — | — | — | — | — | — | ||||||||||||||||||||||||||||||||||||||||
| Accretion of redeemable non-controlling interests | — | — | — | — | — | ||||||||||||||||||||||||||||||||||||||||||
| Issuance of common stock to donor-advised fund | — | — | — | — | |||||||||||||||||||||||||||||||||||||||||||
| Capital increase related to equity-based compensation | — | — | — | — | — | ||||||||||||||||||||||||||||||||||||||||||
| Capital contributions | — | — | — | — | — | — | |||||||||||||||||||||||||||||||||||||||||
| Dividends/distributions | — | ( | — | ( | — | ( | ( | ( | |||||||||||||||||||||||||||||||||||||||
| Payments related to issuances of common stock for equity-based awards | — | ( | — | ( | — | ( | |||||||||||||||||||||||||||||||||||||||||
| Repurchase of common stock | ( | — | ( | — | — | ( | — | ( | |||||||||||||||||||||||||||||||||||||||
| Stock option and warrant exercises | — | — | — | — | |||||||||||||||||||||||||||||||||||||||||||
| Net income (loss) | — | — | — | ||||||||||||||||||||||||||||||||||||||||||||
| Other comprehensive income (loss) | — | — | — | — | |||||||||||||||||||||||||||||||||||||||||||
Balance at December 31, 2025 | $ | $ | $ | $ | ( | $ | $ | $ | |||||||||||||||||||||||||||||||||||||||
| (Concluded) | |||||||||||||||||||||||||||||||||||||||||||||||
See accompanying notes to the consolidated financial statements. | |||||||||||||||||||||||||||||||||||||||||||||||
151
| Years ended December 31, | |||||||||||||||||
| (In millions) | 2025 | 2024 | 2023 | ||||||||||||||
| Cash Flows from Operating Activities | |||||||||||||||||
| Net income (loss) | $ | $ | $ | ||||||||||||||
| Adjustments to reconcile net income (loss) to net cash provided by operating activities: | |||||||||||||||||
| Equity-based compensation | |||||||||||||||||
| Net investment income | ( | ( | ( | ||||||||||||||
| Net recognized (gains) losses on investments and derivatives | ( | ( | ( | ||||||||||||||
| Depreciation and amortization | |||||||||||||||||
| Net amortization (accretion) of net investment premiums, discount and other | ( | ( | |||||||||||||||
| Policy acquisition costs deferred | ( | ( | ( | ||||||||||||||
| Other non-cash amounts included in net income (loss), net | ( | ||||||||||||||||
| Changes in consolidation | ( | ( | |||||||||||||||
| Changes in operating assets and liabilities: | |||||||||||||||||
| Purchases of investments by funds and VIEs | ( | ( | ( | ||||||||||||||
| Proceeds from sale of investments by funds and VIEs | |||||||||||||||||
| Interest sensitive contract liabilities | |||||||||||||||||
| Future policy benefits, market risk benefits and reinsurance recoverable | ( | ( | |||||||||||||||
| Other assets and liabilities, net | ( | ( | ( | ||||||||||||||
| Net cash provided by operating activities | |||||||||||||||||
| Cash Flows from Investing Activities | |||||||||||||||||
| Purchases of investments and contributions to equity method investments | ( | ( | ( | ||||||||||||||
| Purchases of available-for-sale securities | ( | ( | ( | ||||||||||||||
| Purchases of mortgage loans | ( | ( | ( | ||||||||||||||
| Purchases of investment funds | ( | ( | ( | ||||||||||||||
| Purchases of U.S. Treasury securities | ( | ( | |||||||||||||||
| Purchases of derivatives instruments and other investments | ( | ( | ( | ||||||||||||||
| Sales, maturities and repayments of investments and distributions from equity method investments | |||||||||||||||||
| Acquisition of subsidiaries, net of cash acquired | |||||||||||||||||
| Other investing activities, net | ( | ( | |||||||||||||||
| Net cash used in investing activities | ( | ( | ( | ||||||||||||||
| Cash Flows from Financing Activities | |||||||||||||||||
| Issuance of debt | |||||||||||||||||
| Repayment of debt | ( | ( | ( | ||||||||||||||
| Redemption of subsidiary equity interests | ( | ||||||||||||||||
| Repurchase of common stock | ( | ( | ( | ||||||||||||||
| Common stock dividends | ( | ( | ( | ||||||||||||||
| Preferred stock dividends | ( | ( | ( | ||||||||||||||
| Distributions paid to non-controlling interests | ( | ( | ( | ||||||||||||||
| Contributions from non-controlling interests | |||||||||||||||||
| Distributions to redeemable non-controlling interests | ( | ||||||||||||||||
| Issuance of Mandatory Convertible Preferred Stock, net of issuance costs | |||||||||||||||||
| Deposits on investment-type policies and contracts | |||||||||||||||||
| Withdrawals on investment-type policies and contracts | ( | ( | ( | ||||||||||||||
| Subsidiary issuance of equity interests to non-controlling interests | |||||||||||||||||
| Net change in cash collateral posted for derivative transactions and securities to repurchase | |||||||||||||||||
| Other financing activities, net | ( | ( | |||||||||||||||
| Net cash provided by financing activities | |||||||||||||||||
| (Continued) | |||||||||||||||||
152
| Years ended December 31, | |||||||||||||||||
| (In millions) | 2025 | 2024 | 2023 | ||||||||||||||
| Effect of exchange rate changes on cash and cash equivalents | ( | ||||||||||||||||
| Net increase (decrease) in cash and cash equivalents, restricted cash and cash held at consolidated variable interest entities | ( | ||||||||||||||||
| Cash and cash equivalents, restricted cash and cash equivalents, and cash and cash equivalents held at consolidated variable interest entities, beginning of period | |||||||||||||||||
| Cash and cash equivalents, restricted cash and cash equivalents, and cash and cash equivalents held at consolidated variable interest entities, end of period | $ | $ | $ | ||||||||||||||
| Supplemental Disclosure of Cash Flow Information | |||||||||||||||||
| Cash paid for taxes | $ | $ | $ | ||||||||||||||
| Cash paid for interest | |||||||||||||||||
| Non-cash transactions | |||||||||||||||||
| Non-cash investing activities | |||||||||||||||||
| Asset Management and Other | |||||||||||||||||
| Purchase of investments | |||||||||||||||||
| Retirement Services | |||||||||||||||||
| Investments received from settlements on reinsurance agreements | |||||||||||||||||
| Investments received at inception of reinsurance agreements | |||||||||||||||||
| Investments received from pension group annuity premiums | |||||||||||||||||
| Reduction in investments relating to recapture of reinsurance agreement | |||||||||||||||||
| Investments exchanged with third-party cedants | |||||||||||||||||
| Non-cash financing activities | |||||||||||||||||
| Asset Management and Other | |||||||||||||||||
| Capital increases related to equity-based compensation | |||||||||||||||||
| Issuance of warrants | |||||||||||||||||
| Issuance of restricted shares | |||||||||||||||||
| Issuance of common stock related to equity transactions | |||||||||||||||||
| Subsidiary issuance of equity interest | |||||||||||||||||
| Issuance of common stock to donor-advise fund | |||||||||||||||||
| Retirement Services | |||||||||||||||||
| Deposits on investment-type policies and contracts through reinsurance agreements, net assumed (ceded) | ( | ( | |||||||||||||||
| Withdrawals on investment-type policies and contracts through reinsurance agreements, net assumed (ceded) | |||||||||||||||||
| Distribution of investments to non-controlling interests of consolidated VIEs | |||||||||||||||||
| Borrowings of VIEs settled with investments | |||||||||||||||||
Reconciliation of cash and cash equivalents, restricted cash and cash equivalents, and cash and cash equivalents held at consolidated variable interest entities to the consolidated Statements of Financial Condition: | |||||||||||||||||
| Cash and cash equivalents | $ | $ | $ | ||||||||||||||
| Restricted cash and cash equivalents | |||||||||||||||||
| Cash and cash equivalents held at consolidated variable interest entities | |||||||||||||||||
| Total cash and cash equivalents, restricted cash and cash equivalents, and cash and cash equivalents held at consolidated variable interest entities | $ | $ | $ | ||||||||||||||
| (Concluded) | |||||||||||||||||
See accompanying notes to the consolidated financial statements. | |||||||||||||||||
153
1. Organization
Apollo Global Management, Inc. together with its consolidated subsidiaries (collectively, “Apollo” or the “Company”) is a high-growth, global alternative asset manager and a retirement services provider. Apollo’s asset management business focuses on two investing strategies: credit and equity. Through its asset management business, Apollo raises, invests and manages funds, accounts and other vehicles, on behalf of some of the world’s most prominent pension, endowment and sovereign wealth funds and insurance companies, as well as other institutional and individual investors. Apollo’s retirement services business is conducted by Athene, a leading financial services company that specializes in issuing, reinsuring and acquiring retirement savings products for the increasing number of individuals and institutions seeking to fund retirement needs.
Acquisition of Bridge
On September 2, 2025 (the “Acquisition Date”), Apollo completed the previously announced acquisition of Bridge in an all-stock transaction. As a result, Bridge became a consolidated subsidiary of AAM. Bridge’s results are included in the consolidated financial statements commencing from the Acquisition Date.
2. Summary of Significant Accounting Policies
Basis of Presentation and Consolidation
The accompanying consolidated financial statements are prepared in accordance with U.S. GAAP. The results of the Company and its subsidiaries are presented on a consolidated basis. Any ownership interest other than the Company’s interest in its subsidiaries is reflected as a non-controlling interest. Intercompany accounts and transactions have been eliminated. Management believes it has made all necessary adjustments (consisting only of normal recurring items) so that the consolidated financial statements are presented fairly and that any estimates made are reasonable and prudent. Certain reclassifications have been made to previously reported amounts to conform to the current period’s presentation.
Following the Mergers, the Company’s principal subsidiaries, AAM and AHL, together with their subsidiaries, operate an asset management business and a retirement services business, respectively, which possess distinct characteristics. As a result, the Company’s financial statement presentation is organized into two tiers: asset management and retirement services. The Company believes that separate presentation provides a more informative view of the Company’s consolidated financial condition and results of operations than an aggregated presentation.
The following summary of significant accounting policies first includes those most significant to the overall Company and then specific accounting policies for each of the asset management and retirement services businesses, respectively.
Significant Accounting Policies – Overall
Consolidation
The Company consolidates entities where it has a controlling financial interest unless there is a specific scope exception that prevents consolidation. The types of entities with which the Company is involved generally include, but are not limited to:
•subsidiaries, which includes AAM and its subsidiaries, including management companies and general partners of funds that the Company manages, and AHL and its subsidiaries,
•funds, including entities that have attributes of an investment company, and
•CLOs.
154
Investment Companies
Judgment is required to evaluate whether an entity has the necessary characteristics to be accounted for as an investment company under U.S. GAAP. The funds managed by the Company that meet the investment company criteria reflect their investments at fair value. The Company has retained this specialized accounting for investment companies in consolidation.
Variable Interest Entities
All entities are first considered under the VIE model. VIEs are entities that 1) do not have sufficient equity at risk to finance their activities without additional subordinated financial support or 2) have equity investors at risk that do not have the ability to make significant decisions related to the entity’s operations, absorb expected losses, or receive expected residual returns.
The Company consolidates a VIE if it is the primary beneficiary of the entity. The Company is deemed the primary beneficiary when it has a controlling financial interest in the VIE, which is defined as possessing both (i) the power to direct the activities of the VIE that most significantly impact the VIE’s economic performance (“primary beneficiary power”) and (ii) the obligation to absorb losses or the right to receive benefits from the VIE that could potentially be significant (“significant variable interest”). The Company performs the VIE and primary beneficiary assessment at inception of its involvement with a VIE and on an ongoing basis if facts and circumstances change.
To assess whether the Company has the primary beneficiary power under the VIE consolidation model, it considers the design of the entity as well as ongoing rights and responsibilities. In general, the parties that can make the most significant decisions regarding asset management have control over servicing, liquidation rights or the unilateral right to remove the decision-makers. To assess whether the Company has a significant variable interest, the Company considers all its economic interests that are considered variable interests in the entity, including interests held through related parties. This assessment requires judgment in considering whether those interests are significant.
Assets and liabilities of the consolidated VIEs are primarily shown in separate sections within the consolidated statements of financial condition. Changes in the fair value of the consolidated VIEs’ assets and liabilities and related interest, dividend and other income and expenses are primarily presented within net gains from investment activities of consolidated variable interest entities in the consolidated statements of operations. The portion attributable to non-controlling interests is reported within net income attributable to non-controlling interests in the consolidated statements of operations. For additional disclosures regarding VIEs, see notes 6 and 18.
Voting Interest Entities
Entities that are not determined to be VIEs are generally considered VOEs. Under the voting interest model, the Company consolidates those entities it controls through a majority voting interest. The Company does not consolidate those VOEs in which unrelated investors have substantive kick-out rights to either dissolve the fund or remove the general partner.
Non-controlling Interests
For entities that are consolidated, but not wholly owned, a portion of the income or loss and corresponding equity is allocated to owners other than the Company. The aggregate of the income or loss and corresponding equity that is not owned by the Company is included in non-controlling interests in the consolidated financial statements. Non-controlling interests also include ownership interests in certain consolidated funds and VIEs.
Non-controlling interests are presented as a separate component of equity on the Company’s consolidated statements of financial condition. Net income (loss) includes the net income (loss) attributable to the holders of non-controlling interests on the Company’s consolidated statements of operations. Profits and losses are allocated to non-controlling interests in proportion to their relative ownership interests regardless of their basis.
Use of Estimates
The preparation of the consolidated financial statements requires management to make estimates and assumptions that affect the reported amounts in the financial statements and related notes. The Company’s most significant estimates include goodwill and intangible assets, income taxes, performance allocations, incentive fees, non-cash compensation, fair value of investments (including derivatives) and debt, impairment of investments and allowances for expected credit losses, and future policy benefit
155
reserves. While such impact may change considerably over time, the estimates and assumptions affecting the Company’s consolidated financial statements are based on the best available information as of December 31, 2025. Actual results could differ materially from those estimates.
Cash and Cash Equivalents
The Company considers all highly liquid short-term investments, including money market funds and U.S. Treasury securities, with original maturities of three months or less when purchased to be cash equivalents. Interest income from cash and cash equivalents is recorded in other income for asset management and net investment income for retirement services in the consolidated statements of operations. The carrying values of the money market funds and U.S. Treasury securities represent their fair values due to their short-term nature. Substantially all of the Company’s cash on deposit is in interest bearing accounts with major financial institutions and exceed insured limits.
Restricted Cash and Cash Equivalents
Restricted cash and cash equivalents represent balances that are restricted as to withdrawal or usage.
Restricted cash consists of cash and cash equivalents held in funds in trust as part of certain coinsurance agreements to secure statutory reserves and liabilities of the coinsured parties. Restricted cash also includes cash deposited at a bank that is pledged as collateral in connection with leased premises.
Foreign Currency
The Company holds foreign currency denominated assets and liabilities. Non-monetary assets and liabilities of the Company’s international subsidiaries are remeasured into the functional currency using historical exchange rates specific to each asset and liability, the exchange rates prevailing at the end of each reporting period are used for all others. The results of the Company’s foreign operations are remeasured using an average exchange rate for the respective reporting period. Currency remeasurement adjustments and gains and losses on the settlement of foreign currency translations are included within other income (loss), net for asset management or investment related gains (losses) for retirement services in the consolidated statements of operations. Foreign currency denominated assets and liabilities are translated into the reporting currency using the exchange rates prevailing at the end of each reporting period. Currency translation adjustments are included within other comprehensive income (loss), before tax within the consolidated statements of comprehensive income (loss). The change in unrealized foreign currency exchange of any non-U.S. dollar denominated AFS securities are included in other comprehensive income (“OCI”) unless they are designated as part of a fair value hedge.
Investments
Equity Method Investments
For investments in entities over which the Company exercises significant influence but does not meet the requirements for consolidation and has not elected the fair value option, the Company uses the equity method of accounting. Under the equity method of accounting, the Company records its share of the underlying income or loss of such entities adjusted for distributions. The Company’s share of the underlying net income or loss of such entities is recorded in investment income (loss) for asset management and net investment income for retirement services in the consolidated statements of operations.
The carrying amounts of equity method investments are recorded in investments or investments in related parties in the consolidated statements of financial condition. Generally, the underlying entities that the Company manages and invests in are primarily investment companies, and the carrying value of the Company’s equity method investments approximates fair value.
Reverse Repurchase Agreements and Repurchase Agreements
A reverse repurchase agreement is a transaction in which the Company purchases financial instruments from a seller and simultaneously enters into an agreement to resell the same or substantially the same financial instruments to the seller at a fixed and determinable price at a future date. A repurchase agreement is a transaction in which the Company sells financial instruments to a buyer, typically in exchange for cash, and simultaneously enters into an agreement to repurchase the same or substantially the same financial instruments from the buyer at a fixed and determinable price at a future date.
156
Although reverse repurchase and repurchase agreements generally involve the legal transfer of ownership of financial instruments, they are accounted for as financing arrangements because they require the financial instruments to be resold or repurchased before or at the maturity of the agreement. As a result, the collateral received under reverse repurchase agreements are not recognized and the collateral pledged under repurchase agreements are not derecognized in the consolidated statements of financial condition.
Within asset management, reverse repurchase and repurchase agreements generally sit within consolidated VIEs and as such, those reverse repurchase and repurchase agreements are reflected as investments and other liabilities, respectively, within the consolidated VIE section of the statements of financial condition. Additionally, the income (loss) related to those reverse repurchase and repurchase agreements from consolidated VIEs are included in net gains (losses) from investment activities of consolidated variable interest entities on the consolidated statements of operations. Reverse repurchase agreements within asset management are generally accounted for by electing the fair value option. For retirement services, the receivable under the reverse repurchase agreement is recorded as investment for the principal amount loaned under the agreement and the payable under a repurchase agreement is recognized as payables for collateral on derivatives and securities to repurchase on the consolidated statements of financial condition. Earnings from reverse repurchase agreements are included in net investment income for retirement services on the consolidated statements of operations.
Financial Instruments held by Consolidated VIEs
The consolidated VIEs managed by the Company are primarily investment companies and CLOs. Their investments include debt and equity securities held at fair value and reverse repurchase agreements. Financial instruments are generally accounted for on a trade date basis.
Under a measurement alternative permissible for consolidated collateralized financing entities, the Company measures both the financial assets and financial liabilities of consolidated CLOs in its consolidated financial statements in both cases using the fair value of the financial assets or financial liabilities, whichever are more observable.
Where financial assets are more observable, the financial assets of the consolidated CLOs are measured at fair value and the financial liabilities are measured in consolidation as: (i) the sum of the fair value of the financial assets and the carrying value of any non-financial assets that are incidental to the operations of the CLOs less (ii) the sum of the fair value of any beneficial interests retained by the Company (other than those that represent compensation for services) and the Company’s carrying value of any beneficial interests that represent compensation for services. The resulting amount is allocated to the individual financial liabilities (other than the beneficial interest retained by the Company) using a reasonable and consistent methodology.
Where financial liabilities are more observable, the financial liabilities of the consolidated CLOs are measured at fair value and the financial assets are measured in consolidation as: (i) the sum of the fair value of the financial liabilities, and the carrying value of any non-financial liabilities that are incidental to the operations of the CLOs less (ii) the carrying value of any non-financial assets that are incidental to the operations of the CLOs. The resulting amount is allocated to the individual financial assets using a reasonable and consistent methodology.
Net income (loss) attributable to Apollo Global Management, Inc. reflects the Company’s own economic interests in the consolidated CLOs, including (i) changes in the fair value of the beneficial interests retained by the Company and (ii) beneficial interests that represent compensation for collateral management services.
Certain consolidated VIEs have applied the fair value option for certain investments in private debt securities that otherwise would not have been carried at fair value with gains and losses in net income.
Fair Value of Financial Instruments
The fair value of a financial instrument is the price that would be received to sell an asset or paid to transfer a liability (exit price) in an orderly transaction between market participants at the measurement date under current market conditions. The actual realized gains or losses will depend on, among other factors, future operating results, the value of the assets and market
157
conditions at the time of disposition, any related transaction costs and the timing and manner of sale, all of which may ultimately differ significantly from the assumptions on which the valuations were based.
Fair Value Option
Fair Value Hierarchy
U.S. GAAP establishes a hierarchical disclosure framework which prioritizes and ranks the level of market price observability used in measuring financial instruments at fair value. Market price observability is affected by a number of factors, including the type of financial instrument, the characteristics specific to the financial instrument and the state of the marketplace, including the existence and transparency of transactions between market participants. Financial instruments with readily available quoted prices in active markets generally will have a higher degree of market price observability and a lesser degree of judgment used in measuring fair value.
Financial instruments measured and reported at fair value are classified and disclosed based on the observability of inputs used in the determination of fair values, as follows:
Level 1 – Quoted prices are available in active markets for identical financial instruments as of the reporting date. The Company does not adjust the quoted price for these financial instruments, even in situations where the Company holds a large position and the sale of such position would likely deviate from the quoted price.
Level 2 – Pricing inputs are other than quoted prices in active markets, which are either directly or indirectly observable as of the reporting date, and fair value is determined through the use of models or other valuation methodologies. These financial instruments exhibit higher levels of liquid market observability as compared to Level 3 financial instruments.
Level 3 – Pricing inputs are unobservable for the financial instrument and includes situations where there is little observable market activity for the financial instrument. The inputs into the determination of fair value may require significant management judgment or estimation. Financial instruments that are included in this category generally include investments where the fair value is based on observable inputs as well as unobservable inputs.
When a security is valued based on broker quotes, the Company subjects those quotes to various criteria in making the determination as to whether a particular financial instrument would qualify for classification as Level 2 or Level 3. These criteria include, but are not limited to, the number and quality of the broker quotes, the standard deviations of the observed broker quotes, and the percentage deviation from external pricing services.
Investments in securities that are traded on a securities exchange or comparable over-the-counter quotation systems are valued based on Apollo’s pricing procedures, which utilize third party pricing vendors, broker dealers and closing prices from exchanges. If no sales of such investments are reported on such date, and in the case of over-the-counter securities or other investments for which the last sale date is not available, valuations are based on independent market quotations obtained from market participants, recognized pricing services or other sources deemed relevant, and the prices are based on the average of the “bid” and “ask” prices, or at ascertainable prices at the close of business on such day. Market quotations are generally based on valuation pricing models or market transactions of similar securities adjusted for security-specific factors such as relative capital structure priority and interest and yield risks, among other factors. When market quotations are not available, a model-based approach is used to determine fair value.
In certain cases, the inputs used to measure fair value may fall into different levels of the fair value hierarchy. In such cases, a financial instrument’s level within the fair value hierarchy is based on the lowest level of input that is significant to the fair value measurement. The Company’s assessment of the significance of a particular input to the fair value measurement in its entirety requires judgment and considers factors specific to the financial instrument when the fair value is based on unobservable inputs.
158
Business Combinations
The Company accounts for business combinations using the acquisition method of accounting where the consideration transferred for the acquisition is allocated to the assets acquired and liabilities assumed using the fair values determined by management as of the acquisition date. Contingent consideration obligations that are elements of the consideration transferred are recognized as of the acquisition date as part of the fair value transferred in exchange for the acquired business. Acquisition-related costs incurred in connection with a business combination are expensed as incurred.
Goodwill
Goodwill represents the excess of cost over the fair value of identifiable net assets of an acquired business. Goodwill is recorded in separate line items for both the Asset Management and Retirement Services segments. See note 3 for disclosure regarding the goodwill recorded related to the Bridge acquisition.
Other Assets
Other assets are primarily comprised of deferred tax assets, leases and fixed assets.
Fixed assets consist primarily of leasehold improvements, furniture, fixtures, equipment, and computer hardware and are recorded at cost, net of accumulated depreciation and amortization. Depreciation and amortization is calculated using the straight-line method over the assets’ estimated useful lives and in the case of leasehold improvements the lesser of the useful life or the term of the lease. Expenditures for repairs and maintenance are charged to expense when incurred. The Company evaluates long-lived assets for impairment periodically and whenever events or changes in circumstances indicate the carrying amounts of the assets may be impaired.
Compensation and Benefits
Compensation consists of (i) salary, bonus, and benefits, which includes base salaries, discretionary and non-discretionary bonuses, severance and employee benefits, (ii) equity-based awards granted to employees and non-employees that are measured based on the grant date fair value of the award and (iii) profit sharing expense, which primarily consists of a portion of performance revenues earned from certain funds that are allocated to employees and former employees. Compensation costs are recorded in compensation and benefits for asset management and policy and other operating expense for retirement services in the consolidated statements of operations.
Employees and non-employees who provide services to the Company are granted equity-based awards as compensation that are measured based on the grant date fair value of the award. Equity-based awards that do not require future service (i.e., vested awards) are expensed immediately. Equity-based employee awards that require future service are expensed over the relevant period of service. Equity-based awards that require performance metrics to be met are expensed only when the performance metric is met or deemed probable. Profit sharing amounts are recognized as the related performance revenues are earned. Accordingly, profit sharing amounts can be reversed during periods when there is a decline in performance revenues that were previously recognized. Profit sharing amounts are generally not paid until the related performance revenue is distributed to the general partner upon realization of the fund’s investments (which may be distributed in cash or in-kind).
Earnings Per Share
As the Company has issued participating securities, the two-class method of computing earnings per share is used for all periods presented for common stock and participating securities as if all earnings for the period had been distributed. Under the two-class method, during periods of net income, the net income is first reduced for distributions declared on all classes of securities to arrive at undistributed earnings. During periods of net losses, the net loss is reduced for distributions declared on participating securities only if the security has the right to participate in the earnings of the entity and an objectively determinable contractual obligation to share in net losses of the entity. Participating securities include vested and unvested RSUs that participate in distributions, as well as unvested restricted shares.
159
Whether during a period of net income or net loss, under the two-class method the remaining earnings are allocated to common stock and participating securities to the extent that each security shares in earnings as if all of the earnings for the period had been distributed. Earnings or losses allocated to each class of security are then divided by the applicable weighted average outstanding shares to arrive at basic earnings per share. For the diluted earnings, the denominator includes all outstanding shares of common stock and includes the number of additional shares of common stock that would have been outstanding if the dilutive potential shares of common stock had been issued. The numerator is adjusted for any changes in income or loss that would result from the issuance of these potential shares of common stock.
Share Repurchase
When shares are repurchased, the Company can choose to record treasury shares or account for the repurchase as a constructive retirement. The Company accounted for share repurchases as constructive retirement, whereby it reduced common stock and additional paid-in capital by the amount of the original issuance, with any excess purchase price recorded as a reduction to retained earnings. Under this method, issued and outstanding shares are reduced by the shares repurchased, and no treasury stock is recognized on the consolidated statements of financial condition.
Income Taxes
AGM is a Delaware corporation and generally all of its income is subject to U.S. corporate income taxes. Certain subsidiaries of the Company operate as partnerships for U.S. income tax purposes and are subject to NYC UBT. Certain non-U.S. entities are also subject to non-U.S. corporate income taxes. In conjunction with the Mergers, Apollo underwent a reorganization from an Up-C structure to a C-corporation with a single class of common stock. Prior to the Mergers, Athene, and certain of its non-U.S. subsidiaries were not subject to U.S. corporate income taxes on their earnings. Due to the Mergers, Athene’s non-U.S. earnings will generally be subject to U.S. corporate income taxes.
Significant judgment is required in determining tax expense and in evaluating certain and uncertain tax positions. The Company recognizes the tax benefit of uncertain tax positions only where the position is “more likely than not” to be sustained upon examination, including resolution of any related appeals or litigation processes, based on the technical merits of the position. The tax benefit is measured as the largest amount of benefit that has a greater than 50% likelihood of being realized upon ultimate settlement. If a tax position is not considered more likely than not to be sustained, then no benefits of the position are recognized. The Company’s tax positions are reviewed and evaluated quarterly to determine whether the Company has uncertain tax positions that require financial statement recognition.
Deferred tax assets and liabilities are recognized for the expected future tax consequences of differences between the carrying amount of assets and liabilities and their respective tax bases using currently enacted tax rates. The effect on deferred tax assets and liabilities of a change in tax rates is recognized in income in the period during which the change is enacted. Deferred tax assets are reduced by a valuation allowance when it is more likely than not that all or a portion of the deferred tax assets will not be realized.
Significant judgment and estimates are required in determining whether valuation allowances should be established as well as the amount of such allowances. When making such determination, consideration is given to, among other things, the following:
•whether sufficient taxable income exists within the allowed carryback or carryforward periods;
•whether future reversals of existing taxable temporary differences will occur, including any tax planning strategies that could be used;
•the nature or character (e.g., ordinary vs. capital) of the deferred tax assets and liabilities; and
•whether future taxable income exclusive of reversing temporary differences and carryforwards exists.
Debt Issuance Costs
Debt issuance costs consist of costs incurred in obtaining financing and are amortized over the term of the financing using the effective interest method. These costs are generally recorded as a direct deduction from the carrying amount of the related debt liability on the consolidated statements of financial condition.
160
Recently Issued Accounting Pronouncements
Income Statement – Reporting Comprehensive Income - Expense Disaggregation Disclosures (ASU 2024-03)
In November 2024, the FASB issued guidance that requires disaggregation of certain expense captions into specified categories in disclosures within the notes to the financial statements. The ASU requires tabular presentation of each relevant expense caption on the face of the income statement including employee compensation, depreciation, intangible asset amortization, and certain other expenses, when applicable.
The guidance is mandatorily effective for the Company for fiscal years beginning after December 15, 2026, including interim periods therein; early adoption is permitted. The Company is currently evaluating the impact of the new pronouncement on its consolidated financial statements.
Business Combinations and Consolidation (ASU 2025-03)
In May 2025, the FASB issued guidance clarifying how to identify the accounting acquirer in business combinations involving variable interest entities. The ASU requires an assessment of control and economic interests to determine the acquirer for consolidation purposes.
The guidance is mandatorily effective for the Company for fiscal years beginning after December 15, 2026, including interim periods therein; early adoption is permitted. The Company is currently evaluating the impact of the new pronouncement on its consolidated financial statements.
Compensation – Stock Compensation and Revenue from Contracts with Customers (ASU 2025-04)
In June 2025, the FASB issued guidance clarifying the accounting for share-based consideration payable to customers, specifically addressing when such payments should be classified as stock compensation expense versus a reduction of revenue.
The guidance is mandatorily effective for the Company for fiscal years beginning after December 15, 2026, including interim periods therein; early adoption is permitted. The Company is currently evaluating the impact of the new pronouncement on its consolidated financial statements.
Intangibles – Goodwill and Other – Internal-Use Software (ASU 2025-06)
In September 2025, the FASB issued guidance providing targeted improvements to the accounting for internal-use software. The ASU simplifies accounting for internal-use software by eliminating references to specific development project stages and clarifies the threshold entities should apply to begin capitalizing costs.
The guidance is mandatorily effective for the Company for fiscal years beginning after December 15, 2027, including interim periods therein; early adoption is permitted. The Company is currently evaluating the impact of the new pronouncement on its consolidated financial statements.
Derivatives and Hedging and Revenue from Contracts with Customers (ASU 2025-07)
In September 2025, the FASB issued amendments to refine the scope of derivatives in Topic 815 by excluding certain non-exchange-traded contracts for which settlement is based on operations or activities specific to a party, unless settlement involves a market-based variable or a financial instrument. The updates also clarify that share-based non-cash consideration from a customer in a revenue contract should be accounted for under Topic 606 until the entity’s right to receive or retain the consideration becomes unconditional.
The guidance is mandatorily effective for the Company for fiscal years beginning after December 15, 2026, including interim periods therein; early adoption is permitted. The Company is currently evaluating the impact of the new pronouncement on its consolidated financial statements.
161
Derivatives and Hedging – Hedge Accounting Improvements (ASU 2025-09)
In November 2025, the FASB issued guidance amending certain aspects of the hedge accounting guidance in ASC 815 and to address several incremental hedge accounting issues arising from the global reference rate reform initiative. The objective of this ASU is to more closely align hedge accounting with the economics of an entity’s risk management activities.
The guidance is mandatorily effective for the Company for fiscal years beginning after December 15, 2026, including interim periods therein; early adoption is permitted. The Company is currently evaluating the impact of the new pronouncement on its consolidated financial statements.
Interim Reporting (ASU 2025-11)
In December 2025, the FASB issued amendments to improve the guidance in Topic 270 by improving the navigability of the required interim disclosures and clarifying when that guidance is applicable. The amendments also provide additional guidance on what disclosures should be provided in interim reporting periods. The amendments are not intended to change the fundamental nature of interim reporting or expand or reduce current interim disclosure requirements.
The guidance is mandatorily effective for the Company for interim reporting periods within annual reporting periods beginning after December 15, 2027; early adoption is permitted. The Company is currently evaluating the impact of the new pronouncement on its consolidated financial statements.
Recently Adopted Accounting Pronouncements
Income Taxes—Improvements to Income Tax Disclosures (ASU 2023-09)
In December 2023, the FASB made amendments to update disclosures on income taxes including rate reconciliation, income taxes paid, and certain amendments on disaggregation by federal, state, and foreign taxes, as relevant.
The Company adopted the guidance prospectively for the annual reporting period ended December 31, 2025. Refer to note 13, Income Taxes, for the expanded disclosures.
Business Combinations – Joint Venture Formations (ASU 2023-05)
In August 2023, the FASB issued amendments to address how a joint venture initially recognizes and measures contributions received at its formation date. The amendments require a joint venture to apply a new basis of accounting upon formation and to initially recognize its assets and liabilities at fair value.
The Company adopted the guidance on January 1, 2025, and there was no impact on the consolidated financial statements upon adoption.
Intangibles – Goodwill and Other – Crypto Assets: Accounting for and Disclosure of Crypto Assets (ASU 2023-08)
In December 2023, the FASB issued amendments on the accounting for and disclosure of crypto assets. The guidance requires assets that meet certain conditions be accounted for at fair value with changes in fair value recognized in net income. The ASU also requires disclosures about significant holdings, contractual sale restrictions, and changes during the reporting period.
The Company adopted the guidance on January 1, 2025, and there was no impact on the consolidated financial statements upon adoption.
Compensation – Stock Compensation (ASU 2024-01)
In March 2024, the FASB issued guidance in ASU 2024-01 that clarifies how an entity determines whether it is required to account for profits interest awards (and similar awards) in accordance with Accounting Standards Codification (ASC) 718 or other guidance. The ASU provides specific examples on when a profits interest award should be accounted for as a share-based payment arrangement under ASC 718 or in a manner similar to a cash bonus or profit-sharing arrangement under ASC 710 or other ASC topics.
162
The Company adopted the guidance on January 1, 2025, and there was no impact on the consolidated financial statements upon adoption.
Significant Accounting Policies – Asset Management
U.S. Treasury Securities, at fair value
Other Investments
Apollo elected to account for certain equity securities without readily determinable fair values that did not qualify for the practical expedient to estimate fair values based on NAV per share (or its equivalent) at cost less impairment, subject to adjustments based on observable price changes in orderly transactions for identical or similar investments of the same issuer.
Due from/to Related Parties
Due from/to related parties includes amounts due from and due to existing employees, certain former employees, TRA holders, portfolio companies of the funds and non-consolidated funds.
Deferred Revenue
Apollo records deferred revenue, which is a type of contract liability, when consideration is received in advance of management services provided. Deferred revenue is reversed and recognized as revenue over the period that the agreed upon services are performed. It is included in accounts payable, accrued expenses, and other liabilities in the consolidated statements of financial condition.
Apollo also earns management fees which are subject to an offset. When Apollo receives cash for advisory and transaction fees, a certain percentage of such advisory and/or transaction fees, as applicable, is allocated as a credit to reduce future management fees, otherwise payable by the relevant fund. Such credit is recorded as deferred revenue in the consolidated statements of financial condition within the accounts payable, accrued expenses and other liabilities line item. A portion of any excess advisory and transaction fees may be required to be returned to the limited partners of certain funds upon such fund’s liquidation. As the management fees earned by Apollo are presented on a gross basis, any management fee offsets calculated are presented as a reduction to advisory and transaction fees in the consolidated statements of operations.
Additionally, Apollo earns advisory fees pursuant to the terms of the advisory agreements with certain of the portfolio companies that are owned by the funds Apollo manages. When Apollo receives a payment from a portfolio company that exceeds the advisory fees earned at that point in time, the excess payment is recorded as deferred revenue in the consolidated statements of financial condition. The advisory agreements with the portfolio companies vary in duration and the associated fees are received monthly, quarterly, or annually.
Deferred revenue is reversed and recognized as revenue over the period that the agreed upon services are performed. There was $99 million of revenue recognized during the year ended December 31, 2025 that was previously deferred as of January 1, 2025.
Under the terms of the funds’ partnership agreements, Apollo is normally required to bear organizational expenses over a set dollar amount and placement fees or costs in connection with the offering and sale of interests in the funds it manages to investors. In cases where the limited partners of the funds are determined to be the customer in an arrangement, placement fees may be capitalized as a cost to acquire a customer contract and amortized over the life of the customer contract. Capitalized placement fees are recorded within other assets in the consolidated statements of financial condition, while amortization is recorded within general, administrative and other in the consolidated statements of operations. In certain instances, the placement fees are paid over a period of time. Based on the management agreements with the funds, Apollo considers
163
placement fees and organizational costs paid in determining if cash has been received in excess of the management fees earned. Placement fees and organizational costs are normally the obligation of Apollo but can be paid for by the funds. When these costs are paid by the fund, the resulting obligations are included within deferred revenue. The deferred revenue balance will also be reduced during future periods when management fees are earned but not paid.
Redeemable non-controlling interests
Redeemable non-controlling interests are attributable to VIEs and, for periods prior to December 31, 2023, primarily represented the shares issued by the Company’s previously consolidated SPACs. The redeemable non-controlling interests are initially recorded at their original issue price, net of issuance costs and the initial fair value of separately traded warrants. The carrying amount is accreted to its redemption value over the period from the date of issuance to the earliest redemption date of the instrument. The accretion to redemption value is generally recorded against additional paid-in capital.
Revenues
The revenues of the asset management business include (i) management fees; (ii) advisory and transaction fees, net; (iii) investment income, which is comprised of performance allocations and principal investment income; (iv) incentive fees; and (v) property management, development and other fees.
The revenue guidance requires that an entity should recognize revenue to depict the transfer of promised goods or services to customers in an amount that reflects the consideration to which the entity expects to be entitled in exchange for those goods or services (i.e., the transaction price). When determining the transaction price under the revenue guidance, an entity may recognize variable consideration only to the extent that it is probable to not be significantly reversed. The revenue guidance also requires disclosures to help users of financial statements better understand the nature, amount, timing, and uncertainty of revenue that is recognized.
Performance allocations are accounted for under guidance applicable to equity method investments, and therefore not within the scope of the revenue guidance. Apollo recognizes performance allocations within investment income along with the related principal investment income (as further described below) in the consolidated statements of operations and within the investments line in the consolidated statements of financial condition.
Refer to disclosures below for additional information on each of the revenue streams of the asset management business.
Management Fees
Management fees are recognized over time during the periods in which the related services are performed in accordance with the contractual terms of the related agreement. Management fees are generally based on (1) a percentage of the capital committed during the commitment period, and thereafter based on the remaining invested capital of unrealized investments, or (2) net asset value, gross assets or as otherwise provided in the respective agreements. Included in management fees are certain expense reimbursements where Apollo is considered the principal under the agreements and is required to record the expense and related reimbursement revenue on a gross basis.
Advisory and Transaction Fees, Net
Advisory and transaction fees generally include arranging fees and structuring fees related to Apollo’s funds, portfolio companies of Apollo funds and third parties, including management consulting fees and directors’ fees. The Company evaluates its contractual obligations in accordance with the terms of the related legal agreements when determining whether there is an identifiably distinct performance obligation. Depending on the identifiably distinct service, advisory and transaction fees may be recognized at a point in time or over time. Advisory and transaction fees associated with deal completion are generally recognized at the point in time of completion. Certain other advisory fees that are associated with an identifiably distinct structuring service are recognized over time as the underlying structuring services are provided.
The amounts due from fund portfolio companies are recorded in due from related parties on the consolidated statements of financial condition. Under the terms of the limited partnership agreements for certain funds, the management fee payable by the funds may be subject to a reduction based on a certain percentage of such advisory and transaction fees, net of applicable broken deal costs. Advisory and transaction fees are reduced by these management fee offsets in the consolidated statements of operations.
164
Underwriting fees, which are also included within advisory and transaction fees, net, include gains, losses and fees, arising from securities offerings in which one of the Company’s subsidiaries participates in the underwriter syndicate. Underwriting fees are recognized at a point in time when the underwriting is completed. Underwriting fees recognized but not received are recorded in other assets on the consolidated statements of financial condition.
During the normal course of business, Apollo incurs certain costs related to certain transactions that are not consummated, or “broken deal costs”. These costs (e.g., research costs, due diligence costs, professional fees, legal fees and other related items) are determined to be broken deal costs upon management’s decision to no longer pursue the transaction. In accordance with the related fund agreement, in the event the deal is deemed broken, all of the costs are reimbursed by the funds and then included as a component of the calculation of the management fee offset. If a deal is successfully completed, Apollo is reimbursed by the fund or fund’s portfolio company for all costs incurred and no offset is generated. As Apollo acts as an agent for the funds it manages, any transaction costs incurred and paid by Apollo on behalf of the respective funds relating to successful or broken deals are recorded net on the Company’s consolidated statements of operations, and any receivable from the respective funds is recorded in due from related parties on the consolidated statements of financial condition.
Investment Income
Investment income is comprised of performance allocations and principal investment income.
Performance Allocations. Performance allocations are a type of performance revenue (i.e., income earned based on the extent to which an entity’s performance exceeds predetermined thresholds). Performance allocations are generally structured from a legal standpoint as an allocation of capital in which Apollo’s capital account receives allocations of the returns of an entity when those returns exceed predetermined thresholds. The determination of which performance revenues are considered performance allocations is primarily based on the terms of an agreement with the entity.
Apollo recognizes performance allocations within investment income along with the related principal investment income (as described further below) in the consolidated statements of operations and within the investments line in the consolidated statements of financial condition.
When applicable, Apollo may record a general partner obligation to return previously distributed performance allocations. The general partner obligation is based upon an assumed liquidation of a fund’s net assets as of the reporting date and is reported within due to related parties on the consolidated statements of financial condition. The actual determination and any required payment of any such general partner obligation would not take place until the final disposition of a fund’s investments based on the contractual termination of the fund or as otherwise set forth in the respective governing document of the fund.
Principal Investment Income. Principal investment income includes Apollo’s income or loss from equity method investments and certain other investments in entities in which Apollo is generally eligible to receive performance allocations. Income from equity method investments includes Apollo’s share of net income or loss generated from its investments, which are not consolidated, but in which it exerts significant influence.
Incentive Fees
Property Management, Development and Other Fees
Apollo provides property management services through Bridge. Apollo earns property management fees over time as the related services are provided under the terms of the respective property management agreements. Apollo also earns leasing commission revenue associated with the leasing of commercial assets, which is recognized upon the execution of the applicable lease agreements, and records development fees as the services are provided under the terms of the applicable development
165
Profit Sharing
Profit sharing expense and profit sharing payable primarily consist of a portion of performance revenues earned from certain funds that are allocated to employees and former employees. Profit sharing amounts are recognized as the related performance revenues are earned. Accordingly, profit sharing amounts can be reversed during periods when there is a decline in performance revenues that were previously recognized. Profit sharing expense is recorded in compensation and benefits for asset management in the consolidated statements of operations. Profit sharing payable is recorded in accounts payable, accrued expenses and other liabilities for Asset Management in the consolidated statements of financial condition.
Profit sharing amounts are generally not paid until the related performance revenue is distributed to the general partner upon realization of the fund’s investments. Under certain profit-sharing arrangements, Apollo requires that a portion of certain of the performance revenues distributed to its employees be used to purchase restricted common stock issued under the Equity Plan. Prior to distribution of the performance revenue, the Company records the value of the equity-based awards expected to be granted in other assets and other liabilities within the consolidated statements of financial condition. Such equity-based awards are recorded as equity-based compensation expense over the relevant service period once granted.
Additionally, profit sharing amounts previously distributed may be subject to clawback from employees and former employees. When applicable, the accrual for potential clawback of previously distributed profit sharing amounts, which is a component of due from related parties on the consolidated statements of financial condition, represents all amounts previously distributed to employees and former employees that would need to be returned to the general partner if the funds were to be liquidated based on the fair value of the underlying fund’s investments as of the reporting date. The actual general partner receivable, however, would not become realized until the final disposition of a fund’s investments based on the contractual termination of the fund or as otherwise set forth in the respective governing document of the fund.
Profit sharing payable also includes contingent consideration obligations that were recognized in connection with certain acquisitions. Changes in the fair value of the contingent consideration obligations are reflected in the consolidated statements of operations as compensation and benefits for asset management.
Apollo has performance-based incentive arrangements for certain employees designed to more closely align compensation on an annual basis with the overall realized performance of the Company’s asset management business. These arrangements enable certain employees to earn discretionary compensation based on performance revenue earned by Apollo’s asset management business in a given year, which amounts are reflected in compensation and benefits in the accompanying consolidated financial statements for asset management. Apollo may also use dividends it receives from investments in certain perpetual capital vehicles to compensate employees. These amounts are recorded as compensation and benefits in the consolidated statements of operations for asset management.
Other Income (Loss)
Net Gains (Losses) from Investment Activities
Net gains (losses) from investment activities include both realized gains and losses and the change in unrealized gains and losses in Apollo’s investments, at fair value between the opening reporting date and the closing reporting date.
Net Gains (Losses) from Investment Activities of Consolidated Variable Interest Entities
Changes in the fair value of the consolidated VIEs’ assets and liabilities and related interest, dividend and other income and expenses are presented within net gains (losses) from investment activities of consolidated variable interest entities and are attributable to non-controlling interests in the consolidated statements of operations.
166
Other Income (Loss), Net
Other income (loss), net includes the recognition of gains (losses) arising from the remeasurement of foreign currency denominated assets and liabilities, gains arising from the remeasurement of the tax receivable agreement liability (see note 18), and other miscellaneous non-operating income and expenses.
Significant Accounting Policies – Retirement Services
Investments
Fixed Maturity Securities
Fixed maturity securities include bonds, CLOs, ABS, RMBS, CMBS and redeemable preferred stock. Athene classifies fixed maturity securities as AFS or trading at the time of purchase and subsequently carries them at fair value. Classification is dependent on a variety of factors, including expected holding period, election of the fair value option and asset and liability matching.
AFS Securities
AFS securities are held at fair value on the consolidated statements of financial condition, with unrealized gains and losses, exclusive of allowances for expected credit losses, generally reflected in AOCI on the consolidated statements of financial condition. Unrealized gains or losses relating to identified risks within AFS securities in fair value hedging relationships are reflected in investment related gains (losses) on the consolidated statements of operations.
Trading Securities
The fair value option is elected for certain fixed maturity securities. These fixed maturity securities are classified as trading, with changes to fair value included in investment related gains (losses) on the consolidated statements of operations. Although the securities are classified as trading, the trading activity related to these investments is primarily focused on asset and liability matching activities and is not intended to be an income strategy based on active trading. As such, the activity related to these investments on the consolidated statements of cash flows is classified as investing activities.
Transactions in securities are generally recorded on a trade date basis, with any unsettled trades recorded in other assets or other liabilities on the consolidated statements of financial condition. Bank loans, private placements and investment funds are recorded on a settlement date basis.
Equity Securities
Equity securities include common stock, mutual funds and non-redeemable preferred stock. Equity securities are carried at fair value with subsequent changes in fair value recognized in net income.
Purchased Credit Deteriorated Investments
Athene purchases certain structured securities, primarily RMBS, which upon assessment have been determined to meet the definition of PCD investments. Additionally, structured securities classified as beneficial interests follow the initial measurement guidance for PCD investments if there is a significant difference between contractual cash flows adjusted for expected prepayments and expected cash flows at the date of recognition. The initial allowance for credit losses for PCD investments is recorded through a gross-up adjustment to the initial amortized cost. For structured securities classified as beneficial interests, the initial allowance is calculated as the present value of the difference between contractual cash flows adjusted for expected prepayments and expected cash flows at the date of recognition. The non-credit purchase discount or premium is amortized into investment income using the effective interest method. The credit discount, represented by the allowance for expected credit losses, is remeasured each period following the policies for measuring credit losses described in the “Credit Losses – Available-for-Sale Securities” section below.
167
Mortgage Loans
Athene elected the fair value option on its mortgage loan portfolio. Interest income is accrued on the principal amount of the loan based on its contractual interest rate. Interest is accrued on loans until it is probable it will not be received, or the loan is 90 days past due, unless guaranteed by U.S. government-sponsored agencies. Interest income and prepayment fees are reported in net investment income on the consolidated statements of operations. Changes in the fair value of the mortgage loan portfolio are reported in investment related gains (losses) on the consolidated statements of operations.
Investment Funds
Athene invests in certain non-fixed income, alternative investments in the form of limited partnerships or similar legal structures (investment funds). For investment funds in which it does not hold a controlling financial interest, Athene typically accounts for such investments using the equity method, where the cost is recorded as an investment in the fund, or it has elected the fair value option. Adjustments to the carrying amount reflect pro rata ownership percentage of the operating results as indicated by NAV in the investment fund financial statements, which can be on a lag of up to three months when investee information is not received in a timely manner.
Athene’s proportionate share of investment fund income is recorded within net investment income, or, for consolidated VIEs, revenues of consolidated VIEs, on the consolidated statements of operations. Contributions paid or distributions received by Athene are recorded directly to the investment fund balance as an increase to carrying value or as a return of capital, respectively.
Policy Loans
Policy loans are funds provided to policyholders in return for a claim on the policyholder’s account balance. The funds provided are limited to a specified percentage of the account balance. The majority of policy loans do not have a stated maturity and the balances and accrued interest are repaid with proceeds from the policyholder’s account balance. Policy loans are reported at the unpaid principal balance. Interest income is recorded as earned using the contract interest rate and is reported in net investment income on the consolidated statements of operations.
Funds Withheld at Interest
Funds withheld at interest represents a receivable for amounts contractually withheld by ceding companies in accordance with funds withheld coinsurance (“funds withheld”) and modified coinsurance (“modco”) reinsurance agreements in which Athene is the reinsurer. Generally, assets equal to statutory reserves are withheld and legally owned by the ceding company, and any excess or shortfall is settled periodically. The underlying agreements contain embedded derivatives as discussed below.
Short-term Investments
Short-term investments consist of financial instruments with maturities of greater than three months but less than twelve months when purchased. Short-term debt securities are accounted for as trading or AFS consistent with the policies for those investments. Short-term loans are carried at amortized cost. Fair values are determined consistently with methodologies described in note 7 for the respective investment type.
Other Investments
Other investments include, but are not limited to, term loans collateralized by mortgages on residential and commercial real estate, other uncollateralized loans, investments in real estate, corporate owned life insurance, and investments in low-income housing and transferable energy tax credit structures. Athene elected the fair value option on the term loans and other uncollateralized loans. Investments in real estate are held at cost less accumulated depreciation and impairments. Corporate owned life insurance is held at cash surrender value. Low-income housing and transferable energy tax credit structures either use the proportional amortization method or we elect the fair value option.
Interest income is accrued on the principal amount of the loan based on its contractual interest rate. Interest on loans is accrued until it is probable it will not be received or the loan is 90 days past due. Changes in the cash surrender value of corporate owned life insurance, interest income, amortization of premiums and discounts, and prepayment and other fees are reported in
168
net investment income on the consolidated statements of operations. Changes in fair value are reported in investment related gains (losses) on the consolidated statements of operations.
Investment Income
Credit Losses – Available-for-Sale Securities and Other
AFS securities with a fair value that has declined below amortized cost are evaluated to determine how the decline in fair value should be recognized. If Athene determines, based on the facts and circumstances related to the specific security, that Athene intends to sell a security or it is more likely than not that Athene would be required to sell a security before the recovery of its amortized cost, any existing allowance for expected credit losses is reversed and the amortized cost of the security is written down to fair value. If neither of these conditions exist, Athene evaluates whether the decline in fair value has resulted from a credit loss or other factors.
For non-structured AFS securities, relevant facts and circumstances are qualitatively considered in evaluating whether a decline below fair value is credit-related. Relevant facts and circumstances include but are not limited to: (1) the extent to which the fair value is less than amortized cost; (2) changes in agency credit ratings, (3) adverse conditions related to the security’s industry or geographical area, (4) failure to make scheduled payments, and (5) other known changes in the financial condition of the issuer or quality of any underlying collateral or credit enhancements. For structured AFS securities meeting the definition of beneficial interests, the qualitative assessment is bypassed, and any securities having experienced a decline in fair value below amortized cost move directly to a quantitative analysis.
If upon completion of this analysis it is determined that a potential credit loss exists, an allowance for expected credit losses is established equal to the amount by which the present value of expected cash flows is less than amortized cost, limited by the amount by which fair value is less than amortized cost. A non-structured security’s cash flow estimates are derived from scenario-based outcomes of expected corporate restructurings or the disposition of assets using security-specific facts and circumstances including timing, security interests and loss severity. A structured security’s cash flow estimates are based on security-specific facts and circumstances that may include collateral characteristics, expectations of delinquency and default rates, loss severity, prepayments and structural support, including subordination and guarantees. The expected cash flows are discounted at the effective interest rate implicit to the security at the date of purchase or the current yield to accrete a structured security. For securities with a contractual interest rate that varies based on changes in an independent factor, such as an index or rate, the effective interest rate is calculated based on the factor as it changes over the life of the security. Inherently under the discounted cash flow model, both the timing and amount of expected cash flows affect the measurement of the allowance for expected credit losses.
The allowance for expected credit losses is remeasured each period for the passage of time, any change in expected cash flows, and changes in the fair value of the security. All impairments, whether intent or requirement to sell or credit-related, and all changes in the allowance for expected credit losses are recorded through the provision for credit losses within investment related gains (losses) on the consolidated statements of operations.
Athene also establishes an allowance for expected credit losses for assets held at amortized cost at the time of purchase, which includes certain other loans and reinsurance assets. The allowance for expected credit losses considers past events, current conditions, and reasonable and supportable forecasts of future economic conditions or macroeconomic forecasts. Athene uses a quantitative probability of default and loss given default methodology to develop the estimate of expected credit loss. The provision for credit losses for reinsurance assets held at amortized cost is recorded through policy and other operating expenses on the consolidated statements of operations.
Athene has elected to present accrued interest receivable separately in other assets on the consolidated statements of financial condition. Athene has also elected the practical expedient to exclude the accrued interest receivable from the amortized cost balance used to calculate the allowance for expected credit losses, as Athene has a policy to write off such balances in a timely
169
manner, when they become 90 days past due. Any write-off of accrued interest is recorded through a reversal of net investment income on the consolidated statements of operations.
Upon determining that all or a portion of the amortized cost of an asset is uncollectible, which is generally when all efforts for collection are exhausted, the amortized cost is written off against the existing allowance. Any write off in excess of the existing allowance is recorded through the provision for credit losses within investment related gains (losses) on the consolidated statements of operations.
Derivative Instruments
Athene invests in derivatives to hedge the risks experienced from ongoing operations, such as equity, interest rate, foreign currency and market volatility, or for other risk management purposes, which primarily involve managing liability risks associated with indexed annuity products and reinsurance agreements. Derivatives are financial instruments with values that are derived from interest rates, foreign exchange rates, financial indices or other combinations of an underlying and notional. Derivative assets and liabilities are carried at fair value on the consolidated statements of financial condition. Athene elects to present any derivatives subject to master netting provisions as a gross asset or liability and gross of collateral. Disclosures regarding balance sheet presentation of derivatives subject to master netting agreements are discussed in note 5. Athene may designate derivatives as cash flow, fair value or net investment hedges.
Hedge Documentation and Hedge Effectiveness
To qualify for hedge accounting, at the inception of the hedging relationship, Athene formally documents its designation of the hedge as a cash flow, fair value or net investment hedge and risk management objective and strategy for undertaking the hedging transaction. This documentation identifies how the hedging instrument is expected to hedge the designated risks related to the hedged item and the method that will be used to retrospectively and prospectively assess the hedge effectiveness and the method which will be used to measure ineffectiveness. A derivative designated as a hedging instrument must be assessed as being highly effective in offsetting the designated risk of the hedged item. Hedge effectiveness is formally assessed at inception and periodically throughout the life of the hedge accounting relationship.
For a cash flow hedge, all changes in the fair value of the hedging derivative are reported within AOCI and the related gains or losses on the derivative are reclassified into the consolidated statements of operations when the cash flows of the hedged item affect earnings.
For a fair value hedge, changes in the fair value of the hedging derivative and changes in the fair value of the hedged item related to the designated risk being hedged are reported on the consolidated statements of operations according to the nature of the risk being hedged. Additionally, changes in the fair value of amounts excluded from the assessment of effectiveness are recorded in AOCI and amortized into income over the life of the hedge accounting relationship.
For a net investment hedge, changes in the fair value of the hedging derivative are reported within AOCI to offset the translation adjustments for subsidiaries with functional currencies other than the U.S. dollar.
Athene discontinues hedge accounting prospectively when: (1) it determines the derivative is no longer highly effective in offsetting changes in the estimated cash flows or fair value of a hedged item; (2) the derivative expires, is sold, terminated, or exercised; or (3) the derivative is de-designated as a hedging instrument. When hedge accounting is discontinued, the derivative continues to be carried on the consolidated statements of financial condition at fair value, with changes in fair value recognized in investment related gains (losses) on the consolidated statements of operations.
Embedded Derivatives
Athene issues and reinsures products, primarily indexed annuity products, or purchases investments that contain embedded derivatives. If it determines the embedded derivative has economic characteristics that are not clearly and closely related to the economic characteristics of the host contract, and a separate instrument with the same terms would qualify as a derivative instrument, the embedded derivative is bifurcated from the host contract and accounted for separately, unless the fair value option is elected on the host contract. Under the fair value option, bifurcation of the embedded derivative is not necessary as the
170
entire contract is carried at fair value with all related gains and losses recognized in investment related gains (losses) on the consolidated statements of operations. Embedded derivatives are carried on the consolidated statements of financial condition at fair value in the same line item as the host contract.
Fixed indexed annuity, index-linked variable annuity and indexed universal life insurance contracts allow the policyholder to elect a fixed interest rate return or an equity market component for which interest credited is based on the performance of certain equity market indices. The equity market option is an embedded derivative. The benefit reserve is equal to the sum of the fair value of the embedded derivative and the host (or guaranteed) component of the contracts. The fair value of the embedded derivatives represents the present value of cash flows attributable to the indexed strategies. The embedded derivative cash flows are based on assumptions for future policy growth, which include assumptions for expected index credits on the next policy anniversary date, future equity option costs, volatility, interest rates and policyholder behavior assumptions, including lapses and the use of benefit riders. The embedded derivative cash flows are discounted using a rate that reflects Athene’s own credit rating. The host contract is established at contract inception as the initial account value less the initial fair value of the embedded derivative and accreted over the policy’s life. Contracts acquired through a business combination which contain an embedded derivative are re-bifurcated as of the acquisition date. Changes in the fair value of embedded derivatives associated with indexed annuities, index-linked variable annuities and indexed universal life insurance contracts are included in interest sensitive contract benefits on the consolidated statements of operations.
Reinsurance
Athene assumes and cedes insurance and investment contracts under coinsurance, funds withheld, modco, and yearly renewable term bases. Reinsurance accounting is applied for transactions that provide indemnification against loss or liability relating to insurance risk (risk transfer). To meet risk transfer requirements, a reinsurance agreement must transfer insurance risk arising from uncertainties about both underwriting and timing risks. Cessions under reinsurance do not discharge obligations as the primary insurer, unless the requirements of assumption reinsurance have been met. Athene generally has the right of offset on reinsurance transactions, but has elected to present reinsurance settlement amounts due to and from Athene on a gross basis.
For assets and liabilities ceded under reinsurance agreements, Athene generally applies the same measurement guidance for Athene’s directly issued or assumed contracts. Ceded amounts are recorded within reinsurance recoverable on the consolidated statements of financial condition. For reinsurance of in-force contracts that pass risk transfer, the issue year used for the purpose of measuring the reinsurance recoverable is dependent on the effective date of the reinsurance agreement, which may differ from the issue year for the direct or assumed contract. The issue year informs the locked-in discount rate used for the purposes of interest accretion. This may result in different discount rates used for the direct or assumed reserves and ceded reserves when reinsuring an in-force block of insurance contracts. For flow reinsurance of insurance contracts that pass risk transfer, the contracts have the same cash flow assumptions as the direct or assumed contracts when the terms are consistent between those respective contracts and the ceded reinsurance agreement. When Athene recognizes an immediate loss due to the present value of future benefits and expenses exceeding the present value of future gross premiums, a gain is recognized on the corresponding reinsurance recoverable to the extent it does not result in gain recognition at treaty inception. Likewise, where the direct or assumed reserve has been floored to zero, the corresponding reinsurance recoverable will be consistently set to zero. See “Future Policy Benefits” below for further information.
Accounting for reinsurance requires the use of assumptions, particularly related to the future performance of the underlying business and the potential impact of counterparty credit risks. Athene attempts to minimize its counterparty credit risk through the structuring of the terms of its reinsurance agreements, including the use of trusts, and monitors credit ratings of counterparties for signs of declining credit quality. When a ceding company does not report information on a timely basis, Athene records accruals based on the best available information at the time, which includes the reinsurance agreement terms
171
and historical experience. Athene periodically compares actual and anticipated experience to the assumptions used to establish reinsurance assets and liabilities. See note 8 for more information.
Assets and liabilities assumed or ceded under coinsurance, funds withheld, modco, or yearly renewable term are presented gross on the consolidated statements of financial condition. For investment contracts, the change in the direct or assumed and ceded reserves are presented net in interest sensitive contract benefits on the consolidated statements of operations. For insurance contracts, the change in the direct or assumed and ceded reserves and benefits are presented net in future policy and other policy benefits on the consolidated statements of operations, except any changes related to the discount rate are presented net in OCI on the consolidated statements of comprehensive income (loss). For market risk benefits, the change in the direct or assumed and ceded reserves are presented net in market risk benefits remeasurement (gains) losses on the consolidated statements of operations, except for changes related to instrument-specific credit risk on direct and assumed contracts which are presented net in OCI on the consolidated statements of comprehensive income (loss).
For the reinsurance of existing in-force blocks that transfer significant insurance risk, the difference between the assets received or paid and the liabilities assumed or ceded represents the net cost of reinsurance at the inception of the reinsurance agreement. The net cost of reinsurance is amortized on a basis consistent with the methodologies and assumptions used to amortize DAC and deferred sales inducements (“DSI”), or on a consistent basis with deferred profit liability dependent upon the nature of the underlying contract.
Deferred Acquisition Costs, Deferred Sales Inducements and Value of Business Acquired
Deferred Acquisition Costs and Deferred Sales Inducements
Costs related directly to the successful acquisition of new, or the renewal of existing, insurance or investment contracts are deferred. These costs consist of commissions and policy issuance costs, as well as sales inducements credited to policyholder account balances, and are included in deferred acquisition costs, deferred sales inducements and value of business acquired on the consolidated statements of financial condition. These costs are not capitalized until they are incurred.
Deferred costs related to universal life-type policies and investment contracts with significant revenue streams from sources other than investment of the policyholder funds are grouped into cohorts based on issue year and contract type and amortized on a constant level basis over the expected term of the related contracts. The cohorts and assumptions used for the amortization of deferred costs are consistent with those used in estimating the related liabilities for these contracts. The constant level basis generally is the initial premium or deposit and is projected based on assumptions related to policyholder behavior, including lapses and mortality, over the expected term of the contracts. Each reporting period, Athene replaces expected experience with actual experience to determine the related amortization expense. Changes to projected experience are recognized in amortization expense prospectively over the remaining contract term. Amortization of DAC and DSI is included in amortization of deferred acquisition costs, deferred sales inducements and value of business acquired on the consolidated statements of operations.
Deferred costs related to investment contracts without significant revenue streams from sources other than investment of the policyholder funds are amortized using the effective interest method. The effective interest method amortizes the deferred costs by discounting the future liability cash flows at a break-even rate. The break-even rate is solved for such that the present value of future liability cash flows is equal to the net liability at the inception of the contract. The deferred costs represent the difference between the net and gross liability and the change relates to amortization for the period.
Value of Business Acquired
Athene establishes VOBA for blocks of insurance contracts acquired through the acquisition of insurance entities. It records the fair value of the liabilities assumed in two components: reserves and VOBA. Reserves are established using Athene’s best estimate assumptions as of the business combination date. VOBA is the difference between the fair value of the liabilities and the reserves. VOBA can be either positive or negative and is amortized in relation to respective policyholder liabilities. Significant assumptions that impact VOBA amortization are consistent with those that impact the measurement of policyholder liabilities. Athene performs periodic tests to determine if positive VOBA remains recoverable. If Athene determines that positive VOBA is not recoverable, Athene records a cumulative charge to the current period. Any negative VOBA is recorded to the same financial statement line on the consolidated statements of financial condition as the associated reserves. Positive VOBA is recorded in deferred acquisition costs, deferred sales inducements and value of business acquired on the consolidated statements of financial condition. See note 9 for further information.
172
Interest Sensitive Contract Liabilities
Interest sensitive contract liabilities are typically associated with universal life-type policies and investment contracts. Universal life-type policies and investment contracts include traditional deferred annuities; indexed annuities consisting of fixed indexed, index-linked variable annuities in the accumulation phase, and assumed indexed universal life without significant mortality risk; funding agreements; immediate annuities without significant mortality risk (which include pension group annuities and structured settlements without life contingencies); universal life insurance; and other investment contracts inclusive of guaranteed investment contracts and assumed endowments without significant mortality risk. Athene carries liabilities for traditional deferred annuities, indexed annuities and universal life insurance at the account balances without reduction for potential surrender or withdrawal charges, except for a block of universal life business ceded to Global Atlantic Financial Group Limited (together with its subsidiaries, “Global Atlantic”), which it carries at fair value. Liabilities for immediate annuities without significant mortality risk (which include pension group annuities and structured settlements without life contingencies), funding agreements, assumed endowments without significant mortality risk and guaranteed investment contracts are calculated as the present value of future liability cash flows and policy maintenance expenses, if any, discounted at contractual interest rates. Certain of Athene’s universal life-type policies and investment contracts are offered with additional contract features that meet the definition of a market risk benefit. See “Market Risk Benefits” below for further information.
Unearned revenue liabilities are established when amounts are assessed against the policyholder for services to be provided in future periods. These balances are amortized consistent with the methodologies and assumptions used to amortize DAC and DSI.
Future Policy Benefits
Athene issues or reinsures contracts classified as long-duration, which include term and whole life, accident and health, disability, and deferred and immediate annuities with life contingencies (which include pension group annuities and structured settlements with life contingencies). Liabilities for nonparticipating long-duration contracts are established as the estimated present value of benefits we expect to pay to or on behalf of the policyholder and related expenses less the present value of the net premiums to be collected, referred to as the net premium ratio. The contracts are grouped into cohorts based on issue year and contract type, with an exception for pension group annuities, which are generally assessed at the group annuity contract level. Contracts with different issuance years are not combined. Contracts acquired in a business combination are grouped into a single cohort by contract type, except for pension group annuities, which follow the group annuity contract level.
Liabilities for nonparticipating long-duration contracts are established using accepted actuarial valuation methods which require the use of assumptions related to discount rate, expenses, longevity, mortality, morbidity, persistency and other policyholder behavior. Athene bases certain key assumptions, such as longevity, mortality and morbidity, on industry standard data adjusted to align with actual company experience, if needed. Athene has elected to use expense assumptions that are locked in at issuance for each cohort. All other cash flow assumptions are established at contract issuance and reviewed annually or more frequently if actual experience suggests a revision is necessary. The effects of changes in cash flow assumptions impacting the net premium ratio are recorded as remeasurement changes in the period in which they are made. As cash flow assumptions are reviewed at least annually, there is no provision for adverse deviation included within the liability.
Actual experience is recognized in the period in which the experience arises. Actual experience is then incorporated into the net premium ratio for all products and cohorts on a quarterly basis. When the net premium ratio is revised, whether to incorporate actual experience each reporting period or for the review of cash flow assumptions, the liability is recalculated as of the beginning of the period, discounted at the original contract issuance discount rate, and compared with the carrying amount of the liability as of the same date to determine the current period change. The current period change in the liability is recognized as remeasurement gain or loss.
To the extent the present value of future benefits and expenses exceeds the present value of gross premiums, Athene will cap the net premium ratio at one hundred percent by increasing the corresponding liability and recognizing an immediate loss through the consolidated statements of operations. The liability is never recorded at an amount less than zero for the cohort.
173
The liability for nonparticipating long-duration contracts is discounted using an upper-medium grade fixed income instrument yield aligned to the characteristics of the liability, including the duration and currency of the underlying cash flows. In determining reference portfolio of instruments, Athene has used a single A equivalent level rate and maximized the use of observable data to the extent possible for the duration of its liabilities. The discount rate is required to be updated at the end of each reporting period for the remeasurement of the liability but is locked-in for each cohort for the purpose of interest accretion expense.
Changes in the value of the liability for nonparticipating long-duration contracts due to changes in the discount rate are recognized as a component of OCI on the consolidated statements of comprehensive income (loss). Changes in the liability for remeasurement gains or losses and all other changes in the liability are recorded in future policy and other policy benefits on the consolidated statements of operations.
Future policy benefits include liabilities for no-lapse guarantees on universal life insurance and fixed indexed universal life insurance. Athene establishes future policy benefits for no-lapse guarantees by estimating the expected value of death benefits paid after policyholder account balances have been exhausted. Athene recognizes these benefits proportionally over the life of the contracts based on total actual and expected assessments. The methods Athene uses to estimate the liabilities have assumptions about policyholder behavior, mortality, expected yield on investments supporting the liability and market conditions affecting policyholder account balance growth.
For the liabilities associated with no-lapse guarantees, each reporting period Athene updates expected excess benefits and assessments with actual excess benefits and assessments. Athene also periodically revises the key assumptions used in the calculation of the liabilities that result in revisions to the expected excess benefits and assessments. The effects of changes in assumptions are recorded as unlocking in the period in which the changes are made. Changes in the liabilities associated with no-lapse guarantees are recorded in future policy and other policy benefits on the consolidated statements of operations.
Future policy benefits are not reduced for amounts ceded under reinsurance agreements, which are reported as reinsurance recoverable on the consolidated statements of financial condition.
Market Risk Benefits
Market risk benefits represent contracts or contract features that both provide protection to the contract holder from, and expose the insurance entity to, other-than-nominal capital market risk. Athene’s deferred annuity contracts which contain GLWB and GMDB riders that meet the criteria for, and are classified as, market risk benefits.
Market risk benefits are measured at fair value at the contract level and may be recorded as a liability or an asset, which are recorded on the consolidated statements of financial condition in market risk benefits or other assets, respectively. Multiple market risk benefits on a contract are treated as a single, compound market risk benefit. At contract inception, Athene assesses the fees and assessments that are collectible from the policyholder and allocates them to the extent they are attributable to the market risk benefit. These attributed fees are used in the valuation of the market risk benefits and are never negative or exceed total explicit fees collectible from the policyholder. If the fees are sufficient to cover the projected benefits, a non-option based valuation model is used. If the fees are insufficient to cover the projected benefits, an option-based valuation model is used to compute the market risk benefit liability at contract inception, with an equal and offsetting adjustment recognized in interest sensitive contract liabilities.
Changes in fair value of market risk benefits are recorded in market risk benefits remeasurement (gains) losses on the consolidated statements of operations, excluding portions attributed to changes in instrument-specific credit risk, which are recorded in OCI on the consolidated statements of comprehensive income (loss). Market risk benefits are not reduced for market risk benefits ceded under reinsurance agreements. Ceded market risk benefits are measured at fair value and recorded within reinsurance recoverable on the consolidated statements of financial condition.
Upon annuitization of the contract or the extinguishment of the account balance, the market risk benefit, related annuity contract and unamortized deferred costs are derecognized, including amounts within AOCI. A payout annuity is then established for GLWBs.
174
Revenues
Revenues for universal life-type policies and investment contracts, including surrender and market value adjustments, costs of insurance, policy administration, GMDB, GLWB and no-lapse guarantee charges, are earned when assessed against policyholder account balances during the period. Interest credited to policyholder account balances and the change in fair value of embedded derivatives within indexed annuity contracts is included in interest sensitive contract benefits on the consolidated statements of operations.
Premiums for long-duration contracts, including products with fixed and guaranteed premiums and benefits, are recognized as revenue when due from policyholders. When premiums are due over a significantly shorter period than the period over which benefits are provided, a deferred profit liability is established equal to the excess of the gross premium over the net premium. The deferred profit liability is recognized in future policy benefits on the consolidated statements of financial condition and amortized into income in relation to either applicable policyholder liabilities for immediate annuities with life contingencies (which includes pension group annuities) or insurance in-force for whole life products through future policy and other policy benefits on the consolidated statements of operations.
When the net premium ratio for the corresponding future policy benefit is updated for actual experience and changes to projected cash flow assumptions, the deferred profit liability is retrospectively recalculated from the contract issuance date through the beginning of the current reporting period. The revised deferred profit liability is compared to the beginning of the period carrying amount to determine the change to be recognized as a remeasurement gain or loss within future policy and other policy benefits on the consolidated statements of operations. Unlike the related future policy benefit, the deferred profit liability will not be remeasured for changes in discount rates each reporting period. Negative VOBA balances associated with payout contracts involving life contingencies, including pension group annuities, are accounted for in a manner similar to the deferred profit liability.
All insurance-related revenue is reported net of reinsurance ceded.
3. Business Combination
On September 2, 2025, Apollo completed the previously announced acquisition of Bridge in an all-stock transaction. As a result, Bridge became a consolidated subsidiary of AAM.
Under the terms of the agreement governing the Bridge acquisition, each share of Bridge Class A common stock and each Bridge Investment Group Holdings LLC (“Bridge LLC”) Class A common unit was converted into 0.07081 shares of common stock of AGM and cash paid in lieu of fractional shares. Additionally, each share of Bridge Class B common stock was converted into 0.00006 shares of common stock of AGM and cash paid in lieu of fractional shares. The purchase price was as follows:
| (In millions, except share price data and exchange ratio) | |||||
| Bridge Class A common stock purchased | |||||
| Bridge Class B common stock purchased | |||||
| Bridge LLC Class A common units purchased | |||||
| Exchange ratio for Class A common stock and Class A common units | |||||
| Exchange ratio for Class B common stock | |||||
| Shares of AGM common stock issued in exchange | |||||
| AGM common stock closing price | $ | ||||
| Value of AGM common stock issued in exchange | $ | ||||
Fair value of estimated equity instruments assumed1 | |||||
| Purchase of certain non-controlling interests | |||||
| Total consideration | |||||
| Non-controlling interest | |||||
| Total Bridge equity value | $ | ||||
1 All outstanding Bridge equity awards were converted into AGM equity awards, of which $ | |||||
175
The consideration transferred is subject to customary post-closing adjustments, which could affect the preliminary goodwill recognized. The Bridge acquisition was accounted for as a business combination. The consideration was allocated to Bridge’s assets acquired and liabilities assumed based on estimates of their fair values as of the Acquisition Date.
Adjustments to provisional amounts, if any, will be recognized in the period in which they are identified and reflected as if the accounting had been completed at the Acquisition Date. The effect on earnings of changes in amortization or other income effects, if any, as a result of any change to the provisional amounts, will be recorded in the financial statements for the period in which such change occurs, calculated as if the accounting had been completed at the Acquisition Date. The purchase price allocation is expected to be finalized as soon as practicable, but no later than one year from the Acquisition Date.
Goodwill of $1.6 billion was recognized within the Asset Management segment and is primarily attributable to the assembled workforce, enhanced origination capabilities and the scale and synergies that can be achieved subsequent to the Bridge acquisition. A majority of the goodwill recognized is expected to be deductible for tax purposes.
The following table summarizes the fair value amounts recognized for the assets acquired and liabilities assumed and resulting goodwill as of the Acquisition Date:
| (In millions) | Fair Value and Goodwill Calculation | ||||
| Total consideration | $ | ||||
| Total Value to Allocate | |||||
| Cash and cash equivalents | |||||
| Restricted cash and cash equivalents | |||||
| Investments | |||||
| Due from related parties | |||||
| Other assets | |||||
| Estimated fair value of total assets acquired, excluding goodwill | |||||
| Accounts payable, accrued expenses, and other liabilities | |||||
| Due to related parties | |||||
| Debt | |||||
| Estimated fair value of total liabilities assumed | |||||
| Estimated fair value of net assets acquired, excluding goodwill | |||||
| Non-controlling interests | |||||
| Estimated fair value of net assets acquired less non-controlling interests, excluding goodwill | ( | ||||
| Goodwill attributable to the Bridge acquisition | $ | ||||
Included within the above are provisional amounts based on the availability of data as of the date these consolidated financial statements were issued for certain investments, deferred tax liabilities included within accounts payable, accrued expenses, and other liabilities and the Bridge TRA within due to related parties. Adjustments to provisional amounts will be made as described above. In the fourth quarter of 2025, measurement period adjustments increased provisional goodwill by $19 million primarily due to an adjustment to the Bridge TRA. The effects of the measurement period adjustments were immaterial to the prior period condensed consolidated statement of operations.
The Company performed a valuation of the acquired investments and identifiable intangibles using methodologies consistent with those described in note 2 and note 7.
176
Identifiable intangible assets
The identifiable intangible assets are included in other assets on the consolidated statements of financial condition and summarized as follows:
| Management Contracts | Trade Name | |||||||
| These assets are valued using the multi-period excess earnings method, which derives value based on the present value of the cash flow attributable to the management contracts, less returns for contributory assets. Amortization of these assets is on a straight-line basis. | This represents the Bridge trade name and was valued using the relief-from-royalty method considering publicly available third-party trade name royalty rates as well as expected premiums generated by the use of the trade name over its anticipated life. Amortization of this asset is on a straight-line basis. | |||||||
The fair value and weighted average estimated useful lives of the identifiable intangible assets acquired in the Bridge acquisition consist of the following:
Fair value (in millions) | Average useful life (in years) | ||||||||||
| Management Contracts | $ | ||||||||||
| Trade Name | |||||||||||
| Total | $ | ||||||||||
As of the Acquisition Date, Bridge’s financial results are reflected in these consolidated financial statements. Bridge’s revenues of $86 million and net income (loss) of $(67 ) million are included in the consolidated statement of operations for the year ended December 31, 2025. Transaction costs of $43 million were incurred during the year ended December 31, 2025 and are included in general, administrative and other on the consolidated statements of operations.
Pro Forma Financial Information
Unaudited pro forma financial information for the years ended December 31, 2025 and 2024 are presented below. Pro forma financial information presented does not include adjustments to reflect any potential revenue synergies or cost savings that may be achievable in connection with the Bridge acquisition and assumes it occurred as of January 1, 2024. The unaudited pro forma financial information is presented for informational purposes only and is not necessarily indicative of future operations or results had the acquisition been completed as of January 1, 2024.
| Years ended December 31, | ||||||||
| (In millions) | 2025 | 2024 | ||||||
| Total Revenues | $ | $ | ||||||
| Net income attributable to Apollo Global Management, Inc. | ||||||||
Amounts above reflect certain pro forma adjustments that were directly attributable to the Bridge acquisition. These adjustments include the following:
•the elimination of historical amortization of Bridge’s intangibles and the additional amortization of intangibles measured at fair value as of the Acquisition Date;
•adjustments reflecting the purchase of all Bridge LLC Class A common units and certain other non-controlling interests in subsidiaries; and
•adjustments reflecting the transaction costs.
177
4. Investments
The following table outlines the Company’s investments:
| (In millions) | December 31, 2025 | December 31, 2024 | |||||||||
| Asset Management | |||||||||||
| Investments, at fair value | $ | $ | |||||||||
| Equity method investments | |||||||||||
| Performance allocations | |||||||||||
| Other investments | |||||||||||
Total Investments – Asset Management | |||||||||||
Retirement Services | |||||||||||
| AFS securities, at fair value | |||||||||||
| Trading securities, at fair value | |||||||||||
| Equity securities, at fair value | |||||||||||
| Mortgage loans, at fair value | |||||||||||
| Investment funds | |||||||||||
| Policy loans | |||||||||||
| Funds withheld at interest | |||||||||||
| Short-term investments | |||||||||||
| Other investments | |||||||||||
Total Investments, including related parties – Retirement Services | |||||||||||
| Total Investments | $ | $ | |||||||||
Asset Management
Net Gains (Losses) from Investment Activities
The following outlines realized and net change in unrealized gains (losses) reported in net gains (losses) from investment activities:
| Years ended December 31, | |||||||||||||||||
| (In millions) | 2025 | 2024 | 2023 | ||||||||||||||
| Realized gains (losses) on sales of investments, net | $ | $ | ( | $ | ( | ||||||||||||
| Net change in unrealized gains (losses) due to changes in fair value | ( | ||||||||||||||||
| Net gains (losses) from investment activities | $ | ( | $ | $ | |||||||||||||
Performance Allocations
Performance allocations receivable and those of consolidated VIEs are recorded within investments and investments of consolidated VIEs, respectively, in the consolidated statements of financial condition. The following table presents the performance allocations:
| (In millions) | December 31, 2025 | December 31, 2024 | |||||||||
| Performance allocations | $ | $ | |||||||||
| Performance allocations – consolidated VIEs | |||||||||||
| Total performance allocations | $ | $ | |||||||||
178
The table below provides a roll forward of the performance allocations balance:
| (In millions) | Total | ||||
Performance allocations, January 1, 2024 | $ | ||||
| Change in fair value of funds | |||||
| Fund distributions to the Company | ( | ||||
Total performance allocations, December 31, 2024 | $ | ||||
Change in fair value of funds and other1 | |||||
| Fund distributions to the Company | ( | ||||
Total performance allocations, December 31, 2025 | $ | ||||
1 Other includes $ | |||||
The change in fair value of funds excludes the general partner obligation to return previously distributed performance allocations, which is recorded in due to related parties in the consolidated statements of financial condition.
The timing of the payment of performance allocations due to the general partner or investment manager varies depending on the terms of the applicable fund agreements. Generally, performance allocations with respect to the equity funds and certain credit funds we manage are payable and are distributed to the fund’s general partner upon realization of an investment if the fund’s cumulative returns are in excess of the preferred return.
Retirement Services
AFS Securities
The following table represents the amortized cost, allowance for credit losses, gross unrealized gains and losses and fair value of Athene’s AFS investments by asset type:
| December 31, 2025 | |||||||||||||||||||||||||||||
| (In millions) | Amortized Cost | Allowance for Credit Losses | Gross Unrealized Gains | Gross Unrealized Losses | Fair Value | ||||||||||||||||||||||||
| AFS securities | |||||||||||||||||||||||||||||
| U.S. government and agencies | $ | $ | $ | $ | ( | $ | |||||||||||||||||||||||
| U.S. state, municipal and political subdivisions | ( | ||||||||||||||||||||||||||||
| Foreign governments | ( | ||||||||||||||||||||||||||||
| Corporate | ( | ( | |||||||||||||||||||||||||||
| CLO | ( | ||||||||||||||||||||||||||||
| ABS | ( | ( | |||||||||||||||||||||||||||
| CMBS | ( | ( | |||||||||||||||||||||||||||
| RMBS | ( | ( | |||||||||||||||||||||||||||
| Total AFS securities | ( | ( | |||||||||||||||||||||||||||
| AFS securities – related parties | |||||||||||||||||||||||||||||
| Corporate | ( | ||||||||||||||||||||||||||||
| CLO | ( | ||||||||||||||||||||||||||||
| ABS | ( | ( | |||||||||||||||||||||||||||
| CMBS | ( | ||||||||||||||||||||||||||||
| Total AFS securities – related parties | ( | ( | |||||||||||||||||||||||||||
| Total AFS securities, including related parties | $ | $ | ( | $ | $ | ( | $ | ||||||||||||||||||||||
179
| December 31, 2024 | |||||||||||||||||||||||||||||
| (In millions) | Amortized Cost | Allowance for Credit Losses | Gross Unrealized Gains | Gross Unrealized Losses | Fair Value | ||||||||||||||||||||||||
| AFS securities | |||||||||||||||||||||||||||||
| U.S. government and agencies | $ | $ | $ | $ | ( | $ | |||||||||||||||||||||||
| U.S. state, municipal and political subdivisions | ( | ||||||||||||||||||||||||||||
| Foreign governments | ( | ||||||||||||||||||||||||||||
| Corporate | ( | ( | |||||||||||||||||||||||||||
| CLO | ( | ||||||||||||||||||||||||||||
| ABS | ( | ( | |||||||||||||||||||||||||||
| CMBS | ( | ( | |||||||||||||||||||||||||||
| RMBS | ( | ( | |||||||||||||||||||||||||||
| Total AFS securities | ( | ( | |||||||||||||||||||||||||||
| AFS securities – related parties | |||||||||||||||||||||||||||||
| Corporate | ( | ||||||||||||||||||||||||||||
| CLO | ( | ||||||||||||||||||||||||||||
| ABS | ( | ( | |||||||||||||||||||||||||||
| Total AFS securities – related parties | ( | ( | |||||||||||||||||||||||||||
| Total AFS securities, including related parties | $ | $ | ( | $ | $ | ( | $ | ||||||||||||||||||||||
The amortized cost and fair value of AFS securities, including related parties, are shown by contractual maturity below:
| December 31, 2025 | |||||||||||
| (In millions) | Amortized Cost | Fair Value | |||||||||
| AFS securities | |||||||||||
| Due in one year or less | $ | $ | |||||||||
| Due after one year through five years | |||||||||||
| Due after five years through ten years | |||||||||||
| Due after ten years | |||||||||||
| CLO, ABS, CMBS and RMBS | |||||||||||
| Total AFS securities | |||||||||||
| AFS securities – related parties | |||||||||||
| Due in one year or less | |||||||||||
| Due after one year through five years | |||||||||||
| Due after five years through ten years | |||||||||||
| Due after ten years | |||||||||||
| CLO, ABS and CMBS | |||||||||||
| Total AFS securities – related parties | |||||||||||
| Total AFS securities, including related parties | $ | $ | |||||||||
Actual maturities can differ from contractual maturities as borrowers may have the right to call or prepay obligations with or without call or prepayment penalties.
180
Unrealized Losses on AFS Securities
The following summarizes the fair value and gross unrealized losses for AFS securities, including related parties, for which an allowance for credit losses has not been recorded, aggregated by asset type and length of time the fair value has remained below amortized cost:
| December 31, 2025 | |||||||||||||||||||||||||||||||||||
| Less than 12 months | 12 months or more | Total | |||||||||||||||||||||||||||||||||
| (In millions) | Fair Value | Gross Unrealized Losses | Fair Value | Gross Unrealized Losses | Fair Value | Gross Unrealized Losses | |||||||||||||||||||||||||||||
| AFS securities | |||||||||||||||||||||||||||||||||||
| U.S. government and agencies | $ | $ | ( | $ | $ | ( | $ | $ | ( | ||||||||||||||||||||||||||
| U.S. state, municipal and political subdivisions | ( | ( | ( | ||||||||||||||||||||||||||||||||
| Foreign governments | ( | ( | ( | ||||||||||||||||||||||||||||||||
| Corporate | ( | ( | ( | ||||||||||||||||||||||||||||||||
| CLO | ( | ( | ( | ||||||||||||||||||||||||||||||||
| ABS | ( | ( | ( | ||||||||||||||||||||||||||||||||
| CMBS | ( | ( | ( | ||||||||||||||||||||||||||||||||
| RMBS | ( | ( | ( | ||||||||||||||||||||||||||||||||
| Total AFS securities | ( | ( | ( | ||||||||||||||||||||||||||||||||
| AFS securities – related parties | |||||||||||||||||||||||||||||||||||
| Corporate | ( | ( | ( | ||||||||||||||||||||||||||||||||
| CLO | ( | ( | ( | ||||||||||||||||||||||||||||||||
| ABS | ( | ( | ( | ||||||||||||||||||||||||||||||||
| CMBS | ( | ( | |||||||||||||||||||||||||||||||||
| Total AFS securities – related parties | ( | ( | ( | ||||||||||||||||||||||||||||||||
| Total AFS securities, including related parties | $ | $ | ( | $ | $ | ( | $ | $ | ( | ||||||||||||||||||||||||||
| December 31, 2024 | |||||||||||||||||||||||||||||||||||
| Less than 12 months | 12 months or more | Total | |||||||||||||||||||||||||||||||||
| (In millions) | Fair Value | Gross Unrealized Losses | Fair Value | Gross Unrealized Losses | Fair Value | Gross Unrealized Losses | |||||||||||||||||||||||||||||
| AFS securities | |||||||||||||||||||||||||||||||||||
| U.S. government and agencies | $ | $ | ( | $ | $ | ( | $ | $ | ( | ||||||||||||||||||||||||||
| U.S. state, municipal and political subdivisions | ( | ( | ( | ||||||||||||||||||||||||||||||||
| Foreign governments | ( | ( | ( | ||||||||||||||||||||||||||||||||
| Corporate | ( | ( | ( | ||||||||||||||||||||||||||||||||
| CLO | ( | ( | ( | ||||||||||||||||||||||||||||||||
| ABS | ( | ( | ( | ||||||||||||||||||||||||||||||||
| CMBS | ( | ( | ( | ||||||||||||||||||||||||||||||||
| RMBS | ( | ( | ( | ||||||||||||||||||||||||||||||||
| Total AFS securities | ( | ( | ( | ||||||||||||||||||||||||||||||||
| AFS securities – related parties | |||||||||||||||||||||||||||||||||||
| Corporate | ( | ( | ( | ||||||||||||||||||||||||||||||||
| CLO | ( | ( | ( | ||||||||||||||||||||||||||||||||
| ABS | ( | ( | ( | ||||||||||||||||||||||||||||||||
| Total AFS securities – related parties | ( | ( | ( | ||||||||||||||||||||||||||||||||
| Total AFS securities, including related parties | $ | $ | ( | $ | $ | ( | $ | $ | ( | ||||||||||||||||||||||||||
181
The following summarizes the number of AFS securities that were in an unrealized loss position, including related parties, for which an allowance for credit losses has not been recorded:
| December 31, 2025 | |||||||||||
| Unrealized Loss Position | Unrealized Loss Position 12 Months or More | ||||||||||
| AFS securities | |||||||||||
| AFS securities – related parties | |||||||||||
The unrealized losses on AFS securities can primarily be attributed to changes in market interest rates since acquisition of the securities. Athene did not recognize the unrealized losses in income, unless as required for hedge accounting, as it intends to hold these securities and it is not more likely than not it will be required to sell a security before the recovery of its amortized cost.
Allowance for Credit Losses
The following table summarizes the activity in the allowance for credit losses for AFS securities by asset type:
| Year ended December 31, 2025 | |||||||||||||||||||||||||||||
| Additions | Reductions | ||||||||||||||||||||||||||||
| (In millions) | Beginning balance | Initial credit losses | Securities sold during the period | Additions (reductions) to previously impaired securities | Ending balance | ||||||||||||||||||||||||
| AFS securities | |||||||||||||||||||||||||||||
| Corporate | $ | $ | $ | ( | $ | ( | $ | ||||||||||||||||||||||
| ABS | ( | ||||||||||||||||||||||||||||
| CMBS | |||||||||||||||||||||||||||||
| RMBS | ( | ||||||||||||||||||||||||||||
| Total AFS securities | ( | ||||||||||||||||||||||||||||
| AFS securities – related parties, ABS | |||||||||||||||||||||||||||||
| Total AFS securities, including related parties | $ | $ | $ | ( | $ | $ | |||||||||||||||||||||||
| Year ended December 31, 2024 | |||||||||||||||||||||||||||||
| Additions | Reductions | ||||||||||||||||||||||||||||
| (In millions) | Beginning balance | Initial credit losses | Securities sold during the period | Additions (reductions) to previously impaired securities | Ending balance | ||||||||||||||||||||||||
| AFS securities | |||||||||||||||||||||||||||||
| Corporate | $ | $ | $ | ( | $ | $ | |||||||||||||||||||||||
| CLO | ( | ||||||||||||||||||||||||||||
| ABS | ( | ||||||||||||||||||||||||||||
| CMBS | |||||||||||||||||||||||||||||
| RMBS | ( | ||||||||||||||||||||||||||||
| Total AFS securities | ( | ||||||||||||||||||||||||||||
| AFS securities – related parties, ABS | |||||||||||||||||||||||||||||
| Total AFS securities, including related parties | $ | $ | $ | ( | $ | $ | |||||||||||||||||||||||
182
Net Investment Income
Net investment income by asset class consists of the following:
| Years ended December 31, | |||||||||||||||||
| (In millions) | 2025 | 2024 | 2023 | ||||||||||||||
| AFS securities | $ | $ | $ | ||||||||||||||
| Trading securities | |||||||||||||||||
| Equity securities | |||||||||||||||||
| Mortgage loans | |||||||||||||||||
| Investment funds | ( | ||||||||||||||||
| Funds withheld at interest | |||||||||||||||||
| Other | |||||||||||||||||
| Investment revenue | |||||||||||||||||
| Investment expenses | ( | ( | ( | ||||||||||||||
| Net investment income | $ | $ | $ | ||||||||||||||
Investment Related Gains (Losses)
Investment related gains (losses) by asset class consists of the following:
| Years ended December 31, | |||||||||||||||||
| (In millions) | 2025 | 2024 | 2023 | ||||||||||||||
AFS securities1 | |||||||||||||||||
| Gross realized gains on investment activity | $ | $ | $ | ||||||||||||||
| Gross realized losses on investment activity | ( | ( | ( | ||||||||||||||
| Net realized investment gains (losses) on AFS securities | ( | ||||||||||||||||
| Net recognized investment gains (losses) on trading securities | ( | ||||||||||||||||
| Net recognized investment gains on equity securities | |||||||||||||||||
| Net recognized investment gains (losses) on mortgage loans | ( | ||||||||||||||||
| ( | |||||||||||||||||
| Provision for credit losses | ( | ( | ( | ||||||||||||||
| Other gains (losses) | ( | ( | |||||||||||||||
| Investment related gains (losses) | $ | $ | $ | ||||||||||||||
1 Includes the effects of recognized gains or losses on AFS securities associated with designated hedges. | |||||||||||||||||
Proceeds from sales of AFS securities were $36,337 million, $21,623 million and $6,464 million for the years ended December 31, 2025, 2024 and 2023, respectively.
The following table summarizes the change in unrealized gains (losses) on trading and equity securities held as of the respective period end:
| Years ended December 31, | |||||||||||||||||
| (In millions) | 2025 | 2024 | 2023 | ||||||||||||||
| Trading securities | $ | $ | ( | $ | |||||||||||||
| Equity securities | |||||||||||||||||
183
Repurchase Agreements
The following table summarizes the remaining contractual maturities of repurchase agreements:
| (In millions) | December 31, 2025 | December 31, 2024 | |||||||||
| Less than 30 days | $ | $ | |||||||||
| 30 – 90 days | |||||||||||
| 91 days to 1 year | |||||||||||
| Greater than 1 year | |||||||||||
Payables for repurchase agreements | $ | $ | |||||||||
The following table summarizes the securities pledged as collateral for repurchase agreements:
| December 31, 2025 | December 31, 2024 | ||||||||||||||||||||||
| (In millions) | Amortized Cost | Fair Value | Amortized Cost | Fair Value | |||||||||||||||||||
| AFS securities | |||||||||||||||||||||||
| U.S. government and agencies | $ | $ | $ | $ | |||||||||||||||||||
| Foreign governments | |||||||||||||||||||||||
| Corporate | |||||||||||||||||||||||
| CLO | |||||||||||||||||||||||
| ABS | |||||||||||||||||||||||
| CMBS | |||||||||||||||||||||||
| RMBS | |||||||||||||||||||||||
| Total securities pledged under repurchase agreements | $ | $ | $ | $ | |||||||||||||||||||
As of December 31, 2025, $907 million of repurchase agreements were presented net of reverse repurchase agreements on the consolidated statements of financial condition.
Reverse Repurchase Agreements
As of December 31, 2025 and December 31, 2024, amounts loaned under reverse repurchase agreements were $1,067 million and $935 million, respectively, and the fair value of the collateral, comprised primarily of asset-backed securities and short-term investments, was $1,822 million and $2,208 million, respectively.
Mortgage Loans, including related parties and consolidated VIEs
Mortgage loans include both commercial and residential loans. Athene has elected the fair value option on its mortgage loan portfolio. See note 7 for further fair value option information. The following represents the mortgage loan portfolio, with fair value option loans presented at unpaid principal balance:
| (In millions) | December 31, 2025 | December 31, 2024 | |||||||||
| Commercial mortgage loans | $ | $ | |||||||||
| Commercial mortgage loans under development | |||||||||||
| Total commercial mortgage loans | |||||||||||
| Mark to fair value | ( | ( | |||||||||
| Commercial mortgage loans | |||||||||||
| Residential mortgage loans | |||||||||||
| Mark to fair value | ( | ||||||||||
| Residential mortgage loans | |||||||||||
| Mortgage loans | $ | $ | |||||||||
184
Athene invests in commercial mortgage loans, primarily on income-producing properties including office and retail buildings, apartments, hotels, and industrial properties. Athene diversifies the commercial mortgage loan portfolio by geographic region and property type to reduce concentration risk. Athene evaluates mortgage loans based on relevant current information to confirm whether properties are performing at a consistent and acceptable level to secure the related debt.
The distribution of commercial mortgage loans, including those under development, by property type and geographic region is as follows:
| December 31, 2025 | December 31, 2024 | ||||||||||||||||||||||
| (In millions, except percentages) | Fair Value | Percentage of Total | Fair Value | Percentage of Total | |||||||||||||||||||
| Property type | |||||||||||||||||||||||
| Apartment | $ | % | $ | % | |||||||||||||||||||
| Industrial | % | % | |||||||||||||||||||||
| Office building | % | % | |||||||||||||||||||||
| Hotels | % | % | |||||||||||||||||||||
| Retail | % | % | |||||||||||||||||||||
| Other commercial | % | % | |||||||||||||||||||||
| Total commercial mortgage loans | $ | % | $ | % | |||||||||||||||||||
| U.S. region | |||||||||||||||||||||||
| East North Central | $ | % | $ | % | |||||||||||||||||||
| East South Central | % | % | |||||||||||||||||||||
| Middle Atlantic | % | % | |||||||||||||||||||||
| Mountain | % | % | |||||||||||||||||||||
| New England | % | % | |||||||||||||||||||||
| Pacific | % | % | |||||||||||||||||||||
| South Atlantic | % | % | |||||||||||||||||||||
| West North Central | % | % | |||||||||||||||||||||
| West South Central | % | % | |||||||||||||||||||||
| Total U.S. region | % | % | |||||||||||||||||||||
| International region | |||||||||||||||||||||||
| U.K. | % | % | |||||||||||||||||||||
Other international1 | % | % | |||||||||||||||||||||
| Total international region | % | % | |||||||||||||||||||||
| Total commercial mortgage loans | $ | % | $ | % | |||||||||||||||||||
1 Represents all other countries, with each individual country comprising less than 5% of the portfolio. | |||||||||||||||||||||||
Athene’s residential mortgage loan portfolio primarily consists of first lien residential mortgage loans collateralized by properties in various geographic locations and is summarized by proportion of the portfolio in the following table:
| December 31, 2025 | December 31, 2024 | ||||||||||
| U.S. States | |||||||||||
| California | % | % | |||||||||
| Texas | % | % | |||||||||
| Florida | % | % | |||||||||
Other1 | % | % | |||||||||
| Total U.S. residential mortgage loan percentage | % | % | |||||||||
International1 | % | % | |||||||||
| Total residential mortgage loan percentage | % | % | |||||||||
1 Represents all other states or countries, with each individual state or country comprising less than 5% of the portfolio. | |||||||||||
185
Investment Funds
Athene’s investment fund portfolio strategy primarily focuses on core holdings of origination and retirement services platforms, equity and credit, and other funds. Origination platforms include investments sourced by affiliated platforms that originate loans to third parties and in which Athene gains exposure directly to the loan or indirectly through its ownership of the origination platform and/or securitizations of assets originated by the origination platform. Retirement services platforms include investments in equity of financial services companies. The credit strategy is comprised of direct origination, asset-backed, multi-credit and opportunistic credit funds focused on generating excess returns through high-quality credit underwriting and origination. The equity strategy is comprised of private equity, hybrid value, secondaries equity, real estate equity, infrastructure and clean transition equity funds that raise capital from investors to pursue control-oriented investments across the universe of private assets. Investment funds can meet the definition of VIEs. The investment funds do not specify timing of distributions on the funds’ underlying assets.
The following summarizes Athene’s investment funds, including related parties and consolidated VIEs:
| December 31, 2025 | December 31, 2024 | ||||||||||||||||||||||
| (In millions, except percentages) | Carrying Value | Percentage of Total | Carrying Value | Percentage of Total | |||||||||||||||||||
| Investment funds | |||||||||||||||||||||||
| Equity | $ | % | $ | % | |||||||||||||||||||
| Investment funds – related parties | |||||||||||||||||||||||
| Origination platforms | % | % | |||||||||||||||||||||
| Retirement services platforms | % | % | |||||||||||||||||||||
| Equity | % | % | |||||||||||||||||||||
| Credit | % | % | |||||||||||||||||||||
| Other | % | % | |||||||||||||||||||||
| Total investment funds – related parties | % | % | |||||||||||||||||||||
| Investment funds – consolidated VIEs | |||||||||||||||||||||||
| Origination platforms | % | % | |||||||||||||||||||||
| Equity | % | % | |||||||||||||||||||||
| Credit | % | % | |||||||||||||||||||||
| Other | % | % | |||||||||||||||||||||
| Total investment funds – consolidated VIEs | % | % | |||||||||||||||||||||
| Total investment funds, including related parties and consolidated VIEs | $ | % | $ | % | |||||||||||||||||||
Concentrations—The following table represents Athene’s investment concentrations in excess of 10% of stockholders’ equity:
| (In millions) | December 31, 2025 | ||||
| Investment-grade ABS debt issued by AP Grange Holdings, LLC | $ | ||||
Investments in Atlas Securitized Products Holdings LP (Atlas)1 | |||||
| Investment-grade ABS debt issued by Fox Hedge L.P. | |||||
Investment-grade ABS debt issued by Apollo Multi-Asset Prime Securities (AMAPS) 2, LLC1 | |||||
| Investment-grade ABS debt issued by AP Alkaios (Luxembourg) S.à.r.l. | |||||
Investment-grade ABS debt issued by AMAPS 1, LLC1 | |||||
| December 31, 2024 | |||||
| Investment-grade ABS debt issued by AP Grange Holdings, LLC | $ | ||||
Investments in Atlas1 | |||||
| Investment-grade ABS debt issued by Fox Hedge L.P. | |||||
1 Amounts are representative of single issuer risk and may only include a portion of the total investments associated with a related party. For Atlas, see note 18 for additional information. | |||||
186
5. Derivatives
Athene uses a variety of derivative instruments to manage risks, primarily equity, interest rate, foreign currency and market volatility. See note 2 for a description of our accounting policies for derivatives and note 7 for information about the fair value hierarchy for derivatives.
The following table presents the notional amount and fair value of derivative instruments:
| December 31, 2025 | December 31, 2024 | ||||||||||||||||||||||||||||||||||
| Notional Amount | Fair Value | Notional Amount | Fair Value | ||||||||||||||||||||||||||||||||
| (In millions) | Assets | Liabilities | Assets | Liabilities | |||||||||||||||||||||||||||||||
| Derivatives designated as hedges | |||||||||||||||||||||||||||||||||||
| Foreign currency hedges | |||||||||||||||||||||||||||||||||||
| Swaps | $ | $ | $ | $ | |||||||||||||||||||||||||||||||
| Forwards | |||||||||||||||||||||||||||||||||||
| Interest rate swaps | |||||||||||||||||||||||||||||||||||
| Forwards on net investments | |||||||||||||||||||||||||||||||||||
| Interest rate swaps | |||||||||||||||||||||||||||||||||||
| Total derivatives designated as hedges | |||||||||||||||||||||||||||||||||||
| Derivatives not designated as hedges | |||||||||||||||||||||||||||||||||||
| Equity options | |||||||||||||||||||||||||||||||||||
| Futures | |||||||||||||||||||||||||||||||||||
| Foreign currency swaps | |||||||||||||||||||||||||||||||||||
| Interest rate swaps and forwards | |||||||||||||||||||||||||||||||||||
| Other swaps | |||||||||||||||||||||||||||||||||||
| Foreign currency forwards | |||||||||||||||||||||||||||||||||||
| Embedded derivatives | |||||||||||||||||||||||||||||||||||
| Funds withheld, including related parties | ( | ( | |||||||||||||||||||||||||||||||||
| Interest sensitive contract liabilities | |||||||||||||||||||||||||||||||||||
| Total derivatives not designated as hedges | |||||||||||||||||||||||||||||||||||
| $ | $ | $ | $ | ||||||||||||||||||||||||||||||||
Derivatives Designated as Hedges
Cash Flow Hedges
Athene uses interest rate swaps to convert floating-rate interest payments to fixed-rate interest payments to reduce exposure to interest rate changes. The interest rate swaps will expire by December 2035. During the years ended December 31, 2025, 2024 and 2023, Athene recognized gains of $170 million, $1 million and $33 million, respectively, in OCI associated with these hedges. There were no 27 million to be reclassified to income within the next 12 months based on current market economics; however, actual amounts recognized may vary as a result of changes in relevant market conditions.
Fair Value Hedges Athene uses foreign currency forward contracts, foreign currency swaps, foreign currency interest rate swaps and interest rate swaps that are designated and accounted for as fair value hedges to hedge certain exposures to foreign currency risk and interest rate risk. The foreign currency forward price is agreed upon at the time of the contract and payment is made at a specified future date. The amortized cost of AFS debt securities in qualifying fair value hedges of foreign currency risk was $21.3 billion and $16.3 billion as of December 31, 2025 and 2024, respectively. The carrying value of interest sensitive contract liabilities in qualifying fair value hedges of foreign currency swaps was $8.4 billion and $2.4 billion as of December 31, 2025 and 2024, respectively.
187
The following represents the carrying amount and the cumulative amount of fair value hedging adjustments of hedged liabilities, excluding those solely hedging foreign currency risk:
| December 31, 2025 | December 31, 2024 | ||||||||||||||||||||||
| (In millions) | Carrying amount of the hedged liabilities | Cumulative amount of fair value hedging gains (losses)1 | Carrying amount of the hedged liabilities | Cumulative amount of fair value hedging gains (losses) | |||||||||||||||||||
| Interest sensitive contract liabilities | |||||||||||||||||||||||
| Foreign currency interest rate swaps | $ | $ | $ | $ | |||||||||||||||||||
| Interest rate swaps | ( | ||||||||||||||||||||||
1 Excludes gains (losses) related to foreign currency risk. | |||||||||||||||||||||||
The following is a summary of the gains (losses) related to the derivatives and related hedged items in fair value hedge relationships:
| Amounts excluded | |||||||||||||||||||||||||||||
| (In millions) | Derivatives | Hedged items | Net | Recognized in income through amortization approach | Recognized in income through changes in fair value | ||||||||||||||||||||||||
| Year ended December 31, 2025 | |||||||||||||||||||||||||||||
| Investment related gains (losses) | |||||||||||||||||||||||||||||
| Foreign currency forwards | $ | ( | $ | $ | ( | $ | $ | ||||||||||||||||||||||
| Foreign currency swaps | ( | ||||||||||||||||||||||||||||
| Foreign currency interest rate swaps | ( | ||||||||||||||||||||||||||||
| Interest rate swaps | ( | ||||||||||||||||||||||||||||
| Interest sensitive contract benefits | |||||||||||||||||||||||||||||
| Foreign currency interest rate swaps | ( | ||||||||||||||||||||||||||||
| Year ended December 31, 2024 | |||||||||||||||||||||||||||||
| Investment related gains (losses) | |||||||||||||||||||||||||||||
| Foreign currency forwards | ( | ( | |||||||||||||||||||||||||||
| Foreign currency swaps | ( | ( | |||||||||||||||||||||||||||
| Foreign currency interest rate swaps | ( | ( | |||||||||||||||||||||||||||
| Interest rate swaps | ( | ( | |||||||||||||||||||||||||||
| Interest sensitive contract benefits | |||||||||||||||||||||||||||||
| Foreign currency interest rate swaps | ( | ||||||||||||||||||||||||||||
| Year ended December 31, 2023 | |||||||||||||||||||||||||||||
| Investment related gains (losses) | |||||||||||||||||||||||||||||
| Foreign currency forwards | ( | ( | |||||||||||||||||||||||||||
| Foreign currency swaps | ( | ||||||||||||||||||||||||||||
| Foreign currency interest rate swaps | ( | ||||||||||||||||||||||||||||
| Interest rate swaps | ( | ( | |||||||||||||||||||||||||||
| Interest sensitive contract benefits | |||||||||||||||||||||||||||||
| Foreign currency interest rate swaps | ( | ( | |||||||||||||||||||||||||||
The following is a summary of the gains (losses) excluded from the assessment of hedge effectiveness that were recognized in OCI:
| Years ended December 31, | |||||||||||||||||
| (In millions) | 2025 | 2024 | 2023 | ||||||||||||||
| Foreign currency forwards | $ | $ | ( | $ | ( | ||||||||||||
| Foreign currency swaps | ( | ( | |||||||||||||||
188
Net Investment Hedges
Athene uses foreign currency forwards to hedge the foreign currency exchange rate risk of its investments in subsidiaries that have a reporting currency other than the U.S. dollar. Hedge effectiveness is assessed based on the changes in forward rates. During the years ended December 31, 2025, 2024 and 2023, these derivatives had losses of $15 million, gains of $3 million and losses of $4 million, respectively. These derivatives are included in foreign currency translation and other adjustments on the consolidated statements of comprehensive income (loss). As of December 31, 2025 and 2024, the cumulative foreign currency translations recorded in AOCI related to these net investment hedges were gains of $14 million and $29 million, respectively. During the years ended December 31, 2025, 2024 and 2023, there were no amounts deemed ineffective.
Derivatives Not Designated as Hedges
Equity options
Athene uses equity indexed options to economically hedge indexed annuity products that guarantee the return of principal to the policyholder and credit interest based on a percentage of the gain in a specified market index, including the S&P 500 and other bespoke indices. To hedge against adverse changes in equity indices, Athene enters into contracts to buy equity indexed options. The contracts are net settled in cash based on differentials in the indices at the time of exercise and the strike price.
Futures
Athene purchases futures contracts to hedge the growth in interest credited to the customer as a direct result of increases in the related indices. Athene enters into exchange-traded futures with regulated futures commission clearing brokers who are members of a trading exchange. Under exchange-traded futures contracts, Athene agrees to purchase a specified number of contracts with other parties and to post variation margin on a daily basis in an amount equal to the difference in the daily fair values of those contracts.
Interest rate swaps and forwards
Athene uses interest rate swaps and forwards to reduce market risks from interest rate changes and to alter interest rate exposure arising from duration mismatches between assets and liabilities. With an interest rate swap, Athene agrees with another party to exchange the difference between fixed-rate and floating-rate interest amounts tied to an agreed-upon notional principal amount at specified intervals.
Other swaps
Other swaps include total return swaps, credit default swaps and swaptions. Athene purchases total rate of return swaps to gain exposure and benefit from a reference asset or index without ownership. Credit default swaps provide a measure of protection against the default of an issuer or allow Athene to gain credit exposure to an issuer or traded index. Athene uses credit default swaps coupled with a bond to synthetically create the characteristics of a reference bond. Swaptions provide an option to enter into an interest rate swap and are used by Athene to hedge against interest rate exposure.
Embedded derivatives
Athene has embedded derivatives which are required to be separated from their host contracts and reported as derivatives. Host contracts include reinsurance agreements structured on a modco or funds withheld basis and indexed annuity products.
189
The following is a summary of the gains (losses) related to derivatives not designated as hedges:
| Years ended December 31, | |||||||||||||||||
| (In millions) | 2025 | 2024 | 2023 | ||||||||||||||
| Equity options | $ | $ | $ | ||||||||||||||
| Futures | |||||||||||||||||
| Foreign currency swaps | ( | ( | |||||||||||||||
| Interest rate swaps and forwards and other swaps | ( | ||||||||||||||||
| Foreign currency forwards | ( | ( | ( | ||||||||||||||
| Embedded derivatives on funds withheld | |||||||||||||||||
| Amounts recognized in investment related gains (losses) | ( | ||||||||||||||||
Embedded derivatives in indexed annuity products1 | ( | ( | ( | ||||||||||||||
| Total gains (losses) on derivatives not designated as hedges | $ | ( | $ | $ | |||||||||||||
1 Included in interest sensitive contract benefits on the consolidated statements of operations. | |||||||||||||||||
Credit Risk
Athene may be exposed to credit-related losses in the event of counterparty nonperformance on derivative financial instruments. Generally, the current credit exposure of Athene’s derivative contracts is the fair value at the reporting date less any collateral received from the counterparty.
Athene manages credit risk related to over-the-counter derivatives by entering into transactions with creditworthy counterparties. Where possible, Athene maintains collateral arrangements and uses master netting agreements that provide for a single net payment from one counterparty to another at each due date and upon termination. Athene has also established counterparty exposure limits, where possible, in order to evaluate if there is sufficient collateral to support the net exposure.
Collateral arrangements typically require the posting of collateral in connection with its derivative instruments. Collateral agreements often contain posting thresholds, some of which may vary depending on the posting party’s financial strength ratings. Additionally, a decrease in Athene’s financial strength rating to a specified level can result in settlement of the derivative position.
The estimated fair value of Athene’s net derivative and other financial assets and liabilities after the application of master netting agreements and collateral were as follows:
Gross amounts not offset on the consolidated statements of financial condition | |||||||||||||||||||||||||||||||||||
| (In millions) | Gross amount recognized1 | Financial instruments2 | Collateral (received)/pledged | Net amount | Off-balance sheet securities collateral3 | Net amount after securities collateral | |||||||||||||||||||||||||||||
| December 31, 2025 | |||||||||||||||||||||||||||||||||||
| Derivative assets | $ | $ | ( | $ | ( | $ | $ | ( | $ | ( | |||||||||||||||||||||||||
| Derivative liabilities | ( | ( | ( | ||||||||||||||||||||||||||||||||
| December 31, 2024 | |||||||||||||||||||||||||||||||||||
| Derivative assets | $ | $ | ( | $ | ( | $ | $ | $ | |||||||||||||||||||||||||||
| Derivative liabilities | ( | ( | ( | ||||||||||||||||||||||||||||||||
1 The gross amounts of recognized derivative assets and derivative liabilities are reported on the consolidated statements of financial condition. As of December 31, 2025 and December 31, 2024, amounts not subject to master netting or similar agreements were immaterial. | |||||||||||||||||||||||||||||||||||
2 Represents amounts offsetting derivative assets and derivative liabilities that are subject to an enforceable master netting agreement or similar agreement that are not netted against the gross derivative assets or gross derivative liabilities for presentation on the consolidated statements of financial condition. | |||||||||||||||||||||||||||||||||||
3 For non-cash collateral received, Athene does not recognize the collateral on the consolidated statements of financial condition unless the obligor (transferor) has defaulted under the terms of the secured contract and is no longer entitled to redeem the pledged asset. Amounts do not include any excess of collateral pledged or received. | |||||||||||||||||||||||||||||||||||
190
Certain derivative instruments contain provisions for credit-related events, such as a negative credit event of a credit default swap’s reference entity. If a credit event were to occur, Athene may be required to settle an outstanding liability. Athene has written credit default swaps primarily on an index of North American High Yield Corporate bonds for a notional amount of $510 million. As of December 31, 2025, the carrying value of these derivatives was approximately $76 million in assets and less than $1 million in liabilities. As of December 31, 2025 and 2024, the maximum amount of potential future payments on the credit default swaps was $510 million and $10 million, respectively.
6. Variable Interest Entities
A variable interest in a VIE is an investment or other interest that will absorb portions of the VIE’s expected losses and/or receive expected residual returns. Variable interests in consolidated VIEs and unconsolidated VIEs are discussed separately below.
Consolidated VIEs
Consolidated VIEs include certain CLOs and funds managed by the Company and other entities where the Company is deemed the primary beneficiary. Consolidated VIEs also include certain investment managers and general partners of the funds managed by the Company. Such investment managers and general partners have other equity investors at risk that do not have the ability to make significant decisions related to the entity’s operations.
The assets of consolidated VIEs are not available to creditors of the Company, and the investors in these consolidated VIEs have no recourse against the assets of the Company. Similarly, there is no recourse to the Company for the consolidated VIEs’ liabilities.
Other assets of the consolidated VIEs include short-term receivables due from investments sold, interest receivables and performance fee allocations. Accounts payable, accrued expenses, and other liabilities of consolidated VIEs include debt, profit sharing payable and other short-term payables.
Results from certain consolidated VIEs are reported on up to a three-month lag based upon the availability of financial information.
Consolidated Variable Interest Entities—Asset Management
The following table presents the investments of the consolidated VIEs:
| (In millions) | December 31, 2025 | December 31, 2024 | |||||||||
| Asset Management | |||||||||||
| Investments, at fair value | $ | $ | |||||||||
| Equity method investments | |||||||||||
| Performance allocations | |||||||||||
| Other investments | |||||||||||
| Total Investments – Asset Management | $ | $ | |||||||||
The following table presents net gains (losses) from investment activities of the consolidated VIEs:
| Years ended December 31, | |||||||||||||||||
| (In millions) | 2025 | 2024 | 2023 | ||||||||||||||
| Net gains (losses) from investment activities | $ | $ | $ | ||||||||||||||
| Net gains (losses) from debt | ( | ||||||||||||||||
| Interest and other income | |||||||||||||||||
| Interest and other expenses | ( | ( | ( | ||||||||||||||
| Net gains (losses) from investment activities of consolidated variable interest entities | $ | $ | $ | ||||||||||||||
191
In addition, we recognize revenues and expenses of certain consolidated VIEs within management fees, investment income (loss), compensation and benefits and general, administrative and other. The following table presents revenues, expenses and other gains (losses) related to the activities of these VIEs.
| Years ended December 31, | |||||||||||||||||
| (In millions) | 2025 | 2024 | 2023 | ||||||||||||||
| Revenues | $ | $ | $ | ||||||||||||||
| Expenses | |||||||||||||||||
| Other gains (losses) | ( | ||||||||||||||||
Included within other liabilities are amounts due to third-party institutions by the consolidated VIEs. The following table summarizes the principal provisions of those amounts:
| December 31, 2025 | December 31, 2024 | ||||||||||||||||||||||||||||||||||
| (In millions, except percentages) | Principal Outstanding | Weighted Average Interest Rate | Weighted Average Remaining Maturity in Years | Principal Outstanding | Weighted Average Interest Rate | Weighted Average Remaining Maturity in Years | |||||||||||||||||||||||||||||
| Asset Management | |||||||||||||||||||||||||||||||||||
Subscription lines1 | $ | % | $ | % | |||||||||||||||||||||||||||||||
Total – Asset Management | $ | $ | |||||||||||||||||||||||||||||||||
1 The subscription lines of the consolidated VIEs are collateralized by assets held by each respective vehicle and assets of one vehicle may not be used to satisfy the liabilities of another vehicle. | |||||||||||||||||||||||||||||||||||
The consolidated VIEs’ debt obligations contain various customary loan covenants. As of December 31, 2025, the Company was not aware of any instances of non-compliance with any of these covenants.
Consolidated Variable Interest Entities—Retirement Services
The following summarizes the statements of operations activity of the consolidated VIEs:
| Years ended December 31, | |||||||||||||||||
| (In millions) | 2025 | 2024 | 2023 | ||||||||||||||
| Trading securities | $ | $ | $ | ||||||||||||||
| Mortgage loans | |||||||||||||||||
| Investment funds | |||||||||||||||||
| Investment expenses and other | ( | ( | |||||||||||||||
| Net investment income | |||||||||||||||||
Net recognized investment gains on trading securities | |||||||||||||||||
Net recognized investment gains (losses) on mortgage loans | ( | ( | |||||||||||||||
Net recognized investment gains on investment funds | |||||||||||||||||
Other gains (losses) | ( | ( | |||||||||||||||
| Investment related gains (losses) | |||||||||||||||||
| Revenues of consolidated variable interest entities | $ | $ | $ | ||||||||||||||
192
Unconsolidated Variable Interest Entities—Asset Management
The following table presents the maximum exposure to losses relating to these VIEs for which Apollo has concluded that it holds a significant variable interest, but that it is not the primary beneficiary.
| (In millions) | December 31, 2025 | December 31, 2024 | |||||||||
Maximum Loss Exposure1,2 | $ | $ | |||||||||
1 Represents Apollo’s direct investment in those entities in which it holds a significant variable interest and certain other investments. Additionally, cumulative performance allocations are subject to reversal in the event of future losses. | |||||||||||
2 Some amounts included are a quarter in arrears. | |||||||||||
Unconsolidated Variable Interest Entities—Retirement Services
Athene has variable interests in certain unconsolidated VIEs in the form of securities and ownership stakes in investment funds.
Fixed maturity securities
Athene invests in securitization entities as a debt holder or an investor in the residual interest of the securitization vehicle. These entities are deemed VIEs due to insufficient equity within the structure and lack of control by the equity investors over the activities that significantly impact the economics of the entity. In general, Athene is a debt investor within these entities and, as such, holds a variable interest; however, due to the debt holders’ lack of ability to control the decisions within the structure that significantly impact the entity, and the fact the debt holders are protected from losses due to the subordination of the equity tranche, the debt holders are not deemed the primary beneficiary. Securitization vehicles in which Athene holds the residual tranche are not consolidated because Athene does not unilaterally have substantive rights to remove the general partner, or when assessing related party interests, Athene is not under common control, as defined by U.S. GAAP, with the related parties, nor are substantially all of the activities conducted on Athene’s behalf; therefore, Athene is not deemed the primary beneficiary. Debt investments and investments in the residual tranche of securitization entities are considered debt instruments, and are held at fair value.
Investment funds
Investment funds include non-fixed income, alternative investments in the form of limited partnerships or similar legal structures.
Equity securities
Athene invests in preferred equity securities issued by entities deemed to be VIEs due to insufficient equity within the structure.
Athene’s risk of loss associated with its non-consolidated investments depends on the investment. Investment funds, equity securities and trading securities are limited to the carrying value plus unfunded commitments. AFS securities are limited to amortized cost plus unfunded commitments.
The following summarizes the carrying value and maximum loss exposure of these non-consolidated investments:
| December 31, 2025 | December 31, 2024 | ||||||||||||||||||||||
| (In millions) | Carrying Value | Maximum Loss Exposure | Carrying Value | Maximum Loss Exposure | |||||||||||||||||||
| Investment funds | $ | $ | $ | $ | |||||||||||||||||||
| Investment in related parties – investment funds | |||||||||||||||||||||||
| Assets of consolidated VIEs – investment funds | |||||||||||||||||||||||
| Investment in fixed maturity securities | |||||||||||||||||||||||
| Investment in related parties – fixed maturity securities | |||||||||||||||||||||||
| Investment in related parties – equity securities | |||||||||||||||||||||||
| Total non-consolidated investments | $ | $ | $ | $ | |||||||||||||||||||
193
7. Fair Value
Fair Value Measurements of Financial Instruments
The following summarizes the Company’s financial assets and liabilities recorded at fair value hierarchy level:
| December 31, 2025 | |||||||||||||||||||||||||||||
| (In millions) | Level 1 | Level 2 | Level 3 | NAV | Total | ||||||||||||||||||||||||
| Assets | |||||||||||||||||||||||||||||
Asset Management | |||||||||||||||||||||||||||||
| Cash and cash equivalents | $ | $ | $ | $ | — | $ | |||||||||||||||||||||||
| Restricted cash and cash equivalents | — | ||||||||||||||||||||||||||||
| Cash and cash equivalents of consolidated VIEs | — | ||||||||||||||||||||||||||||
| Investments | 1 | ||||||||||||||||||||||||||||
| Investments of consolidated VIEs | |||||||||||||||||||||||||||||
Due from related parties2 | — | ||||||||||||||||||||||||||||
Derivative assets3 | — | ||||||||||||||||||||||||||||
Total Assets – Asset Management | |||||||||||||||||||||||||||||
Retirement Services | |||||||||||||||||||||||||||||
| AFS Securities | |||||||||||||||||||||||||||||
| U.S. government and agencies | — | ||||||||||||||||||||||||||||
| U.S. state, municipal and political subdivisions | — | ||||||||||||||||||||||||||||
| Foreign governments | — | ||||||||||||||||||||||||||||
| Corporate | — | ||||||||||||||||||||||||||||
| CLO | — | ||||||||||||||||||||||||||||
| ABS | — | ||||||||||||||||||||||||||||
| CMBS | — | ||||||||||||||||||||||||||||
| RMBS | — | ||||||||||||||||||||||||||||
| Total AFS securities | — | ||||||||||||||||||||||||||||
| Trading securities | — | ||||||||||||||||||||||||||||
| Equity securities | — | ||||||||||||||||||||||||||||
| Mortgage loans | — | ||||||||||||||||||||||||||||
| Funds withheld at interest – embedded derivative | ( | — | ( | ||||||||||||||||||||||||||
| Derivative assets | — | ||||||||||||||||||||||||||||
| Short-term investments | — | ||||||||||||||||||||||||||||
| Other investments | — | ||||||||||||||||||||||||||||
| Cash and cash equivalents | — | ||||||||||||||||||||||||||||
| Restricted cash and cash equivalents | — | ||||||||||||||||||||||||||||
| Investments in related parties | |||||||||||||||||||||||||||||
| AFS securities | |||||||||||||||||||||||||||||
| Corporate | — | ||||||||||||||||||||||||||||
| CLO | — | ||||||||||||||||||||||||||||
| ABS | — | ||||||||||||||||||||||||||||
| CMBS | — | ||||||||||||||||||||||||||||
| Total AFS securities – related parties | — | ||||||||||||||||||||||||||||
| Trading securities | — | ||||||||||||||||||||||||||||
| Equity securities | — | ||||||||||||||||||||||||||||
| Mortgage loans | — | ||||||||||||||||||||||||||||
| Investment funds | — | ||||||||||||||||||||||||||||
| Funds withheld at interest – embedded derivative | ( | — | ( | ||||||||||||||||||||||||||
| Other investments | — | ||||||||||||||||||||||||||||
| Reinsurance recoverable | — | ||||||||||||||||||||||||||||
Other assets5 | — | ||||||||||||||||||||||||||||
| (Continued) | |||||||||||||||||||||||||||||
194
| December 31, 2025 | |||||||||||||||||||||||||||||
| (In millions) | Level 1 | Level 2 | Level 3 | NAV | Total | ||||||||||||||||||||||||
| Assets of consolidated VIEs | |||||||||||||||||||||||||||||
| Trading securities | — | ||||||||||||||||||||||||||||
| Mortgage loans | — | ||||||||||||||||||||||||||||
| Investment funds | |||||||||||||||||||||||||||||
| Cash and cash equivalents | — | ||||||||||||||||||||||||||||
Total Assets – Retirement Services | |||||||||||||||||||||||||||||
| Total Assets | $ | $ | $ | $ | $ | ||||||||||||||||||||||||
| Liabilities | |||||||||||||||||||||||||||||
Asset Management | |||||||||||||||||||||||||||||
Contingent consideration obligations4 | $ | $ | $ | $ | — | $ | |||||||||||||||||||||||
Derivative liabilities3 | — | ||||||||||||||||||||||||||||
Total Liabilities – Asset Management | — | ||||||||||||||||||||||||||||
Retirement Services | |||||||||||||||||||||||||||||
| Interest sensitive contract liabilities | |||||||||||||||||||||||||||||
| Embedded derivative | — | ||||||||||||||||||||||||||||
| Universal life benefits | — | ||||||||||||||||||||||||||||
| Future policy benefits | |||||||||||||||||||||||||||||
| AmerUs Life Insurance Company (“AmerUs”) Closed Block | — | ||||||||||||||||||||||||||||
| Indianapolis Life Insurance Company (“ILICO”) Closed Block and life benefits | — | ||||||||||||||||||||||||||||
Market risk benefits5 | — | ||||||||||||||||||||||||||||
| Derivative liabilities | — | ||||||||||||||||||||||||||||
| Other liabilities | — | ||||||||||||||||||||||||||||
Total Liabilities – Retirement Services | — | ||||||||||||||||||||||||||||
| Total Liabilities | $ | $ | $ | $ | — | $ | |||||||||||||||||||||||
| (Continued) | |||||||||||||||||||||||||||||
195
| December 31, 2024 | |||||||||||||||||||||||||||||
| (In millions) | Level 1 | Level 2 | Level 3 | NAV | Total | ||||||||||||||||||||||||
| Assets | |||||||||||||||||||||||||||||
Asset Management | |||||||||||||||||||||||||||||
| Cash and cash equivalents | $ | $ | $ | $ | — | $ | |||||||||||||||||||||||
| Restricted cash and cash equivalents | — | ||||||||||||||||||||||||||||
| Cash and cash equivalents of consolidated VIEs | — | ||||||||||||||||||||||||||||
| Investments | 1 | ||||||||||||||||||||||||||||
| Investments of consolidated VIEs | |||||||||||||||||||||||||||||
Due from related parties2 | — | ||||||||||||||||||||||||||||
Derivative assets3 | — | ||||||||||||||||||||||||||||
Total Assets – Asset Management | |||||||||||||||||||||||||||||
Retirement Services | |||||||||||||||||||||||||||||
| AFS Securities | |||||||||||||||||||||||||||||
| U.S. government and agencies | — | ||||||||||||||||||||||||||||
| U.S. state, municipal and political subdivisions | — | ||||||||||||||||||||||||||||
| Foreign governments | — | ||||||||||||||||||||||||||||
| Corporate | — | ||||||||||||||||||||||||||||
| CLO | — | ||||||||||||||||||||||||||||
| ABS | — | ||||||||||||||||||||||||||||
| CMBS | — | ||||||||||||||||||||||||||||
| RMBS | — | ||||||||||||||||||||||||||||
| Total AFS securities | — | ||||||||||||||||||||||||||||
| Trading securities | — | ||||||||||||||||||||||||||||
| Equity securities | — | ||||||||||||||||||||||||||||
| Mortgage loans | — | ||||||||||||||||||||||||||||
| Funds withheld at interest – embedded derivative | ( | — | ( | ||||||||||||||||||||||||||
| Derivative assets | — | ||||||||||||||||||||||||||||
| Short-term investments | — | ||||||||||||||||||||||||||||
| Other investments | — | ||||||||||||||||||||||||||||
| Cash and cash equivalents | — | ||||||||||||||||||||||||||||
| Restricted cash and cash equivalents | — | ||||||||||||||||||||||||||||
| Investments in related parties | |||||||||||||||||||||||||||||
| AFS securities | |||||||||||||||||||||||||||||
| Corporate | — | ||||||||||||||||||||||||||||
| CLO | — | ||||||||||||||||||||||||||||
| ABS | — | ||||||||||||||||||||||||||||
| Total AFS securities – related parties | — | ||||||||||||||||||||||||||||
| Trading securities | — | ||||||||||||||||||||||||||||
| Equity securities | — | ||||||||||||||||||||||||||||
| Mortgage loans | — | ||||||||||||||||||||||||||||
| Investment funds | — | ||||||||||||||||||||||||||||
| Funds withheld at interest – embedded derivative | ( | — | ( | ||||||||||||||||||||||||||
| Other investments | — | ||||||||||||||||||||||||||||
| Reinsurance recoverable | — | ||||||||||||||||||||||||||||
Other assets5 | — | ||||||||||||||||||||||||||||
| Assets of consolidated VIEs | |||||||||||||||||||||||||||||
| Trading securities | — | ||||||||||||||||||||||||||||
| Mortgage loans | — | ||||||||||||||||||||||||||||
| Investment funds | |||||||||||||||||||||||||||||
| (Continued) | |||||||||||||||||||||||||||||
196
| December 31, 2024 | |||||||||||||||||||||||||||||
| (In millions) | Level 1 | Level 2 | Level 3 | NAV | Total | ||||||||||||||||||||||||
| Other investments | — | ||||||||||||||||||||||||||||
| Cash and cash equivalents | — | ||||||||||||||||||||||||||||
Total Assets – Retirement Services | |||||||||||||||||||||||||||||
| Total Assets | $ | $ | $ | $ | $ | ||||||||||||||||||||||||
| Liabilities | |||||||||||||||||||||||||||||
Asset Management | |||||||||||||||||||||||||||||
Contingent consideration obligations4 | $ | $ | $ | $ | — | $ | |||||||||||||||||||||||
Total Liabilities – Asset Management | — | ||||||||||||||||||||||||||||
Retirement Services | |||||||||||||||||||||||||||||
| Interest sensitive contract liabilities | |||||||||||||||||||||||||||||
| Embedded derivative | — | ||||||||||||||||||||||||||||
| Universal life benefits | — | ||||||||||||||||||||||||||||
| Future policy benefits | |||||||||||||||||||||||||||||
| AmerUs Closed Block | — | ||||||||||||||||||||||||||||
| ILICO Closed Block and life benefits | — | ||||||||||||||||||||||||||||
Market risk benefits5 | — | ||||||||||||||||||||||||||||
| Derivative liabilities | — | ||||||||||||||||||||||||||||
| Other liabilities | — | ||||||||||||||||||||||||||||
Total Liabilities – Retirement Services | — | ||||||||||||||||||||||||||||
| Total Liabilities | $ | $ | $ | $ | — | $ | |||||||||||||||||||||||
| (Concluded) | |||||||||||||||||||||||||||||
1 Investments as of December 31, 2025 and December 31, 2024 excludes $ | |||||||||||||||||||||||||||||
2 Due from related parties represents a receivable from a fund. | |||||||||||||||||||||||||||||
3 Derivative assets and derivative liabilities are presented as a component of Other assets and Other liabilities, respectively, in the consolidated statements of financial condition. | |||||||||||||||||||||||||||||
4 Other liabilities includes profit sharing payable related to contingent obligations classified as Level 3. | |||||||||||||||||||||||||||||
5 Other assets consist of market risk benefits assets. See note 11 for additional information on market risk benefits assets and liabilities valuation methodology and additional fair value disclosures. | |||||||||||||||||||||||||||||
Changes in fair value of contingent consideration obligations in connection with the acquisition of Stone Tower are recorded in compensation and benefits expense in the consolidated statements of operations. Refer to note 19 for further details.
197
Level 3 Financial Instruments
The following tables summarize the valuation techniques and quantitative inputs and assumptions used for financial assets and liabilities categorized as Level 3:
| December 31, 2025 | ||||||||||||||||||||||||||||||||
Fair Value (In millions) | Valuation Technique | Unobservable Inputs | Ranges | Weighted Average | ||||||||||||||||||||||||||||
| Financial Assets | ||||||||||||||||||||||||||||||||
| Asset Management | ||||||||||||||||||||||||||||||||
| Investments | $ | Discounted cash flow | Discount rate | 1 | ||||||||||||||||||||||||||||
| Direct capitalization | Capitalization rate | |||||||||||||||||||||||||||||||
| Adjusted transaction value | N/A | N/A | N/A | |||||||||||||||||||||||||||||
| Due from related parties | Discounted cash flow | Discount rate | ||||||||||||||||||||||||||||||
| Derivative assets | Option model | Volatility rate | ||||||||||||||||||||||||||||||
| Investments of consolidated VIEs | ||||||||||||||||||||||||||||||||
| Bank loans | Discounted cash flow | Discount rate | 1 | |||||||||||||||||||||||||||||
| Adjusted transaction value | N/A | N/A | N/A | |||||||||||||||||||||||||||||
| Equity securities | Discounted cash flow | Discount rate | 1 | |||||||||||||||||||||||||||||
| Adjusted transaction value | N/A | N/A | N/A | |||||||||||||||||||||||||||||
| Option model | Volatility rate | 1 | ||||||||||||||||||||||||||||||
| Bonds | Adjusted transaction value | N/A | N/A | N/A | ||||||||||||||||||||||||||||
| Retirement Services | ||||||||||||||||||||||||||||||||
| AFS, trading and equity securities | Discounted cash flow | Discount rate | 1 | |||||||||||||||||||||||||||||
Mortgage loans2 | Discounted cash flow | Discount rate | 1 | |||||||||||||||||||||||||||||
| Recoverability | Estimated proceeds | N/A | N/A | |||||||||||||||||||||||||||||
Investment funds2 | Discounted cash flow | Discount rate | 1 | |||||||||||||||||||||||||||||
| Recoverability | Estimated proceeds | N/A | N/A | |||||||||||||||||||||||||||||
| Reported net asset value | Reported net asset value | N/A | N/A | |||||||||||||||||||||||||||||
| Financial Liabilities | ||||||||||||||||||||||||||||||||
| Asset Management | ||||||||||||||||||||||||||||||||
| Contingent consideration obligations | Discounted cash flow | Discount rate | 1 | |||||||||||||||||||||||||||||
| Retirement Services | ||||||||||||||||||||||||||||||||
| Interest sensitive contract liabilities – indexed annuities embedded derivatives | Discounted cash flow | Nonperformance risk | 3 | |||||||||||||||||||||||||||||
| Option budget | 4 | |||||||||||||||||||||||||||||||
| Surrender rate | 4 | |||||||||||||||||||||||||||||||
1 Unobservable inputs were weighted based on the fair value of the investments included in the range. | ||||||||||||||||||||||||||||||||
2 Includes those of consolidated VIEs. | ||||||||||||||||||||||||||||||||
3 The nonperformance risk weighted average is based on the projected cash flows attributable to the embedded derivative. | ||||||||||||||||||||||||||||||||
4 The option budget and surrender rate weighted averages are calculated based on projected account values. | ||||||||||||||||||||||||||||||||
198
| December 31, 2024 | ||||||||||||||||||||||||||||||||
Fair Value (In millions) | Valuation Techniques | Unobservable Inputs | Ranges | Weighted Average | ||||||||||||||||||||||||||||
| Financial Assets | ||||||||||||||||||||||||||||||||
| Asset Management | ||||||||||||||||||||||||||||||||
| Investments | $ | Discounted cash flow | Discount rate | 1 | ||||||||||||||||||||||||||||
| Direct capitalization | Capitalization rate | |||||||||||||||||||||||||||||||
| Adjusted transaction value | N/A | N/A | N/A | |||||||||||||||||||||||||||||
| Due from related parties | Discounted cash flow | Discount rate | ||||||||||||||||||||||||||||||
| Derivative assets | Option model | Volatility rate | ||||||||||||||||||||||||||||||
| Investments of consolidated VIEs | ||||||||||||||||||||||||||||||||
| Bank loans | Discounted cash flow | Discount rate | 1 | |||||||||||||||||||||||||||||
| Adjusted transaction value | N/A | N/A | N/A | |||||||||||||||||||||||||||||
| Equity securities | Dividend discount model | Discount rate | ||||||||||||||||||||||||||||||
| Discounted cash flow | Discount rate | 1 | ||||||||||||||||||||||||||||||
| Adjusted transaction value | N/A | N/A | N/A | |||||||||||||||||||||||||||||
| Option model | Volatility rate | 1 | ||||||||||||||||||||||||||||||
| Bonds | Discounted cash flow | Discount rate | 1 | |||||||||||||||||||||||||||||
| Adjusted transaction value | N/A | N/A | N/A | |||||||||||||||||||||||||||||
| Retirement Services | ||||||||||||||||||||||||||||||||
| AFS, trading and equity securities | Discounted cash flow | Discount rate | 1 | |||||||||||||||||||||||||||||
Mortgage loans2 | Discounted cash flow | Discount rate | 1 | |||||||||||||||||||||||||||||
Investment funds2 | Discounted cash flow | Discount rate | 1 | |||||||||||||||||||||||||||||
| Financial Liabilities | ||||||||||||||||||||||||||||||||
| Asset Management | ||||||||||||||||||||||||||||||||
| Contingent consideration obligations | Discounted cash flow | Discount rate | 1 | |||||||||||||||||||||||||||||
| Retirement Services | ||||||||||||||||||||||||||||||||
| Interest sensitive contract liabilities – indexed annuities embedded derivatives | Discounted cash flow | Nonperformance risk | 3 | |||||||||||||||||||||||||||||
| Option budget | 4 | |||||||||||||||||||||||||||||||
| Surrender rate | 4 | |||||||||||||||||||||||||||||||
1 Unobservable inputs were weighted based on the fair value of the investments included in the range. | ||||||||||||||||||||||||||||||||
2 Includes those of consolidated VIEs. | ||||||||||||||||||||||||||||||||
3 The nonperformance risk weighted average is based on the projected cash flows attributable to the embedded derivative. | ||||||||||||||||||||||||||||||||
4 The option budget and surrender rate weighted averages are calculated based on projected account values. | ||||||||||||||||||||||||||||||||
199
The following are reconciliations for Level 3 assets and liabilities measured at fair value on a recurring basis:
| Year ended December 31, 2025 | |||||||||||||||||||||||||||||||||||||||||||||||
| Total realized and unrealized gains (losses) | |||||||||||||||||||||||||||||||||||||||||||||||
| (In millions) | Beginning Balance | Net Purchases, Issuances, Sales and Settlements | Net Transfers In (Out) | Ending Balance | Total Gains (Losses) Included in OCI1 | ||||||||||||||||||||||||||||||||||||||||||
Assets – Asset Management | |||||||||||||||||||||||||||||||||||||||||||||||
| Investments and derivative assets | $ | $ | $ | $ | $ | $ | $ | $ | |||||||||||||||||||||||||||||||||||||||
| Investments of consolidated VIEs | ( | ( | |||||||||||||||||||||||||||||||||||||||||||||
Total Level 3 assets – Asset Management | $ | $ | $ | $ | $ | ( | $ | $ | ( | $ | |||||||||||||||||||||||||||||||||||||
Assets – Retirement Services | |||||||||||||||||||||||||||||||||||||||||||||||
| AFS securities | |||||||||||||||||||||||||||||||||||||||||||||||
| Foreign governments | $ | $ | ( | $ | $ | ( | $ | $ | $ | $ | |||||||||||||||||||||||||||||||||||||
| Corporate | ( | ||||||||||||||||||||||||||||||||||||||||||||||
| ABS | ( | ||||||||||||||||||||||||||||||||||||||||||||||
| CMBS | ( | ( | |||||||||||||||||||||||||||||||||||||||||||||
| RMBS | ( | ( | ( | ||||||||||||||||||||||||||||||||||||||||||||
| Trading securities | ( | ( | |||||||||||||||||||||||||||||||||||||||||||||
| Equity securities | ( | ( | ( | ||||||||||||||||||||||||||||||||||||||||||||
| Mortgage loans | |||||||||||||||||||||||||||||||||||||||||||||||
| Funds withheld at interest – embedded derivative | ( | ( | |||||||||||||||||||||||||||||||||||||||||||||
| Derivative assets | |||||||||||||||||||||||||||||||||||||||||||||||
| Short-term investments | ( | ( | |||||||||||||||||||||||||||||||||||||||||||||
| Other investments | ( | ||||||||||||||||||||||||||||||||||||||||||||||
| Investments in related parties | |||||||||||||||||||||||||||||||||||||||||||||||
| AFS securities | |||||||||||||||||||||||||||||||||||||||||||||||
| Corporate | ( | ( | |||||||||||||||||||||||||||||||||||||||||||||
| CLO | ( | ||||||||||||||||||||||||||||||||||||||||||||||
| ABS | ( | ||||||||||||||||||||||||||||||||||||||||||||||
| Trading securities | ( | ( | |||||||||||||||||||||||||||||||||||||||||||||
| Equity securities | |||||||||||||||||||||||||||||||||||||||||||||||
| Mortgage loans | |||||||||||||||||||||||||||||||||||||||||||||||
| Investment funds | |||||||||||||||||||||||||||||||||||||||||||||||
| Funds withheld at interest – embedded derivative | ( | ( | |||||||||||||||||||||||||||||||||||||||||||||
| Other investments | |||||||||||||||||||||||||||||||||||||||||||||||
| Reinsurance recoverable | |||||||||||||||||||||||||||||||||||||||||||||||
| Assets of consolidated VIEs | |||||||||||||||||||||||||||||||||||||||||||||||
| Trading securities | ( | ||||||||||||||||||||||||||||||||||||||||||||||
| Mortgage loans | ( | ( | |||||||||||||||||||||||||||||||||||||||||||||
| Investment funds | ( | ( | ( | ||||||||||||||||||||||||||||||||||||||||||||
| Other investments | ( | ||||||||||||||||||||||||||||||||||||||||||||||
Total Level 3 assets – Retirement Services | $ | $ | $ | $ | $ | ( | $ | $ | $ | ||||||||||||||||||||||||||||||||||||||
| (Continued) | |||||||||||||||||||||||||||||||||||||||||||||||
200
| Year ended December 31, 2025 | |||||||||||||||||||||||||||||||||||||||||||||||
| Total realized and unrealized gains (losses) | |||||||||||||||||||||||||||||||||||||||||||||||
| (In millions) | Beginning Balance | Net Purchases, Issuances, Sales and Settlements | Net Transfers In (Out) | Ending Balance | Total Gains (Losses) Included in OCI1 | ||||||||||||||||||||||||||||||||||||||||||
Liabilities – Asset Management | |||||||||||||||||||||||||||||||||||||||||||||||
| Contingent consideration obligations | $ | $ | $ | $ | ( | $ | $ | $ | $ | ||||||||||||||||||||||||||||||||||||||
Total Level 3 liabilities – Asset Management | $ | $ | $ | $ | ( | $ | $ | $ | $ | ||||||||||||||||||||||||||||||||||||||
Liabilities – Retirement Services | |||||||||||||||||||||||||||||||||||||||||||||||
| Interest sensitive contract liabilities | |||||||||||||||||||||||||||||||||||||||||||||||
| Embedded derivative | $ | ( | $ | ( | $ | $ | ( | $ | $ | ( | $ | $ | |||||||||||||||||||||||||||||||||||
| Universal life benefits | ( | ( | ( | ||||||||||||||||||||||||||||||||||||||||||||
| Future policy benefits | |||||||||||||||||||||||||||||||||||||||||||||||
| AmerUs Closed Block | ( | ( | |||||||||||||||||||||||||||||||||||||||||||||
| ILICO Closed Block and life benefits | ( | ( | |||||||||||||||||||||||||||||||||||||||||||||
| Derivative liabilities | ( | ||||||||||||||||||||||||||||||||||||||||||||||
| Other liabilities | ( | ( | ( | ||||||||||||||||||||||||||||||||||||||||||||
Total Level 3 liabilities – Retirement Services | $ | ( | $ | ( | $ | $ | ( | $ | $ | ( | $ | $ | |||||||||||||||||||||||||||||||||||
| (Concluded) | |||||||||||||||||||||||||||||||||||||||||||||||
1 Related to instruments held at end of period. | |||||||||||||||||||||||||||||||||||||||||||||||
| Year ended December 31, 2024 | |||||||||||||||||||||||||||||||||||||||||||||||
| Total realized and unrealized gains (losses) | |||||||||||||||||||||||||||||||||||||||||||||||
| (In millions) | Beginning Balance | Net Purchases, Issuances, Sales and Settlements | Net Transfers In (Out) | Ending Balance | Total Gains (Losses) Included in OCI1 | ||||||||||||||||||||||||||||||||||||||||||
Assets – Asset Management | |||||||||||||||||||||||||||||||||||||||||||||||
| Investments and derivative assets | $ | $ | ( | $ | $ | ( | $ | ( | $ | $ | $ | ||||||||||||||||||||||||||||||||||||
| Investments of consolidated VIEs | ( | ( | |||||||||||||||||||||||||||||||||||||||||||||
Total Level 3 assets – Asset Management | $ | $ | ( | $ | $ | $ | $ | $ | $ | ||||||||||||||||||||||||||||||||||||||
Assets – Retirement Services | |||||||||||||||||||||||||||||||||||||||||||||||
| AFS securities | |||||||||||||||||||||||||||||||||||||||||||||||
| Foreign governments | $ | $ | $ | $ | ( | $ | $ | $ | $ | ||||||||||||||||||||||||||||||||||||||
| Corporate | ( | ( | ( | ||||||||||||||||||||||||||||||||||||||||||||
| ABS | ( | ( | ( | ( | |||||||||||||||||||||||||||||||||||||||||||
| CMBS | ( | ( | |||||||||||||||||||||||||||||||||||||||||||||
| RMBS | ( | ( | |||||||||||||||||||||||||||||||||||||||||||||
| Trading securities | ( | ( | |||||||||||||||||||||||||||||||||||||||||||||
| Equity securities | |||||||||||||||||||||||||||||||||||||||||||||||
| Mortgage loans | ( | ( | |||||||||||||||||||||||||||||||||||||||||||||
| Funds withheld at interest – embedded derivative | ( | ( | |||||||||||||||||||||||||||||||||||||||||||||
| Derivative assets | |||||||||||||||||||||||||||||||||||||||||||||||
| Short-term investments | ( | ( | ( | ( | |||||||||||||||||||||||||||||||||||||||||||
| Other investments | ( | ( | |||||||||||||||||||||||||||||||||||||||||||||
| (Continued) | |||||||||||||||||||||||||||||||||||||||||||||||
201
| Year ended December 31, 2024 | |||||||||||||||||||||||||||||||||||||||||||||||
| Total realized and unrealized gains (losses) | |||||||||||||||||||||||||||||||||||||||||||||||
| (In millions) | Beginning Balance | Net Purchases, Issuances, Sales and Settlements | Net Transfers In (Out) | Ending Balance | Total Gains (Losses) Included in OCI1 | ||||||||||||||||||||||||||||||||||||||||||
| Investments in related parties | |||||||||||||||||||||||||||||||||||||||||||||||
| AFS securities | |||||||||||||||||||||||||||||||||||||||||||||||
| Corporate | ( | ( | |||||||||||||||||||||||||||||||||||||||||||||
| CLO | |||||||||||||||||||||||||||||||||||||||||||||||
| ABS | ( | ( | |||||||||||||||||||||||||||||||||||||||||||||
| Trading securities | ( | ( | ( | ||||||||||||||||||||||||||||||||||||||||||||
| Equity securities | ( | ( | ( | ||||||||||||||||||||||||||||||||||||||||||||
| Mortgage loans | ( | ||||||||||||||||||||||||||||||||||||||||||||||
| Investment funds | ( | ( | |||||||||||||||||||||||||||||||||||||||||||||
| Funds withheld at interest – embedded derivative | ( | ( | |||||||||||||||||||||||||||||||||||||||||||||
| Other investments | ( | ( | |||||||||||||||||||||||||||||||||||||||||||||
| Reinsurance recoverable | ( | ||||||||||||||||||||||||||||||||||||||||||||||
| Assets of consolidated VIEs | |||||||||||||||||||||||||||||||||||||||||||||||
| Trading securities | ( | ( | |||||||||||||||||||||||||||||||||||||||||||||
| Mortgage loans | ( | ( | |||||||||||||||||||||||||||||||||||||||||||||
| Investment funds | ( | ( | ( | ||||||||||||||||||||||||||||||||||||||||||||
| Other investments | ( | ( | ( | ||||||||||||||||||||||||||||||||||||||||||||
Total Level 3 assets – Retirement Services | $ | $ | ( | $ | ( | $ | $ | ( | $ | $ | ( | $ | ( | ||||||||||||||||||||||||||||||||||
Liabilities – Asset Management | |||||||||||||||||||||||||||||||||||||||||||||||
| Contingent consideration obligations | $ | $ | $ | $ | ( | $ | $ | $ | $ | ||||||||||||||||||||||||||||||||||||||
Total Level 3 liabilities – Asset Management | $ | $ | $ | $ | ( | $ | $ | $ | $ | ||||||||||||||||||||||||||||||||||||||
Liabilities – Retirement Services | |||||||||||||||||||||||||||||||||||||||||||||||
| Interest sensitive contract liabilities | |||||||||||||||||||||||||||||||||||||||||||||||
| Embedded derivative | $ | ( | $ | ( | $ | $ | ( | $ | $ | ( | $ | $ | |||||||||||||||||||||||||||||||||||
| Universal life benefits | ( | ( | |||||||||||||||||||||||||||||||||||||||||||||
| Future policy benefits | |||||||||||||||||||||||||||||||||||||||||||||||
| AmerUs Closed Block | ( | ( | |||||||||||||||||||||||||||||||||||||||||||||
| ILICO Closed Block and life benefits | ( | ( | ( | ||||||||||||||||||||||||||||||||||||||||||||
| Derivative liabilities | ( | ( | |||||||||||||||||||||||||||||||||||||||||||||
| Other liabilities | ( | ( | ( | ||||||||||||||||||||||||||||||||||||||||||||
Total Level 3 liabilities – Retirement Services | $ | ( | $ | ( | $ | $ | ( | $ | $ | ( | $ | $ | |||||||||||||||||||||||||||||||||||
| (Concluded) | |||||||||||||||||||||||||||||||||||||||||||||||
1 Related to instruments held at end of period. | |||||||||||||||||||||||||||||||||||||||||||||||
202
The following represents the gross components of purchases, issuances, sales and settlements, net, and net transfers in (out) shown above:
| Year ended December 31, 2025 | |||||||||||||||||||||||||||||||||||||||||||||||
| (In millions) | Purchases | Issuances | Sales | Settlements | Net Purchases, Issuances, Sales and Settlements | Transfers In | Transfers Out | Net Transfers In (Out) | |||||||||||||||||||||||||||||||||||||||
Assets – Asset Management | |||||||||||||||||||||||||||||||||||||||||||||||
| Investments and derivative assets | $ | $ | $ | ( | $ | $ | $ | $ | $ | ||||||||||||||||||||||||||||||||||||||
| Investments of consolidated VIEs | ( | ( | ( | ||||||||||||||||||||||||||||||||||||||||||||
Total Level 3 assets – Asset Management | $ | $ | $ | ( | $ | $ | $ | $ | ( | $ | ( | ||||||||||||||||||||||||||||||||||||
Assets – Retirement Services | |||||||||||||||||||||||||||||||||||||||||||||||
| AFS securities | |||||||||||||||||||||||||||||||||||||||||||||||
| Foreign governments | $ | $ | $ | $ | ( | $ | ( | $ | $ | $ | |||||||||||||||||||||||||||||||||||||
| Corporate | ( | ( | ( | ( | |||||||||||||||||||||||||||||||||||||||||||
| ABS | ( | ( | ( | ( | |||||||||||||||||||||||||||||||||||||||||||
| CMBS | ( | ||||||||||||||||||||||||||||||||||||||||||||||
| RMBS | ( | ( | ( | ( | |||||||||||||||||||||||||||||||||||||||||||
| Trading securities | ( | ( | ( | ||||||||||||||||||||||||||||||||||||||||||||
| Equity securities | ( | ( | |||||||||||||||||||||||||||||||||||||||||||||
| Mortgage loans | ( | ( | |||||||||||||||||||||||||||||||||||||||||||||
| Short-term investments | ( | ( | ( | ( | |||||||||||||||||||||||||||||||||||||||||||
| Other investments | ( | ( | |||||||||||||||||||||||||||||||||||||||||||||
| Investments in related parties | |||||||||||||||||||||||||||||||||||||||||||||||
| AFS securities | |||||||||||||||||||||||||||||||||||||||||||||||
| Corporate | ( | ||||||||||||||||||||||||||||||||||||||||||||||
| CLO | ( | ||||||||||||||||||||||||||||||||||||||||||||||
| ABS | ( | ( | ( | ( | |||||||||||||||||||||||||||||||||||||||||||
| Trading securities | ( | ( | ( | ||||||||||||||||||||||||||||||||||||||||||||
| Mortgage loans | ( | ( | |||||||||||||||||||||||||||||||||||||||||||||
| Investment funds | |||||||||||||||||||||||||||||||||||||||||||||||
| Reinsurance recoverable | ( | ||||||||||||||||||||||||||||||||||||||||||||||
| Assets of consolidated VIEs | |||||||||||||||||||||||||||||||||||||||||||||||
| Trading securities | ( | ( | ( | ||||||||||||||||||||||||||||||||||||||||||||
| Mortgage loans | ( | ( | ( | ( | ( | ||||||||||||||||||||||||||||||||||||||||||
| Investment funds | ( | ( | |||||||||||||||||||||||||||||||||||||||||||||
| Other investments | ( | ( | ( | ||||||||||||||||||||||||||||||||||||||||||||
Total Level 3 assets – Retirement Services | $ | $ | $ | ( | $ | ( | $ | $ | $ | ( | $ | ( | |||||||||||||||||||||||||||||||||||
Liabilities – Asset Management | |||||||||||||||||||||||||||||||||||||||||||||||
| Contingent consideration obligations | $ | $ | $ | $ | ( | $ | ( | $ | $ | $ | |||||||||||||||||||||||||||||||||||||
Total Level 3 liabilities – Asset Management | $ | $ | $ | $ | ( | $ | ( | $ | $ | $ | |||||||||||||||||||||||||||||||||||||
Liabilities – Retirement Services | |||||||||||||||||||||||||||||||||||||||||||||||
| Interest sensitive contract liabilities – embedded derivative | $ | $ | ( | $ | $ | $ | ( | $ | $ | $ | |||||||||||||||||||||||||||||||||||||
| Other liabilities | |||||||||||||||||||||||||||||||||||||||||||||||
Total Level 3 liabilities – Retirement Services | $ | $ | ( | $ | $ | $ | ( | $ | $ | $ | |||||||||||||||||||||||||||||||||||||
203
| Year ended December 31, 2024 | |||||||||||||||||||||||||||||||||||||||||||||||
| (In millions) | Purchases | Issuances | Sales | Settlements | Net Purchases, Issuances, Sales and Settlements | Transfers In | Transfers Out | Net Transfers In (Out) | |||||||||||||||||||||||||||||||||||||||
Assets – Asset Management | |||||||||||||||||||||||||||||||||||||||||||||||
| Investments and derivative assets | $ | $ | $ | ( | $ | $ | ( | $ | $ | ( | $ | ( | |||||||||||||||||||||||||||||||||||
| Investments of consolidated VIEs | ( | ( | |||||||||||||||||||||||||||||||||||||||||||||
Total Level 3 assets – Asset Management | $ | $ | $ | ( | $ | $ | $ | $ | ( | $ | |||||||||||||||||||||||||||||||||||||
Assets – Retirement Services | |||||||||||||||||||||||||||||||||||||||||||||||
| AFS securities | |||||||||||||||||||||||||||||||||||||||||||||||
| Foreign governments | $ | $ | $ | $ | ( | $ | ( | $ | $ | $ | |||||||||||||||||||||||||||||||||||||
| Corporate | ( | ( | ( | ( | |||||||||||||||||||||||||||||||||||||||||||
| ABS | ( | ( | ( | ( | |||||||||||||||||||||||||||||||||||||||||||
| CMBS | ( | ( | |||||||||||||||||||||||||||||||||||||||||||||
| RMBS | ( | ( | ( | ||||||||||||||||||||||||||||||||||||||||||||
| Trading securities | ( | ( | |||||||||||||||||||||||||||||||||||||||||||||
| Equity securities | ( | ( | |||||||||||||||||||||||||||||||||||||||||||||
| Mortgage loans | ( | ( | |||||||||||||||||||||||||||||||||||||||||||||
| Derivative assets | |||||||||||||||||||||||||||||||||||||||||||||||
| Short-term investments | ( | ( | ( | ( | |||||||||||||||||||||||||||||||||||||||||||
| Other investments | |||||||||||||||||||||||||||||||||||||||||||||||
| Investments in related parties | |||||||||||||||||||||||||||||||||||||||||||||||
| AFS securities | |||||||||||||||||||||||||||||||||||||||||||||||
| Corporate | ( | ( | ( | ( | |||||||||||||||||||||||||||||||||||||||||||
| CLO | |||||||||||||||||||||||||||||||||||||||||||||||
| ABS | ( | ( | |||||||||||||||||||||||||||||||||||||||||||||
| Trading securities | ( | ( | |||||||||||||||||||||||||||||||||||||||||||||
| Equity securities | ( | ( | |||||||||||||||||||||||||||||||||||||||||||||
| Mortgage loans | ( | ( | |||||||||||||||||||||||||||||||||||||||||||||
| Investment funds | |||||||||||||||||||||||||||||||||||||||||||||||
| Reinsurance recoverable | ( | ||||||||||||||||||||||||||||||||||||||||||||||
| Assets of consolidated VIEs | |||||||||||||||||||||||||||||||||||||||||||||||
| Trading securities | ( | ( | ( | ||||||||||||||||||||||||||||||||||||||||||||
| Mortgage loans | ( | ||||||||||||||||||||||||||||||||||||||||||||||
| Investment funds | ( | ( | ( | ||||||||||||||||||||||||||||||||||||||||||||
| Other investments | ( | ( | ( | ||||||||||||||||||||||||||||||||||||||||||||
Total Level 3 assets – Retirement Services | $ | $ | $ | ( | $ | ( | $ | $ | $ | ( | $ | ( | |||||||||||||||||||||||||||||||||||
Liabilities – Asset Management | |||||||||||||||||||||||||||||||||||||||||||||||
| Contingent consideration obligations | $ | $ | $ | $ | ( | $ | ( | $ | $ | $ | |||||||||||||||||||||||||||||||||||||
Total Level 3 liabilities – Asset Management | $ | $ | $ | $ | ( | $ | ( | $ | $ | $ | |||||||||||||||||||||||||||||||||||||
Liabilities – Retirement Services | |||||||||||||||||||||||||||||||||||||||||||||||
| Interest sensitive contract liabilities – embedded derivative | $ | $ | ( | $ | $ | $ | ( | $ | $ | $ | |||||||||||||||||||||||||||||||||||||
| Other liabilities | |||||||||||||||||||||||||||||||||||||||||||||||
Total Level 3 liabilities – Retirement Services | $ | $ | ( | $ | $ | $ | ( | $ | $ | $ | |||||||||||||||||||||||||||||||||||||
204
Financial Instruments Without Readily Determinable Fair Values
The Company elected the measurement alternative to account for an equity security that did not have a readily determinable fair value. The equity security was held at cost less any impairment. In connection with the initial public offering of the issuer of the equity security during the second quarter of 2025, the Company transitioned to measuring the investment at fair value using Level 1 inputs. This resulted in an observable transaction price below the Company’s carrying amount. Consequently, the Company recognized an impairment loss of $257 million during the second quarter of 2025 and the carrying value of the investment was written down to its fair value of $101 million as of June 30, 2025. The carrying amount of the equity security was $358 million, net of an impairment of $42 million, as of December 31, 2024.
Fair Value Option – Retirement Services
The following represents the gains (losses) recorded for instruments for which Athene has elected the fair value option, including related parties and VIEs:
| Years ended December 31, | |||||||||||||||||
| (In millions) | 2025 | 2024 | 2023 | ||||||||||||||
| Trading securities | $ | $ | ( | $ | |||||||||||||
| Mortgage loans | ( | ||||||||||||||||
| Investment funds | ( | ||||||||||||||||
| Future policy benefits | ( | ||||||||||||||||
| Other | ( | ||||||||||||||||
| Total gains (losses) | $ | $ | ( | $ | |||||||||||||
Gains and losses on trading securities, mortgage loans, and other are recorded in investment related gains (losses) on the consolidated statements of operations. Gains and losses related to investment funds are recorded in net investment income on the consolidated statements of operations. Gains and losses related to investments of consolidated VIEs are recorded in revenues of consolidated VIEs on the consolidated statements of operations. The change in fair value of future policy benefits is recorded in future policy and other policy benefits on the consolidated statements of operations.
The following summarizes information for fair value option mortgage loans, including related parties and VIEs:
| (In millions) | December 31, 2025 | December 31, 2024 | |||||||||
| Unpaid principal balance | $ | $ | |||||||||
| Mark to fair value | ( | ( | |||||||||
| Fair value | $ | $ | |||||||||
The following represents the commercial mortgage loan portfolio 90 days or more past due and/or in non-accrual status:
| (In millions) | December 31, 2025 | December 31, 2024 | |||||||||
| Unpaid principal balance of commercial mortgage loans 90 days or more past due and/or in non-accrual status | $ | $ | |||||||||
| Mark to fair value of commercial mortgage loans 90 days or more past due and/or in non-accrual status | ( | ( | |||||||||
| Fair value of commercial mortgage loans 90 days or more past due and/or in non-accrual status | $ | $ | |||||||||
| Fair value of commercial mortgage loans 90 days or more past due | $ | $ | |||||||||
| Fair value of commercial mortgage loans in non-accrual status | |||||||||||
205
The following represents the residential mortgage loan portfolio 90 days or more past due and/or in non-accrual status:
| (In millions) | December 31, 2025 | December 31, 2024 | |||||||||
| Unpaid principal balance of residential mortgage loans 90 days or more past due and/or in non-accrual status | $ | $ | |||||||||
| Mark to fair value of residential mortgage loans 90 days or more past due and/or in non-accrual status | ( | ( | |||||||||
| Fair value of residential mortgage loans 90 days or more past due and/or in non-accrual status | $ | $ | |||||||||
Fair value of residential mortgage loans 90 days or more past due1 | $ | $ | |||||||||
| Fair value of residential mortgage loans in non-accrual status | |||||||||||
1 As of December 31, 2025 and December 31, 2024, includes $ | |||||||||||
The following is the estimated amount of gains (losses) included in earnings during the period attributable to changes in instrument-specific credit risk on Athene’s mortgage loan portfolio:
| Years ended December 31, | |||||||||||||||||
| (In millions) | 2025 | 2024 | 2023 | ||||||||||||||
| Mortgage loans | $ | ( | $ | ( | $ | ( | |||||||||||
The portion of gains and losses attributable to changes in instrument-specific credit risk is estimated by identifying commercial mortgage loans with loan-to-value ratios meeting credit quality criteria, and residential mortgage loans with delinquency status meeting credit quality criteria.
206
Fair Value of Financial Instruments Not Carried at Fair Value – Retirement Services
The following represents Athene’s financial instruments not carried at fair value on the consolidated statements of financial condition:
| December 31, 2025 | |||||||||||||||||||||||||||||||||||
| (In millions) | Carrying Value | Fair Value | NAV | Level 1 | Level 2 | Level 3 | |||||||||||||||||||||||||||||
| Financial assets | |||||||||||||||||||||||||||||||||||
| Investment funds | $ | $ | $ | $ | $ | $ | |||||||||||||||||||||||||||||
| Policy loans | |||||||||||||||||||||||||||||||||||
| Funds withheld at interest | |||||||||||||||||||||||||||||||||||
| Short-term investments | |||||||||||||||||||||||||||||||||||
| Other investments | |||||||||||||||||||||||||||||||||||
| Investments in related parties | |||||||||||||||||||||||||||||||||||
| Investment funds | |||||||||||||||||||||||||||||||||||
| Funds withheld at interest | |||||||||||||||||||||||||||||||||||
| Short-term investments | |||||||||||||||||||||||||||||||||||
| Total financial assets not carried at fair value | $ | $ | $ | $ | $ | $ | |||||||||||||||||||||||||||||
| Financial liabilities | |||||||||||||||||||||||||||||||||||
| Interest sensitive contract liabilities | $ | $ | $ | $ | $ | $ | |||||||||||||||||||||||||||||
| Debt | |||||||||||||||||||||||||||||||||||
| Securities to repurchase | |||||||||||||||||||||||||||||||||||
| Funds withheld liability | |||||||||||||||||||||||||||||||||||
| Total financial liabilities not carried at fair value | $ | $ | $ | $ | $ | $ | |||||||||||||||||||||||||||||
| December 31, 2024 | |||||||||||||||||||||||||||||||||||
| (In millions) | Carrying Value | Fair Value | NAV | Level 1 | Level 2 | Level 3 | |||||||||||||||||||||||||||||
| Financial assets | |||||||||||||||||||||||||||||||||||
| Investment funds | $ | $ | $ | $ | $ | $ | |||||||||||||||||||||||||||||
| Policy loans | |||||||||||||||||||||||||||||||||||
| Funds withheld at interest | |||||||||||||||||||||||||||||||||||
| Short-term investments | |||||||||||||||||||||||||||||||||||
| Other investments | |||||||||||||||||||||||||||||||||||
| Investments in related parties | |||||||||||||||||||||||||||||||||||
| Investment funds | |||||||||||||||||||||||||||||||||||
| Funds withheld at interest | |||||||||||||||||||||||||||||||||||
| Short-term investments | |||||||||||||||||||||||||||||||||||
| Total financial assets not carried at fair value | $ | $ | $ | $ | $ | $ | |||||||||||||||||||||||||||||
| Financial liabilities | |||||||||||||||||||||||||||||||||||
| Interest sensitive contract liabilities | $ | $ | $ | $ | $ | $ | |||||||||||||||||||||||||||||
| Debt | |||||||||||||||||||||||||||||||||||
| Securities to repurchase | |||||||||||||||||||||||||||||||||||
| Funds withheld liability | |||||||||||||||||||||||||||||||||||
| Total financial liabilities not carried at fair value | $ | $ | $ | $ | $ | $ | |||||||||||||||||||||||||||||
The fair value for financial instruments not carried at fair value are estimated using the same methods and assumptions as those carried at fair value. The financial instruments presented above are reported at carrying value on the consolidated statements of financial condition; however, in the case of policy loans, funds withheld at interest and liability, short-term investments, and securities to repurchase, the carrying amount approximates fair value.
207
Other investments – Other investments include investments in low-income housing and transferable energy tax credit structures. For those held using the proportional amortization method, the carrying value may include tax credits which have been received but not yet used, which are excluded from the measurement of the fair value estimate of the investment structures. Tax and other future benefits expected to be generated by these structures are valued using a discounted cash flow model.
Interest sensitive contract liabilities – The carrying and fair value of interest sensitive contract liabilities above includes indexed and traditional fixed annuities without mortality or morbidity risks, funding agreements, guaranteed investment contracts and payout annuities without life contingencies. The embedded derivatives within indexed annuities without mortality or morbidity risks are excluded, as they are carried at fair value. The valuation of these investment contracts is based on discounted cash flow methodologies using significant unobservable inputs. The estimated fair value is determined using current market risk-free interest rates, adding a spread to reflect nonperformance risk and subtracting a risk margin to reflect uncertainty inherent in the projected cash flows.
Debt – The fair value of debt is obtained from commercial pricing services. See note 14 for further information on debt.
Significant Unobservable Inputs
Asset Management
Discounted Cash Flow and Direct Capitalization Model
When a discounted cash flow or direct capitalization model is used to determine fair value, the significant input used in the valuation model is the discount rate applied to present value the projected cash flows or the capitalization rate, respectively. Increases in the discount or capitalization rate can significantly lower the fair value of an investment and the contingent consideration obligations; conversely decreases in the discount or capitalization rate can significantly increase the fair value of an investment and the contingent consideration obligations. See note 19 for further discussion of the contingent consideration obligations.
Option Model
When an option model is used to determine fair value, the significant input used in the valuation model is the volatility rate applied to present value the projected cash flows. Increases in the volatility rate can significantly lower the fair value of an investment; conversely decreases in the volatility rate can significantly increase the fair value of an investment.
Consolidated VIEs’ Investments
The significant unobservable inputs used in the fair value measurement of the equity securities, bank loans and bonds are the discount rate and volatility rates applied in the valuation models. These inputs in isolation can cause significant increases or decreases in fair value, which would result in a significantly lower or higher fair value measurement. The discount and volatility rates are determined based on the market rates an investor would expect for a similar investment with similar risks.
NAV
Certain investments and investments of VIEs are valued using the NAV per share equivalent calculated by the investment manager as a practical expedient to determine an independent fair value.
Retirement Services
AFS, trading and equity securities
Athene uses discounted cash flow models to calculate the fair value for certain fixed maturity and equity securities. The discount rate is a significant unobservable input because the credit spread includes adjustments made to the base rate. The base rate represents a market comparable rate for securities with similar characteristics. This excludes assets for which fair value is provided by independent broker quotes.
208
Mortgage loans
Athene uses discounted cash flow models from independent commercial pricing services to calculate the fair value of its mortgage loan portfolio. The discount rate is a significant unobservable input. This approach uses market transaction information and client portfolio-oriented information, such as prepayments or defaults, to support the valuations. For mortgage loans that Athene has entered into an agreement to sell at a specified price, the fair value is based on the estimated proceeds of the sale.
Interest sensitive contract liabilities – embedded derivative
Significant unobservable inputs used in the indexed annuities embedded derivative of the interest sensitive contract liabilities valuation include:
1.Nonperformance risk – For contracts Athene issues, it uses the credit spread, relative to the U.S. Treasury curve based on Athene’s public credit rating as of the valuation date. This represents Athene’s credit risk used in the fair value estimate of embedded derivatives.
2.Option budget – Athene assumes future hedge costs in the derivative’s fair value estimate. The level of option budgets determines the future costs of the options and impacts future policyholder account value growth.
3.Policyholder behavior – Athene regularly reviews the full withdrawal (surrender rate) assumptions. These are based on initial pricing assumptions updated for actual experience. Actual experience may be limited for recently issued products.
Valuation of Underlying Investments
Asset Management
The underlying entities that Apollo manages and invests in are primarily investment companies that account for their investments at estimated fair value.
On a quarterly basis, valuation committees consisting of members from senior management review and approve the valuation results related to the investments of the funds Apollo manages. Apollo also retains external valuation firms for third-party valuation consulting services, which consist of certain limited procedures that management identifies and requests them to perform. The limited procedures provided by the external valuation firms assist management with validating their valuation results or determining fair value. Apollo performs various back-testing procedures to validate its valuation approaches, including comparisons between expected and observed outcomes, forecast evaluations and variance analyses. However, because of the inherent uncertainty of valuation, those estimated values may differ significantly from the values that would have been used had a ready market for the investments existed, and the differences could be material.
Credit Investments
Credit investments are generally valued based on third-party vendor prices and/or quoted market prices and valuation models. Valuations using quoted market prices are based on the average of the “bid” and the “ask” quotes provided by multiple brokers wherever possible without any adjustments. Apollo will designate certain brokers to use to value specific securities. In determining the designated brokers, Apollo considers the following: (1) brokers with which Apollo has previously transacted, (2) the underwriter of the security and (3) active brokers indicating executable quotes. In addition, when valuing a security based on broker quotes wherever possible Apollo tests the standard deviation amongst the quotes received and the variance between the concluded fair value and the value provided by a pricing service. When relying on a third-party vendor as a primary source, Apollo (1) analyzes how the price has moved over the measurement period, (2) reviews the number of brokers included in the pricing service’s population, if available, and (3) validates the valuation levels with Apollo’s pricing team and traders.
Debt securities that are not publicly traded or whose market prices are not readily available are valued at fair value utilizing a model-based approach to determine fair value. Valuation approaches used to estimate the fair value of illiquid credit investments also may include the income approach, as described below. The valuation approaches used consider, as applicable, market risks, credit risks, counterparty risks and foreign currency risks.
209
Equity Investments
The majority of illiquid equity investments are valued using the market approach and/or the income approach, as described below.
Market Approach
The market approach is driven by current market conditions, including actual trading levels of similar companies and, to the extent available, actual transaction data of similar companies. Judgment is required by management when assessing which companies are similar to the subject company being valued. Consideration may also be given to any of the following factors: (1) the subject company’s historical and projected financial data; (2) valuations given to comparable companies; (3) the size and scope of the subject company’s operations; (4) the subject company’s individual strengths and weaknesses; (5) expectations relating to the market’s receptivity to an offering of the subject company’s securities; (6) applicable restrictions on transfer; (7) industry and market information; (8) general economic and market conditions; and (9) other factors deemed relevant. Market approach valuation models typically employ a multiple that is based on one or more of the factors described above.
Enterprise value as a multiple of earnings before interest, taxes, depreciation and amortization (“EBITDA”) is common and relevant for most companies and industries; however, other industry specific multiples are employed where available and appropriate. Sources for gaining additional knowledge related to comparable companies include public filings, annual reports, analyst research reports and press releases. Once a comparable company set is determined, Apollo reviews certain aspects of the subject company’s performance and determines how its performance compares to the group and to certain individuals in the group. Apollo compares certain measurements such as EBITDA margins, revenue growth over certain time periods, leverage ratios and growth opportunities. In addition, Apollo compares the entry multiple and its relation to the comparable set at the time of acquisition to understand its relation to the comparable set on each measurement date.
Income Approach
The income approach provides an indication of fair value based on the present value of cash flows that a business or security is expected to generate in the future. The most widely used methodology for the income approach is a discounted cash flow method. Inherent in the discounted cash flow method are significant assumptions related to the subject company’s expected results, the determination of a terminal value and a calculated discount rate, which is normally based on the subject company’s WACC. The WACC represents the required rate of return on total capitalization, which is comprised of a required rate of return on equity, plus the current tax-effected rate of return on debt, weighted by the relative percentages of equity and debt that are typical in the industry. The most critical step in determining the appropriate WACC for each subject company is to select companies that are comparable in nature to the subject company and the credit quality of the subject company. Sources for gaining additional knowledge about the comparable companies include public filings, annual reports, analyst research reports and press releases. The general formula then used for calculating the WACC considers the after-tax rate of return on debt capital and the rate of return on common equity capital, which further considers the risk-free rate of return, market beta, market risk premium and small stock premium, if applicable. The variables used in the WACC formula are inferred from the comparable market data obtained. The Company evaluates the comparable companies selected and concludes on WACC inputs based on the most comparable company or analyzes the range of data for the investment.
The value of liquid investments, where the primary market is an exchange (whether foreign or domestic), is determined using period end market prices. Such prices are generally based on the close price on the date of determination.
Certain of the funds Apollo manages may also enter into foreign currency exchange contracts, total return swap contracts, credit default swap contracts and other derivative contracts, which may include options, caps, collars and floors. Foreign currency exchange contracts are marked-to-market by recognizing the difference between the contract exchange rate and the current market rate as unrealized appreciation or depreciation. If securities are held at the end of the period, the changes in value are recorded in income as unrealized. Realized gains or losses are recognized when contracts are settled. Total return swap and credit default swap contracts are recorded at fair value as an asset or liability with changes in fair value recorded as unrealized appreciation or depreciation. Realized gains or losses are recognized at the termination of the contract based on the difference between the close-out price of the total return or credit default swap contract and the original contract price. Forward contracts are valued based on market rates obtained from counterparties or prices obtained from recognized financial data service providers.
210
Retirement Services
AFS and trading securities
The fair values for most marketable securities without an active market are obtained from several commercial pricing services. These are classified as Level 2 assets. The pricing services incorporate a variety of market observable information in their valuation techniques, including benchmark yields, trading activity, credit quality, issuer spreads, bids, offers and other reference data. This category typically includes U.S. and non-U.S. corporate bonds, U.S. agency and government guaranteed securities, CLO, ABS, CMBS and RMBS.
Athene also has fixed maturity securities priced based on indicative broker quotes or by employing market accepted valuation models. For certain fixed maturity securities, the valuation model uses significant unobservable inputs and these are included in Level 3 in the fair value hierarchy. Significant unobservable inputs used include discount rates, issue-specific credit adjustments, material non-public financial information, estimation of future earnings and cash flows, default rate assumptions, liquidity assumptions and indicative quotes from market makers.
Privately placed fixed maturity securities are valued based on the credit quality and duration of comparable marketable securities, which may be securities of another issuer with similar characteristics. In some instances, a matrix-based pricing model is used. These models consider the current level of risk-free interest rates, corporate spreads, credit quality of the issuer and cash flow characteristics of the security. Additional factors such as net worth of the borrower, value of collateral, capital structure of the borrower, presence of guarantees and Athene’s evaluation of the borrower’s ability to compete in its relevant market are also considered. Privately placed fixed maturity securities are classified as Level 2 or 3.
Equity securities
Fair values of publicly traded equity securities are based on quoted market prices and classified as Level 1. Other equity securities, typically private equities or equity securities not traded on an exchange, are valued based on other sources, such as commercial pricing services or brokers, and are classified as Level 2 or 3.
Mortgage loans
Athene estimates fair value monthly using discounted cash flow analysis and rates being offered for similar loans to borrowers with similar credit ratings. Loans with similar characteristics are aggregated for purposes of the calculations. The discounted cash flow model uses unobservable inputs, including estimates of discount rates and loan prepayments. For mortgage loans that Athene has entered into an agreement to sell at a specified price, the fair value is based on the agreed upon price. Mortgage loans are classified as Level 3.
Investment funds
Investment funds are typically measured using NAV as a practical expedient in determining fair value and are not classified in the fair value hierarchy. The carrying value reflects a pro rata ownership percentage as indicated by NAV in the investment fund financial statements, which may be adjusted if it is determined NAV is not calculated consistent with investment company fair value principles. The underlying investments of the investment funds may have significant unobservable inputs, which may include but are not limited to, comparable multiples and WACC rates applied in valuation models or a discounted cash flow model.
Certain investment funds for which Athene has elected the fair value option are included in Level 3 and are priced based on market accepted valuation models. The valuation models use significant unobservable inputs, which include material non-public financial information, estimation of future distributable earnings and demographic assumptions.
Other investments
The fair values of other investments are determined using a discounted cash flow model using discount rates for similar investments.
211
Funds withheld at interest embedded derivatives
Funds withheld at interest embedded derivatives represent the right to receive or obligation to pay the total return on the assets supporting the funds withheld at interest or funds withheld liability, respectively, and are analogous to a total return swap with a floating rate leg. The fair value of embedded derivatives on funds withheld and modco agreements is measured as the unrealized gain (loss) on the underlying assets and classified as Level 3.
Derivatives
Derivative contracts can be exchange traded or over the counter. Exchange-traded derivatives typically fall within Level 1 of the fair value hierarchy depending on trading activity. Over-the-counter derivatives are valued using valuation models or an income approach using third-party broker valuations. Valuation models require a variety of inputs, including contractual terms, market prices, yield curves, credit curves, measures of volatility, prepayment rates and correlation of the inputs. Athene considers and incorporates counterparty credit risk in the valuation process through counterparty credit rating requirements and monitoring of overall exposure. Athene also evaluates and includes its own nonperformance risk in valuing derivatives. The majority of Athene’s derivatives trade in liquid markets; therefore, it can verify model inputs and model selection does not involve significant management judgment. These are typically classified within Level 2 of the fair value hierarchy.
Interest sensitive contract liabilities embedded derivatives
Embedded derivatives related to interest sensitive contract liabilities with indexed annuity products are classified as Level 3. The valuations include significant unobservable inputs associated with economic assumptions and actuarial assumptions for policyholder behavior.
AmerUs Closed Block
Athene elected the fair value option for the future policy benefits liability in the AmerUs Closed Block. The valuation technique is to set the fair value of policyholder liabilities equal to the fair value of assets. There is an additional component which captures the fair value of the open block’s obligations to the closed block business. This component is the present value of the projected release of required capital and future earnings before income taxes on required capital supporting the AmerUs Closed Block, discounted at a rate which represents a market participant’s required rate of return, less the initial required capital. Unobservable inputs include estimates for these items. The AmerUs Closed Block policyholder liabilities and any corresponding reinsurance recoverable are classified as Level 3.
ILICO Closed Block
Athene elected the fair value option for the ILICO Closed Block. The valuation technique is to set the fair value of policyholder liabilities equal to the fair value of assets. There is an additional component which captures the fair value of the open block’s obligations to the closed block business. This component uses the present value of future cash flows which include commissions, administrative expenses, reinsurance premiums and benefits, and an explicit cost of capital. The discount rate includes a margin to reflect the business and nonperformance risk. Unobservable inputs include estimates for these items. The ILICO Closed Block policyholder liabilities and corresponding reinsurance recoverable are classified as Level 3.
Universal life liabilities and other life benefits
Athene elected the fair value option for certain blocks of universal and other life business ceded to Global Atlantic. Athene uses a present value of liability cash flows. Unobservable inputs include estimates of mortality, persistency, expenses, premium payments and a risk margin used in the discount rates that reflect the riskiness of the business. The universal life policyholder liabilities and corresponding reinsurance recoverable are classified as Level 3.
212
Other liabilities
Other liabilities include funds withheld liability embedded derivatives, as described above in funds withheld at interest embedded derivatives, and a ceded modco agreement of certain inforce funding agreement contracts for which Athene elected the fair value option. Athene estimates the fair value of the ceded modco agreement by discounting projected cash flows for net settlements and certain periodic and non-periodic payments. Unobservable inputs include estimates for asset portfolio returns and economic inputs used in the discount rate, including risk margin. Depending on the projected cash flows and other assumptions, the contract may be recorded as an asset or liability. The estimate is classified as Level 3.
8. Reinsurance
The following summarizes the effect of reinsurance on premiums and future policy and other policy benefits on the consolidated statements of operations:
| Years ended December 31, | |||||||||||||||||
| (In millions) | 2025 | 2024 | 2023 | ||||||||||||||
| Premiums | |||||||||||||||||
| Direct | $ | $ | $ | ||||||||||||||
| Reinsurance assumed | |||||||||||||||||
| Reinsurance ceded | ( | ( | ( | ||||||||||||||
| Total premiums | $ | $ | $ | ||||||||||||||
| Future policy and other policy benefits | |||||||||||||||||
| Direct | $ | $ | $ | ||||||||||||||
| Reinsurance assumed | |||||||||||||||||
| Reinsurance ceded | ( | ( | ( | ||||||||||||||
| Total future policy and other policy benefits | $ | $ | $ | ||||||||||||||
Reinsurance typically provides for recapture rights on the part of the ceding company for certain events of default. Additionally, some agreements require placement of assets in trust accounts for the benefit of the ceding entity. The required minimum assets are equal to or greater than statutory reserves, as defined by the agreement, and were $33.2 billion and $26.1 billion as of December 31, 2025 and 2024, respectively. Although Athene owns assets placed in trust, their use is restricted based on the trust agreement terms. If the statutory book value of the assets, or in certain cases fair value, in a trust declines because of impairments or other reasons, Athene may be required to contribute additional assets to the trust. In addition, the assets within a trust may be subject to a pledge in favor of the applicable reinsurance company.
Reinsurance Transactions
Athene entered into coinsurance agreements to assume blocks of whole life policies during the fourth quarters of 2025 and 2023. There were no block reinsurance transactions during the year ended December 31, 2024. The following summarizes the block reinsurance agreements at inception:
| Years ended December 31, | |||||||||||
| (In millions) | 2025 | 2023 | |||||||||
| Liabilities assumed | $ | $ | |||||||||
| Less: Assets received | |||||||||||
Deferred profit liability1 | $ | ( | $ | ( | |||||||
1 Included within future policy benefits on the consolidated statements of financial condition. | |||||||||||
In conjunction with the assumed blocks of whole life policies, Athene entered into agreements to retrocede the mortality risk related to these blocks of business on yearly renewable term bases.
213
Catalina
Athene has reinsurance agreements with certain affiliates of Catalina. See note 18 for further information on these reinsurance agreements.
Global Atlantic
Athene has a coinsurance and assumption agreement with Global Atlantic. The agreement ceded all existing open block life insurance business issued by AAIA, with the exception of enhanced guarantee universal life insurance products, to Global Atlantic. Athene also entered into a coinsurance agreement with Global Atlantic to cede all policy liabilities of the ILICO Closed Block. The ILICO Closed Block consists primarily of participating whole life insurance policies. Athene also has an excess of loss arrangement with Global Atlantic requiring Athene to be reimbursed for any payments required from Athene’s general assets to meet the contractual obligations of the AmerUs Closed Block not covered by existing reinsurance through Athene Re USA IV. The AmerUs Closed Block consists primarily of participating whole life insurance policies. Since all liabilities were covered by the existing reinsurance at close, no reinsurance premiums were ceded. The assets backing the AmerUs Closed Block are managed, on AAIA’s behalf, by Goldman Sachs Asset Management.
As of December 31, 2025 and 2024, Global Atlantic maintained a series of trust and custody accounts under the terms of these agreements with assets equal to or greater than a required aggregate statutory balance of $2.5 billion and $2.5 billion, respectively.
Protective Life Insurance Company (“Protective”)
Athene reinsured certain of its life and health business to Protective under a coinsurance agreement. As of December 31, 2025 and 2024, Protective maintained a trust for Athene’s benefit with assets having a fair value of $1.1 billion and $1.1 billion, respectively.
Reinsurance Recoverables
The following summarizes reinsurance recoverable balances:
| (In millions) | December 31, 2025 | December 31, 2024 | |||||||||
| Catalina | $ | $ | |||||||||
| Global Atlantic | |||||||||||
| Protective | |||||||||||
Other1 | |||||||||||
| Reinsurance recoverable | $ | $ | |||||||||
1 Represents all other reinsurers, with no single reinsurer having a carrying value in excess of 5% of the total recoverable. | |||||||||||
214
9. Deferred Acquisition Costs, Deferred Sales Inducements and Value of Business Acquired
The following represents a rollforward of DAC and DSI by product, and a rollforward of VOBA. See note 11 for more information on Athene’s products.
| DAC | DSI | VOBA | Total DAC, DSI and VOBA | ||||||||||||||||||||||||||||||||||||||
| (In millions) | Traditional Deferred Annuities | Indexed Annuities | Funding Agreements | Other Investment-Type and Other | Indexed Annuities | ||||||||||||||||||||||||||||||||||||
Balance at December 31, 2022 | $ | $ | $ | $ | $ | $ | $ | ||||||||||||||||||||||||||||||||||
| Additions | |||||||||||||||||||||||||||||||||||||||||
| Amortization | ( | ( | ( | ( | ( | ( | ( | ||||||||||||||||||||||||||||||||||
| Other | ( | ( | |||||||||||||||||||||||||||||||||||||||
Balance at December 31, 2023 | |||||||||||||||||||||||||||||||||||||||||
| Additions | |||||||||||||||||||||||||||||||||||||||||
| Amortization | ( | ( | ( | ( | ( | ( | ( | ||||||||||||||||||||||||||||||||||
| Other | ( | ( | |||||||||||||||||||||||||||||||||||||||
Balance at December 31, 2024 | |||||||||||||||||||||||||||||||||||||||||
| Additions | |||||||||||||||||||||||||||||||||||||||||
| Amortization | ( | ( | ( | ( | ( | ( | ( | ||||||||||||||||||||||||||||||||||
Balance at December 31, 2025 | $ | $ | $ | $ | $ | $ | $ | ||||||||||||||||||||||||||||||||||
Deferred costs related to universal life-type policies and investment contracts with significant revenue streams from sources other than investment of the policyholder funds, including traditional deferred annuities and indexed annuities, are amortized on a constant-level basis for a cohort of contracts using initial premium or deposit. Significant inputs and assumptions are required for determining the expected duration of the cohort and involves using accepted actuarial methods to determine decrement rates related to policyholder behavior for lapses, withdrawals (surrenders) and mortality. The assumptions used to determine the amortization of DAC and DSI are consistent with those used to estimate the related liability balance.
Deferred costs related to investment contracts without significant revenue streams from sources other than investment of policyholder funds are amortized using the effective interest method, which primarily includes funding agreements. The effective interest method requires inputs to project future cash flows, which for funding agreements includes contractual terms of notional value, periodic interest payments based on either fixed or floating interest rates, and duration. For other investment-type contracts which include immediate annuities and assumed endowments without significant mortality risks, assumptions are required related to policyholder behavior for lapses and withdrawals (surrenders).
The expected amortization of VOBA for the next five years is as follows:
| (In millions) | Expected Amortization | ||||
| 2026 | $ | ||||
| 2027 | |||||
| 2028 | |||||
| 2029 | |||||
| 2030 | |||||
215
10. Goodwill
The following table presents goodwill by segment:
| (In millions) | December 31, 2025 | December 31, 2024 | |||||||||
| Asset Management | $ | $ | |||||||||
Retirement Services1 | |||||||||||
| Principal Investing | |||||||||||
| Total Goodwill | $ | $ | |||||||||
1 Includes the impacts of foreign currency translation. | |||||||||||
In connection with the Bridge acquisition, the Company recorded goodwill of $1.6 billion, which is included within the Asset Management segment. See note 3 for further disclosure regarding the goodwill recorded as a result of the business combination.
11. Long-duration Contracts
Interest sensitive contract liabilities – Interest sensitive contract liabilities primarily include:
▪traditional deferred annuities;
▪indexed annuities consisting of fixed indexed, index-linked variable annuities, and assumed indexed universal life without significant mortality risk;
▪funding agreements; and
▪other investment-type contracts comprising of immediate annuities without significant mortality risk (which includes pension group annuities and structured settlements without life contingencies), guaranteed investment contracts, and assumed endowments without significant mortality risks.
The following represents a rollforward of the policyholder account balance by product within interest sensitive contract liabilities. Where explicit policyholder account balances do not exist, the disaggregated rollforward represents the recorded reserve.
| Year ended December 31, 2025 | |||||||||||||||||||||||||||||
| (In millions, except percentages) | Traditional Deferred Annuities | Indexed Annuities | Funding Agreements | Other Investment-type | Total | ||||||||||||||||||||||||
Balance at December 31, 2024 | $ | $ | $ | $ | $ | ||||||||||||||||||||||||
| Deposits | |||||||||||||||||||||||||||||
| Policy charges | ( | ( | ( | ||||||||||||||||||||||||||
| Surrenders and withdrawals | ( | ( | ( | ( | |||||||||||||||||||||||||
| Benefit payments | ( | ( | ( | ( | ( | ||||||||||||||||||||||||
| Interest credited | |||||||||||||||||||||||||||||
| Foreign exchange | ( | ||||||||||||||||||||||||||||
| Other | ( | ||||||||||||||||||||||||||||
| Balance at December 31, 2025 | $ | $ | $ | $ | $ | ||||||||||||||||||||||||
| Weighted average crediting rate | % | % | % | % | |||||||||||||||||||||||||
| Net amount at risk | $ | $ | $ | $ | |||||||||||||||||||||||||
| Cash surrender value | |||||||||||||||||||||||||||||
216
| Year ended December 31, 2024 | |||||||||||||||||||||||||||||
| (In millions, except percentages) | Traditional Deferred Annuities | Indexed Annuities | Funding Agreements | Other Investment-type | Total | ||||||||||||||||||||||||
Balance at December 31, 2023 | $ | $ | $ | $ | $ | ||||||||||||||||||||||||
| Deposits | |||||||||||||||||||||||||||||
| Policy charges | ( | ( | ( | ||||||||||||||||||||||||||
| Surrenders and withdrawals | ( | ( | ( | ( | |||||||||||||||||||||||||
| Benefit payments | ( | ( | ( | ( | ( | ||||||||||||||||||||||||
| Interest credited | |||||||||||||||||||||||||||||
| Foreign exchange | ( | ( | ( | ( | ( | ||||||||||||||||||||||||
| Other | ( | ||||||||||||||||||||||||||||
| Balance at December 31, 2024 | $ | $ | $ | $ | $ | ||||||||||||||||||||||||
| Weighted average crediting rate | % | % | % | % | |||||||||||||||||||||||||
| Net amount at risk | $ | $ | $ | $ | |||||||||||||||||||||||||
| Cash surrender value | |||||||||||||||||||||||||||||
| Year ended December 31, 2023 | |||||||||||||||||||||||||||||
| (In millions, except percentages) | Traditional Deferred Annuities | Indexed Annuities | Funding Agreements | Other Investment-type | Total | ||||||||||||||||||||||||
Balance at December 31, 2022 | $ | $ | $ | $ | $ | ||||||||||||||||||||||||
| Deposits | |||||||||||||||||||||||||||||
| Policy charges | ( | ( | ( | ||||||||||||||||||||||||||
| Surrenders and withdrawals | ( | ( | ( | ( | ( | ||||||||||||||||||||||||
| Benefit payments | ( | ( | ( | ( | ( | ||||||||||||||||||||||||
| Interest credited | |||||||||||||||||||||||||||||
| Foreign exchange | ( | ||||||||||||||||||||||||||||
Other1 | ( | ( | |||||||||||||||||||||||||||
| Balance at December 31, 2023 | $ | $ | $ | $ | $ | ||||||||||||||||||||||||
| Weighted average crediting rate | % | % | % | % | |||||||||||||||||||||||||
| Net amount at risk | $ | $ | $ | $ | |||||||||||||||||||||||||
| Cash surrender value | |||||||||||||||||||||||||||||
1Other includes a $ | |||||||||||||||||||||||||||||
The following is a reconciliation of interest sensitive contract liabilities to the consolidated statements of financial condition:
| December 31, | |||||||||||||||||
| (In millions) | 2025 | 2024 | 2023 | ||||||||||||||
| Traditional deferred annuities | $ | $ | $ | ||||||||||||||
| Indexed annuities | |||||||||||||||||
| Funding agreements | |||||||||||||||||
| Other investment-type | |||||||||||||||||
Reconciling items1 | |||||||||||||||||
| Interest sensitive contract liabilities | $ | $ | $ | ||||||||||||||
1 Reconciling items primarily include embedded derivatives in indexed annuities, unaccreted host contract adjustments on indexed annuities, negative VOBA, sales inducement liabilities, and wholly ceded universal life insurance contracts. | |||||||||||||||||
217
The following represents policyholder account balances by range of guaranteed minimum crediting rates (“GMCR”), as well as the related range of the difference between rates being credited to policyholders and the respective guaranteed minimums. Athene’s funding agreements and other investment-type products provide Athene with little to no discretionary ability to change the rates of interest payable to the respective policyholder or institution and, as a result, those policyholder account balances are excluded from the following tables.
| December 31, 2025 | |||||||||||||||||||||||
| (In millions) | At Guaranteed Minimum | Greater than | Total | ||||||||||||||||||||
| Traditional deferred annuities | |||||||||||||||||||||||
< | $ | $ | $ | $ | |||||||||||||||||||
| Total traditional deferred annuities | $ | $ | $ | $ | |||||||||||||||||||
| Indexed annuities | |||||||||||||||||||||||
< | $ | $ | $ | $ | |||||||||||||||||||
| Total indexed annuities with GMCR | |||||||||||||||||||||||
Other1 | |||||||||||||||||||||||
| Total indexed annuities | $ | ||||||||||||||||||||||
1 Includes account value allocated to an indexed strategy or other amounts without a GMCR. | |||||||||||||||||||||||
| December 31, 2024 | |||||||||||||||||||||||
| (In millions) | At Guaranteed Minimum | Greater than | Total | ||||||||||||||||||||
| Traditional deferred annuities | |||||||||||||||||||||||
< | $ | $ | $ | $ | |||||||||||||||||||
| Total traditional deferred annuities | $ | $ | $ | $ | |||||||||||||||||||
| Indexed annuities | |||||||||||||||||||||||
< | $ | $ | $ | $ | |||||||||||||||||||
| Total indexed annuities with GMCR | |||||||||||||||||||||||
Other1 | |||||||||||||||||||||||
| Total indexed annuities | $ | ||||||||||||||||||||||
1 Includes account value allocated to an indexed strategy or other amounts without a GMCR. | |||||||||||||||||||||||
Note: The amounts presented in this table have been revised to conform with the current year presentation to provide certain product-level detail and account value allocated to an indexed strategy or other amounts without a GMCR. | |||||||||||||||||||||||
218
| December 31, 2023 | |||||||||||||||||||||||
| (In millions) | At Guaranteed Minimum | Greater than | Total | ||||||||||||||||||||
| Traditional deferred annuities | |||||||||||||||||||||||
< | $ | $ | $ | $ | |||||||||||||||||||
| Total traditional deferred annuities | $ | $ | $ | $ | |||||||||||||||||||
| Indexed annuities | |||||||||||||||||||||||
< | $ | $ | $ | $ | |||||||||||||||||||
| Total indexed annuities with GMCR | |||||||||||||||||||||||
Other1 | |||||||||||||||||||||||
| Total indexed annuities | $ | ||||||||||||||||||||||
1 Includes account value allocated to an indexed strategy or other amounts without a GMCR. | |||||||||||||||||||||||
Note: The amounts presented in this table have been revised to conform with the current year presentation to provide certain product-level detail and account value allocated to an indexed strategy or other amounts without a GMCR. | |||||||||||||||||||||||
219
Future policy benefits – Future policy benefits consist primarily of payout annuities, including single premium immediate annuities with life contingencies (which include pension group annuities and structured settlements with life contingencies), and whole life insurance contracts.
The following is a rollforward by product within future policy benefits:
| Year ended December 31, 2025 | |||||||||||||||||
| (In millions, except percentages and years) | Payout Annuities with Life Contingencies | Whole Life | Total | ||||||||||||||
| Present value of expected net premiums | |||||||||||||||||
| Beginning balance, present value of expected net premiums | $ | $ | $ | ||||||||||||||
| Effect of changes in discount rate assumptions | ( | ( | |||||||||||||||
| Effect of foreign exchange on the change in discount rate assumptions | |||||||||||||||||
| Beginning balance at original discount rate | |||||||||||||||||
| Effect of changes in cash flow assumptions | |||||||||||||||||
| Effect of actual to expected experience | ( | ( | |||||||||||||||
| Adjusted balance | |||||||||||||||||
| Issuances | |||||||||||||||||
| Interest accrual | |||||||||||||||||
| Net premium collected | ( | ( | |||||||||||||||
| Foreign exchange | |||||||||||||||||
| Other | |||||||||||||||||
| Ending balance at original discount rate | |||||||||||||||||
| Effect of changes in discount rate assumptions | |||||||||||||||||
| Effect of foreign exchange on the change in discount rate assumptions | ( | ( | |||||||||||||||
| Ending balance, present value of expected net premiums | $ | $ | $ | ||||||||||||||
| Present value of expected future policy benefits | |||||||||||||||||
| Beginning balance, present value of expected future policy benefits | $ | $ | $ | ||||||||||||||
| Effect of changes in discount rate assumptions | |||||||||||||||||
| Effect of foreign exchange on the change in discount rate assumptions | ( | ( | ( | ||||||||||||||
| Beginning balance at original discount rate | |||||||||||||||||
| Effect of changes in cash flow assumptions | ( | ||||||||||||||||
| Effect of actual to expected experience | ( | ( | ( | ||||||||||||||
| Adjusted balance | |||||||||||||||||
| Issuances | |||||||||||||||||
| Interest accrual | |||||||||||||||||
| Benefit payments | ( | ( | ( | ||||||||||||||
| Foreign exchange | |||||||||||||||||
| Other | |||||||||||||||||
| Ending balance at original discount rate | |||||||||||||||||
| Effect of changes in discount rate assumptions | ( | ( | ( | ||||||||||||||
| Effect of foreign exchange on the change in discount rate assumptions | ( | ||||||||||||||||
| Ending balance, present value of expected future policy benefits | |||||||||||||||||
| Less: Present value of expected net premiums | |||||||||||||||||
| Net future policy benefits | $ | $ | $ | ||||||||||||||
Weighted-average liability duration (in years) | |||||||||||||||||
| Weighted-average interest accretion rate | % | % | |||||||||||||||
| Weighted-average current discount rate | % | % | |||||||||||||||
| Expected future gross premiums, undiscounted | $ | $ | |||||||||||||||
Expected future gross premiums, discounted1 | |||||||||||||||||
| Expected future benefit payments, undiscounted | |||||||||||||||||
1 Discounted at the original discount rate. | |||||||||||||||||
220
| Year ended December 31, 2024 | |||||||||||||||||
| (In millions, except percentages and years) | Payout Annuities with Life Contingencies | Whole Life | Total | ||||||||||||||
| Present value of expected net premiums | |||||||||||||||||
| Beginning balance, present value of expected net premiums | $ | $ | $ | ||||||||||||||
| Effect of changes in discount rate assumptions | ( | ( | |||||||||||||||
| Effect of foreign exchange on the change in discount rate assumptions | ( | ( | |||||||||||||||
| Beginning balance at original discount rate | |||||||||||||||||
| Effect of actual to expected experience | ( | ( | |||||||||||||||
| Adjusted balance | |||||||||||||||||
| Interest accrual | |||||||||||||||||
| Net premium collected | ( | ( | |||||||||||||||
| Foreign exchange | ( | ( | |||||||||||||||
| Ending balance at original discount rate | |||||||||||||||||
| Effect of changes in discount rate assumptions | |||||||||||||||||
| Effect of foreign exchange on the change in discount rate assumptions | ( | ( | |||||||||||||||
| Ending balance, present value of expected net premiums | $ | $ | $ | ||||||||||||||
| Present value of expected future policy benefits | |||||||||||||||||
| Beginning balance, present value of expected future policy benefits | $ | $ | $ | ||||||||||||||
| Effect of changes in discount rate assumptions | ( | ||||||||||||||||
| Effect of foreign exchange on the change in discount rate assumptions | ( | ( | |||||||||||||||
| Beginning balance at original discount rate | |||||||||||||||||
| Effect of changes in cash flow assumptions | ( | ( | |||||||||||||||
| Effect of actual to expected experience | ( | ||||||||||||||||
| Adjusted balance | |||||||||||||||||
| Issuances | |||||||||||||||||
| Interest accrual | |||||||||||||||||
| Benefit payments | ( | ( | ( | ||||||||||||||
| Foreign exchange | ( | ( | ( | ||||||||||||||
| Ending balance at original discount rate | |||||||||||||||||
| Effect of changes in discount rate assumptions | ( | ( | ( | ||||||||||||||
| Effect of foreign exchange on the change in discount rate assumptions | |||||||||||||||||
| Ending balance, present value of expected future policy benefits | |||||||||||||||||
| Less: Present value of expected net premiums | |||||||||||||||||
| Net future policy benefits | $ | $ | $ | ||||||||||||||
Weighted-average liability duration (in years) | |||||||||||||||||
| Weighted-average interest accretion rate | % | % | |||||||||||||||
| Weighted-average current discount rate | % | % | |||||||||||||||
| Expected future gross premiums, undiscounted | $ | $ | |||||||||||||||
Expected future gross premiums, discounted1 | |||||||||||||||||
| Expected future benefit payments, undiscounted | |||||||||||||||||
1 Discounted at the original discount rate. | |||||||||||||||||
221
| Year ended December 31, 2023 | |||||||||||||||||
| (In millions, except percentages and years) | Payout Annuities with Life Contingencies | Whole Life | Total | ||||||||||||||
| Present value of expected net premiums | |||||||||||||||||
| Beginning balance, present value of expected net premiums | $ | $ | $ | ||||||||||||||
| Issuances | |||||||||||||||||
| Interest accrual | |||||||||||||||||
| Net premium collected | ( | ( | |||||||||||||||
| Foreign exchange | |||||||||||||||||
| Ending balance at original discount rate | |||||||||||||||||
| Effect of changes in discount rate assumptions | |||||||||||||||||
| Effect of foreign exchange on the change in discount rate assumptions | |||||||||||||||||
| Ending balance, present value of expected net premiums | $ | $ | $ | ||||||||||||||
| Present value of expected future policy benefits | |||||||||||||||||
| Beginning balance, present value of expected future policy benefits | $ | $ | $ | ||||||||||||||
| Effect of changes in discount rate assumptions | |||||||||||||||||
| Effect of foreign exchange on the change in discount rate assumptions | ( | ( | |||||||||||||||
| Beginning balance at original discount rate | |||||||||||||||||
| Effect of changes in cash flow assumptions | ( | ( | |||||||||||||||
| Effect of actual to expected experience | ( | ( | |||||||||||||||
| Adjusted balance | |||||||||||||||||
| Issuances | |||||||||||||||||
| Interest accrual | |||||||||||||||||
| Benefit payments | ( | ( | ( | ||||||||||||||
| Foreign exchange | |||||||||||||||||
Other1 | ( | ( | |||||||||||||||
| Ending balance at original discount rate | |||||||||||||||||
| Effect of changes in discount rate assumptions | ( | ( | |||||||||||||||
| Effect of foreign exchange on the change in discount rate assumptions | ( | ||||||||||||||||
| Ending balance, present value of expected future policy benefits | |||||||||||||||||
| Less: Present value of expected net premiums | |||||||||||||||||
| Net future policy benefits | $ | $ | $ | ||||||||||||||
Weighted-average liability duration (in years) | |||||||||||||||||
| Weighted-average interest accretion rate | % | % | |||||||||||||||
| Weighted-average current discount rate | % | % | |||||||||||||||
| Expected future gross premiums, undiscounted | $ | $ | |||||||||||||||
Expected future gross premiums, discounted2 | |||||||||||||||||
| Expected future benefit payments, undiscounted | |||||||||||||||||
1 Other includes a $ | |||||||||||||||||
2 Discounted at the original discount rate. | |||||||||||||||||
222
The following is a reconciliation of future policy benefits to the consolidated statements of financial condition:
| December 31, | |||||||||||||||||
| (In millions) | 2025 | 2024 | 2023 | ||||||||||||||
| Payout annuities with life contingencies | $ | $ | $ | ||||||||||||||
| Whole life | |||||||||||||||||
Reconciling items1 | |||||||||||||||||
| Future policy benefits | $ | $ | $ | ||||||||||||||
1 Reconciling items primarily include the deferred profit liability and negative VOBA associated with the liability for future policy benefits. Additionally, it includes term life reserves, fully ceded whole life reserves, and reserves for immaterial lines of business including accident and health and disability, as well as other insurance benefit reserves for no-lapse guarantees with universal life contracts, all of which are fully ceded. | |||||||||||||||||
The following is a reconciliation of premiums and interest expense relating to future policy benefits to the consolidated statements of operations:
| Premiums | |||||||||||||||||
| Years ended December 31, | |||||||||||||||||
| (In millions) | 2025 | 2024 | 2023 | ||||||||||||||
| Payout annuities with life contingencies | $ | $ | $ | ||||||||||||||
| Whole life | |||||||||||||||||
Reconciling items1 | |||||||||||||||||
| Total premiums | $ | $ | $ | ||||||||||||||
| Interest Expense | |||||||||||||||||
| Years ended December 31, | |||||||||||||||||
| (In millions) | 2025 | 2024 | 2023 | ||||||||||||||
| Payout annuities with life contingencies | $ | $ | $ | ||||||||||||||
| Whole life | |||||||||||||||||
Total interest expense | $ | $ | $ | ||||||||||||||
1 Reconciling items primarily relate to immaterial lines of business including term life, fully ceded whole life, and accident and health and disability. | |||||||||||||||||
Significant assumptions and inputs to the calculation of future policy benefits for payout annuities with life contingencies include policyholder demographic data, assumptions for policyholder longevity and policyholder utilization for contracts with deferred lives, and discount rates. For whole life products, significant assumptions and inputs include policyholder demographic data, assumptions for mortality, morbidity, and lapse and discount rates.
Athene bases certain key assumptions related to policyholder behavior on industry standard data adjusted to align with actual company experience, if necessary. At least annually, Athene reviews all significant cash flow assumptions and updates as necessary, unless emerging experience indicates a more frequent review is necessary. The discount rate reflects market observable inputs from upper-medium grade fixed income instrument yields and is interpolated, where necessary, to conform to the duration of Athene’s liabilities.
During the year ended December 31, 2025, the present value of expected future policy benefits increased by $881 million, which was driven by $2,909 million of issuances, $1,824 million of interest accrual, a $612 million change in discount rate assumptions related to a decrease in market observable rates and a $67 million change in foreign exchange, partially offset by $4,555 million of benefit payments.
During the year ended December 31, 2024, the present value of expected future policy benefits decreased by $3,400 million, which was driven by $4,561 million of benefit payments, a $1,440 million change in discount rate assumptions due to an increase in rates, and a $356 million change in foreign exchange, partially offset by $1,871 million of interest accrual and $1,115 million of issuances, primarily pension group annuities.
223
During the year ended December 31, 2023, the present value of expected future policy benefits increased by $11,950 million, which was driven by $13,518 million of issuances, primarily pension group annuities, a $2,236 million change in discount rate assumptions related to a decrease in rates, and $1,664 million of interest accrual, partially offset by $3,852 million of benefit payments, a $1,509 million reduction in reserve related to recapture, and $297 million related to the effect of changes in cash flow assumptions.
The following is a summary of remeasurement gains (losses) included within future policy and other policy benefits on the consolidated statements of operations:
| Years ended December 31, | |||||||||||||||||
| (In millions) | 2025 | 2024 | 2023 | ||||||||||||||
| Reserves | $ | $ | $ | ||||||||||||||
| Deferred profit liability | ( | ( | ( | ||||||||||||||
| Negative VOBA | ( | ||||||||||||||||
| Total remeasurement gains (losses) | $ | $ | $ | ||||||||||||||
During the years ended December 31, 2025, 2024 and 2023, Athene recorded reserve increases of $73 million, $15 million and $136 million, respectively, on the consolidated statements of operations as a result of the present value of benefits and expenses exceeding the present value of gross premiums.
Market risk benefits – Athene issues and reinsures traditional deferred and indexed annuity products that contain GLWB and GMDB riders that meet the criteria to be classified as market risk benefits.
The following is a rollforward of net market risk benefit liabilities by product:
| Year ended December 31, 2025 | |||||||||||||||||
| (In millions, except years) | Traditional Deferred Annuities | Indexed Annuities | Total | ||||||||||||||
Balance at December 31, 2024 | $ | $ | $ | ||||||||||||||
| Effect of changes in instrument-specific credit risk | ( | ( | ( | ||||||||||||||
| Balance, beginning of period, before changes in instrument-specific credit risk | |||||||||||||||||
| Issuances | |||||||||||||||||
| Interest accrual | |||||||||||||||||
| Attributed fees collected | |||||||||||||||||
| Benefit payments | ( | ( | ( | ||||||||||||||
| Effect of changes in interest rates | |||||||||||||||||
| Effect of changes in equity | ( | ( | |||||||||||||||
| Effect of actual policyholder behavior compared to expected behavior | |||||||||||||||||
| Effect of changes in future expected policyholder behavior | ( | ( | ( | ||||||||||||||
| Effect of changes in other future expected assumptions | ( | ( | |||||||||||||||
| Balance, end of period, before changes in instrument-specific credit risk | |||||||||||||||||
| Effect of changes in instrument-specific credit risk | |||||||||||||||||
Balance at December 31, 2025 | |||||||||||||||||
| Less: Reinsurance recoverable | |||||||||||||||||
Balance at December 31, 2025, net of reinsurance | $ | $ | $ | ||||||||||||||
| Net amount at risk | $ | $ | |||||||||||||||
Weighted-average attained age of contract holders (in years) | |||||||||||||||||
224
| Year ended December 31, 2024 | |||||||||||||||||
| (In millions, except years) | Traditional Deferred Annuities | Indexed Annuities | Total | ||||||||||||||
Balance at December 31, 2023 | $ | $ | $ | ||||||||||||||
| Effect of changes in instrument-specific credit risk | ( | ( | |||||||||||||||
| Balance, beginning of period, before changes in instrument-specific credit risk | |||||||||||||||||
| Issuances | |||||||||||||||||
| Interest accrual | |||||||||||||||||
| Attributed fees collected | |||||||||||||||||
| Benefit payments | ( | ( | ( | ||||||||||||||
| Effect of changes in interest rates | ( | ( | ( | ||||||||||||||
| Effect of changes in equity | ( | ( | |||||||||||||||
| Effect of actual policyholder behavior compared to expected behavior | |||||||||||||||||
| Effect of changes in future expected policyholder behavior | ( | ||||||||||||||||
| Effect of changes in other future expected assumptions | ( | ( | |||||||||||||||
| Balance, end of period, before changes in instrument-specific credit risk | |||||||||||||||||
| Effect of changes in instrument-specific credit risk | |||||||||||||||||
Balance at December 31, 2024 | |||||||||||||||||
| Less: Reinsurance recoverable | |||||||||||||||||
Balance at December 31, 2024, net of reinsurance | $ | $ | $ | ||||||||||||||
| Net amount at risk | $ | $ | |||||||||||||||
Weighted-average attained age of contract holders (in years) | |||||||||||||||||
| Year ended December 31, 2023 | |||||||||||||||||
| (In millions, except years) | Traditional Deferred Annuities | Indexed Annuities | Total | ||||||||||||||
Balance at December 31, 2022 | $ | $ | $ | ||||||||||||||
| Effect of changes in instrument-specific credit risk | |||||||||||||||||
| Balance, beginning of period, before changes in instrument-specific credit risk | |||||||||||||||||
| Issuances | |||||||||||||||||
| Interest accrual | |||||||||||||||||
| Attributed fees collected | |||||||||||||||||
| Benefit payments | ( | ( | ( | ||||||||||||||
| Effect of changes in interest rates | ( | ( | ( | ||||||||||||||
| Effect of changes in equity | ( | ( | |||||||||||||||
| Effect of actual policyholder behavior compared to expected behavior | |||||||||||||||||
| Effect of changes in future expected policyholder behavior | ( | ||||||||||||||||
| Effect of changes in other future expected assumptions | |||||||||||||||||
| Balance, end of period, before changes in instrument-specific credit risk | |||||||||||||||||
| Effect of changes in instrument-specific credit risk | ( | ||||||||||||||||
Balance at December 31, 2023 | $ | $ | $ | ||||||||||||||
| Net amount at risk | $ | $ | |||||||||||||||
Weighted-average attained age of contract holders (in years) | |||||||||||||||||
225
The following is a reconciliation of market risk benefits to the consolidated statements of financial condition. Market risk benefit assets are included in other assets on the consolidated statements of financial condition.
| December 31, 2025 | |||||||||||||||||
| (In millions) | Asset | Liability | Net Liability | ||||||||||||||
| Traditional deferred annuities | $ | $ | $ | ||||||||||||||
| Indexed annuities | |||||||||||||||||
| Total | $ | $ | $ | ||||||||||||||
| December 31, 2024 | |||||||||||||||||
| (In millions) | Asset | Liability | Net Liability | ||||||||||||||
| Traditional deferred annuities | $ | $ | $ | ||||||||||||||
| Indexed annuities | |||||||||||||||||
| Total | $ | $ | $ | ||||||||||||||
| December 31, 2023 | |||||||||||||||||
| (In millions) | Asset | Liability | Net Liability | ||||||||||||||
| Traditional deferred annuities | $ | $ | $ | ||||||||||||||
| Indexed annuities | |||||||||||||||||
| Total | $ | $ | $ | ||||||||||||||
During the year ended December 31, 2025, net market risk benefit liabilities increased by $1,001 million, which was primarily driven by $429 million of issuances, $396 million in fees collected from policyholders, $191 million of interest accrual, and a $103 million change in instrument-specific credit risk related to tightening of credit spreads, partially offset by a decrease of $112 million related to equity market performance, $70 million of benefit payments and a decrease of $43 million related to the effect of changes in future expected policyholder behavior.
During the year ended December 31, 2024, net market risk benefit liabilities increased by $342 million, which was primarily driven by $360 million in fees collected from policyholders, issuances of $295 million, $201 million of interest accrual, and a $149 million change in instrument-specific credit risk related to tightening of credit spreads, partially offset by a decrease of $658 million related to changes in the risk-free discount rate across the curve.
During the year ended December 31, 2023, net market risk benefit liabilities increased by $884 million, which was primarily driven by $338 million in fees collected from policyholders, a $374 million change in instrument-specific credit risk related to tightening of credit spreads, $157 million of interest accrual, and issuances of $106 million, partially offset by $119 million of changes related to equity market performance and a decrease of $91 million related to changes in the risk-free discount rate across the curve.
The determination of the fair value of market risk benefits requires the use of inputs related to fees and assessments and assumptions in determining the projected benefits in excess of the projected account balance. Judgment is required for both economic and actuarial assumptions, which can be either observable or unobservable, that impact future policyholder account growth.
Economic assumptions include interest rates and implied volatilities throughout the duration of the liability. For indexed annuities, assumptions also include projected equity returns which impact cash flows attributable to indexed strategies, implied equity volatilities, expected index credits on the next policy anniversary date and future equity option costs. Assumptions related to the level of option budgets used for determining the future equity option costs and the impact on future policyholder account value growth are considered unobservable inputs.
Policyholder behavior assumptions are unobservable inputs and are established using accepted actuarial valuation methods to estimate withdrawals (surrender rate) and income rider utilization. Assumptions are generally based on industry data and pricing assumptions which are updated for actual experience, if necessary. Actual experience may be limited for recently issued products.
226
All inputs are used to project excess benefits and fees over a range of risk-neutral, stochastic interest rate scenarios. For indexed annuities, stochastic equity return scenarios are also included within the range. A risk margin is incorporated within the discount rate to reflect uncertainty in the projected cash flows such as variations in policyholder behavior, as well as a credit spread to reflect nonperformance risk, which is considered an unobservable input. Athene uses its public credit rating relative to the U.S. Treasury curve as of the valuation date to reflect its nonperformance risk in the fair value estimate of market risk benefits.
The following summarizes the unobservable inputs for market risk benefits:
| December 31, 2025 | |||||||||||||||||||||||||||||||||||||||||||||||
| (In millions, except percentages) | Fair Value | Valuation Technique | Unobservable Inputs | Minimum | Maximum | Weighted Average | Impact of an Increase in the Input on Fair Value | ||||||||||||||||||||||||||||||||||||||||
| Market risk benefits, net | $ | Discounted cash flow | Nonperformance risk | % | % | % | 1 | Decrease | |||||||||||||||||||||||||||||||||||||||
| Option budget | % | % | % | 2 | Decrease | ||||||||||||||||||||||||||||||||||||||||||
| Surrender rate | % | % | % | 2 | Decrease | ||||||||||||||||||||||||||||||||||||||||||
| Utilization rate | % | % | % | 3 | Increase | ||||||||||||||||||||||||||||||||||||||||||
| December 31, 2024 | |||||||||||||||||||||||||||||||||||||||||||||||
| (In millions, except percentages) | Fair Value | Valuation Technique | Unobservable Inputs | Minimum | Maximum | Weighted Average | Impact of an Increase in the Input on Fair Value | ||||||||||||||||||||||||||||||||||||||||
| Market risk benefits, net | $ | Discounted cash flow | Nonperformance risk | % | % | % | 1 | Decrease | |||||||||||||||||||||||||||||||||||||||
| Option budget | % | % | % | 2 | Decrease | ||||||||||||||||||||||||||||||||||||||||||
| Surrender rate | % | % | % | 2 | Decrease | ||||||||||||||||||||||||||||||||||||||||||
| Utilization rate | % | % | % | 3 | Increase | ||||||||||||||||||||||||||||||||||||||||||
| December 31, 2023 | |||||||||||||||||||||||||||||||||||||||||||||||
| (In millions, except percentages) | Fair Value | Valuation Technique | Unobservable Inputs | Minimum | Maximum | Weighted Average | Impact of an Increase in the Input on Fair Value | ||||||||||||||||||||||||||||||||||||||||
| Market risk benefits, net | $ | Discounted cash flow | Nonperformance risk | % | % | % | 1 | Decrease | |||||||||||||||||||||||||||||||||||||||
| Option budget | % | % | % | 2 | Decrease | ||||||||||||||||||||||||||||||||||||||||||
| Surrender rate | % | % | % | 2 | Decrease | ||||||||||||||||||||||||||||||||||||||||||
| Utilization rate | % | % | % | 3 | Increase | ||||||||||||||||||||||||||||||||||||||||||
1 The nonperformance risk weighted average is based on the cash flows underlying the market risk benefit reserve. | |||||||||||||||||||||||||||||||||||||||||||||||
2 The option budget and surrender rate weighted averages are calculated based on projected account values. | |||||||||||||||||||||||||||||||||||||||||||||||
3 The utilization of GLWB withdrawals represents the estimated percentage of policyholders that are expected to use their income rider over the duration of the contract, with the weighted average based on current account values. | |||||||||||||||||||||||||||||||||||||||||||||||
227
12. Profit Sharing Payable
Profit sharing payable, and those of consolidated VIEs, are recorded within accounts payable, accrued expenses, and other liabilities, and accounts payable, accrued expenses, and other liabilities of consolidated VIEs, respectively, in the consolidated statements of financial condition. The below is a roll-forward of the profit-sharing payable balance:
| (In millions) | Total | ||||
Profit sharing payable, January 1, 2024 | $ | ||||
| Profit sharing expense | |||||
| Payments/other | ( | ||||
Profit sharing payable, December 31, 2024 | |||||
| Profit sharing expense | |||||
Payments/other1 | ( | ||||
Profit sharing payable, December 31, 2025 | $ | ||||
1 Other includes profit sharing payable related to the Bridge acquisition during the third quarter of 2025. | |||||
Profit sharing expense includes (1) changes in amounts due to current and former employees entitled to a share of performance revenues in funds managed by Apollo and (2) changes to the fair value of the contingent consideration obligations recognized in connection with certain of the Company’s acquisitions. Profit sharing payable excludes the potential return of profit-sharing distributions that would be due if certain funds were liquidated, which is recorded in due from related parties in the consolidated statements of financial condition.
The Company requires that a portion of certain of the performance revenues distributed to the Company’s employees be used to purchase restricted shares of common stock issued under its Equity Plan. Prior to distribution of the performance revenues, the Company records the value of the equity-based awards expected to be granted in other assets and accounts payable, accrued expenses, and other liabilities.
13. Income Taxes
The Company’s income tax (provision) benefit totaled $(1,276 ) million, $(1,062 ) million and $923 million for the years ended December 31, 2025, 2024 and 2023, respectively. The Company’s effective income tax rate was approximately 19.1 %, 14.3 % and (16.5 )% for the years ended December 31, 2025, 2024 and 2023, respectively.
The provision (benefit) for income taxes is presented in the following table:
| Years ended December 31, | |||||||||||||||||
| (In millions) | 2025 | 2024 | 2023 | ||||||||||||||
| Current | |||||||||||||||||
Federal income tax1 | $ | $ | $ | ||||||||||||||
Foreign income tax2 | |||||||||||||||||
| State and local income tax | |||||||||||||||||
| $ | $ | $ | |||||||||||||||
| Deferred | |||||||||||||||||
Federal income tax1 | ( | ||||||||||||||||
Foreign income tax2 | ( | ( | |||||||||||||||
| State and local income tax | |||||||||||||||||
| ( | ( | ||||||||||||||||
| Total Income Tax Provision (Benefit) | $ | $ | $ | ( | |||||||||||||
1 For the years ended December 31, 2025, 2024 and 2023, income tax provision (benefit) includes proportional amortization of $ | |||||||||||||||||
2 The foreign income tax provision (benefit) was calculated on $ | |||||||||||||||||
228
On July 4, 2025, the U.S. government enacted H.R. 1, which includes several tax-related provisions. The Company has evaluated the enacted legislation and concluded that it does not have a material impact on our consolidated financial statements.
In addition, the U.S. Department of the Treasury and the Internal Revenue Service have issued, and may continue to issue, regulatory guidance under the current administration related to previously enacted tax legislation, including interpretive guidance and notices related to CAMT. The Company has evaluated such guidance as issued to date and, based on its interpretations and assumptions, has reflected the impact of applicable guidance in its income tax provision. The guidance issued to date is not expected to have a material impact on the Company’s effective tax rate or consolidated financial statements. The Company will continue to monitor future guidance and rulemaking and will record any resulting impacts in the period such guidance is issued or becomes effective, as applicable.
The U.K. enacted legislation in July 2023 implementing certain provisions of the Organisation for Economic Cooperation and Development’s “Pillar Two” global minimum tax initiative that applies to multinational enterprises for accounting periods beginning on or after December 31, 2023. On February 22, 2024, the U.K. enacted certain amendments to its Pillar Two legislation which similarly took effect for accounting periods beginning on or after December 31, 2024. The Company continues to evaluate the potential impact on future periods of Pillar Two, pending legislative adoption by individual countries, as such legislative changes could result in changes to our effective tax rate. The Company evaluated the enacted legislation and concluded there was no material impact to our consolidated financial statements for the year ended December 31, 2025.
On December 27, 2023, the Government of Bermuda enacted the Bermuda CIT in response to the OECD’s Pillar Two initiative. Commencing on January 1, 2025, the Bermuda CIT generally imposed a 15% corporate income tax on in-scope entities that are resident in Bermuda or have a Bermuda permanent establishment, without regard to any assurances that were given pursuant to the Exempted Undertakings Tax Protection Act 1966. In connection with the enactment of the Bermuda CIT, the Company made interim elections to align the membership of the Company’s Bermuda CIT tax group with the membership of the Company’s Pillar Two Bermuda tax group, and recorded a deferred tax asset of $2.0 billion as of December 31, 2024 for entry into the Bermuda CIT regime. As of December 31, 2025, the Company had $1.7 billion of net Bermuda deferred tax assets and concluded that it was more likely than not that sufficient future taxable income would be generated to realize these deferred tax assets.
On January 5, 2026, the OECD issued guidance exempting U.S.-parented groups from the IIR or UTPR taxes under the Pillar Two regime. The U.K. government has publicly announced its intention to enact this guidance into law. While the precise timing of such enactment is subject to the U.K. government’s legislative process, once enacted, the Company expects that Athene and ACRA Bermuda entities would be exempt from the IIR and UTPR taxes in the U.K. In light of these developments, and the Company’s expectation that maintaining alignment between the Bermuda CIT and Pillar Two tax groups would no longer be beneficial, in January 2026, the Company revoked ACRA’s election to be subject to the Bermuda CIT.
Although the Company believes such an outcome would be unlikely, if the U.K. government does not enact the announced legislation, or subsequently amends its legislation in a manner that does not conform to the OECD guidance, the Company expects to re-elect ACRA into the Bermuda CIT regime at that time and utilize the Bermuda deferred tax assets to offset any resulting Bermuda CIT or Pillar Two cash tax obligations.
As a result of the foregoing, in the first quarter of 2026, the Company will record a full valuation allowance against its Bermuda deferred tax assets, as the Company no longer expects Athene or ACRA to incur Bermuda CIT or Pillar Two tax expense against which such deferred tax assets could be utilized. This will result in a reduction to other assets and a corresponding increase to the income tax provision equal to the net amount of the Bermuda deferred tax assets of $1.7 billion.
The primary jurisdictions in which the Company operates and incurs income taxes are the U.S., the U.K. and Bermuda. The Company has accumulated undistributed earnings generated by certain foreign subsidiaries, which are intended to be indefinitely reinvested. As such, no deferred taxes have been recorded related to the accumulated undistributed earnings. The Company determined that estimating the unrecognized tax liability is not practicable.
229
Beginning in 2025 annual reporting, the Company adopted ASU 2023-09 prospectively. A reconciliation of the U.S. federal statutory income tax rate to our effective tax rate for the year ended December 31, 2025 is as follows:
| Year ended December 31, | |||||||||||
| 2025 | |||||||||||
| (In millions, except percentages) | Amount | Percentage | |||||||||
| U.S. federal statutory tax rate | $ | % | |||||||||
State and local income taxes, net of federal income tax effect1 | |||||||||||
| State and local income taxes, net of federal income tax effect | |||||||||||
| Change in valuation allowance | |||||||||||
| Foreign tax effects | ( | ( | |||||||||
| Bermuda | |||||||||||
| Statutory tax rate difference between Bermuda and U.S. | ( | ( | |||||||||
| Income passed through to non-controlling interests | ( | ( | |||||||||
| Anticipatory foreign tax credit | ( | ( | |||||||||
| Bermuda foreign tax credit | ( | ( | |||||||||
| Other foreign jurisdictions | |||||||||||
| Effect of cross-border tax laws | |||||||||||
| Subpart F income | |||||||||||
| U.S. tax on foreign insurance 953(d) income | |||||||||||
| Other | ( | ( | |||||||||
| Tax credits | ( | ( | |||||||||
| Changes in valuation allowances | |||||||||||
| Nontaxable or nondeductible items | ( | ( | |||||||||
| Impact of equity-based compensation | ( | ( | |||||||||
| Nondeductible executive compensation | |||||||||||
| Insurance company owned life insurance | ( | ( | |||||||||
| Other nontaxable or nondeductible items | ( | ( | |||||||||
| Changes in unrecognized tax benefits | |||||||||||
| Other adjustments | |||||||||||
| Investment tax credits accounted for under the proportional amortization method | ( | ( | |||||||||
| Purchase of transferable credits | ( | ( | |||||||||
| Other | |||||||||||
| Effective tax rate | $ | % | |||||||||
1 State and local income taxes in California, Illinois, Iowa, New York State and New York City made up the majority (greater than 50 percent) of the tax effect in this category. | |||||||||||
A reconciliation of the U.S. federal statutory income tax rates to our effective tax rate for the years ended December 31, 2024 and 2023 is as follows:
| Years ended December 31, | |||||||||||
| (In percentages) | 2024 | 2023 | |||||||||
| U.S. federal statutory tax rate | % | % | |||||||||
| Income passed through to non-controlling interests | ( | ( | |||||||||
| State and local income taxes (net of federal benefit) | |||||||||||
| Impact of foreign taxes (net of foreign tax credit) | ( | ( | |||||||||
| Impact of equity-based compensation | ( | ||||||||||
| Impact of valuation allowance | ( | ||||||||||
| Tax Credits | ( | ( | |||||||||
| Redomicile | ( | ||||||||||
| Other | ( | ( | |||||||||
| Effective income tax rate | % | ( | % | ||||||||
230
The income tax provision (benefit) is presented in the following table:
| Years ended December 31, | |||||||||||||||||
| (In millions) | 2025 | 2024 | 2023 | ||||||||||||||
| Income tax provision (benefit) | $ | $ | $ | ( | |||||||||||||
| Income tax provision (benefit) from other comprehensive income (loss) | |||||||||||||||||
| Total income tax provision (benefit) | $ | $ | $ | ( | |||||||||||||
The Company’s cash paid for taxes for the year ended December 31, 2025 included in the consolidated statements of cash flows consists of the following:
| Year ended December 31, | |||||
| (In millions) | 2025 | ||||
| Federal | $ | ||||
| State and local | |||||
| Foreign | |||||
| Cash paid for taxes | $ | ||||
| State and local | |||||
| New York State and City | $ | ||||
| Other State | |||||
| Total State & local | $ | ||||
| Foreign | |||||
| U.K. | $ | ||||
| Other foreign | |||||
| Total Foreign | $ | ||||
Deferred income taxes are recorded due to temporary differences between the tax basis of an asset or liability and its reported amount in the consolidated statements of financial condition. These temporary differences result in taxable or deductible amounts in future years.
231
The Company’s deferred tax assets and liabilities in the consolidated statements of financial condition consist of the following:
| December 31, | |||||||||||
| (In millions) | 2025 | 2024 | |||||||||
| Asset Management | |||||||||||
| Deferred Tax Assets | |||||||||||
| Depreciation and amortization | $ | $ | |||||||||
| Tax credit carryforwards | |||||||||||
| Deferred revenue | |||||||||||
| Equity-based compensation | |||||||||||
| Net operating loss carryforwards | |||||||||||
| Other | |||||||||||
| Total Deferred Tax Assets | |||||||||||
| Valuation Allowance | ( | ( | |||||||||
| Deferred Tax Assets, Net of Valuation Allowance | |||||||||||
| Deferred Tax Liabilities | |||||||||||
| Basis difference in investments | |||||||||||
| Other | |||||||||||
| Total Deferred Tax Liabilities | |||||||||||
| Total Deferred Tax Assets, Net – Asset Management | $ | $ | |||||||||
| Retirement Services | |||||||||||
| Deferred Tax Assets | |||||||||||
| Insurance liabilities | $ | $ | |||||||||
| Net operating loss and tax credit carryforwards | |||||||||||
| Investments, including derivatives | |||||||||||
| Employee benefits | |||||||||||
| Bermuda tax | |||||||||||
| Investment in foreign subsidiaries | |||||||||||
| Other | |||||||||||
| Total Deferred Tax Assets | |||||||||||
| Valuation Allowance | ( | ( | |||||||||
| Deferred Tax Assets, Net of Valuation Allowance | |||||||||||
| Deferred Tax Liabilities | |||||||||||
| Intangible assets | |||||||||||
| DAC, DSI and VOBA | |||||||||||
| Other | |||||||||||
| Total Deferred Tax Liabilities | |||||||||||
| Total Deferred Tax Assets, Net – Retirement Services | $ | $ | |||||||||
The net operating loss and tax credit carryforwards consist of the following:
December 31, 2025 | ||||||||||||||
| Amount (in millions) | Expiration Year1 | |||||||||||||
| U.S. Federal net operating losses | $ | 2026 | ||||||||||||
| U.S. foreign tax credit | 2033 | |||||||||||||
| U.S. general business credits | 2045 | |||||||||||||
| U.S. corporate alternative minimum tax credits | No expiration | |||||||||||||
| U.S. State net operating losses | 2031 | |||||||||||||
| U.K. net operating losses | No expiration | |||||||||||||
| Bermuda net operating losses | No expiration | |||||||||||||
1 Represents the year that operating losses and credits begin to expire. | ||||||||||||||
232
The valuation allowance consists of the following:
| December 31, | |||||||||||
| (In millions) | 2025 | 2024 | |||||||||
| U.S. federal and state net operating losses and other deferred tax assets | $ | $ | |||||||||
| U.K. net operating losses and other deferred tax assets | |||||||||||
| Total Valuation Allowance | $ | $ | |||||||||
Tax Contingencies
In the normal course of business, the Company is subject to examination by federal, state, local and foreign tax authorities. As of December 31, 2025, the Company’s U.S. federal, state, local and foreign income tax returns for the years 2022 through 2024 are open under the general statute of limitations provisions and therefore subject to examination. Currently, the Internal Revenue Service is examining the tax returns of the Company and certain subsidiaries for tax years 2019 to 2023. The State and City of New York are examining certain subsidiaries’ tax returns for tax years 2014 to 2023. The U.K. tax authorities are currently examining certain subsidiaries’ tax returns for tax years 2015 to 2022.
There are other routine examinations ongoing in other state, local, and foreign jurisdictions in which the Company operates. The Company regularly assesses the likelihood of adverse outcomes resulting from these examinations to determine the adequacy of our provision for income taxes. The Company continues to monitor the progress of ongoing discussions with tax authorities. No provisions with respect to these examinations have been recorded, other than the unrecognized tax benefits discussed below.
The following table presents a roll-forward of the beginning and ending aggregate unrecognized tax benefits for the periods presented:
| Years ended December 31, | |||||||||||||||||
| (In millions) | 2025 | 2024 | 2023 | ||||||||||||||
| Balance at beginning of period | $ | $ | $ | ||||||||||||||
| Increases based on tax positions taken in the prior years | |||||||||||||||||
| Decreases due to settlements with tax authorities | ( | ( | |||||||||||||||
| Balance at end of period | $ | $ | $ | ||||||||||||||
233
14. Debt
The Company’s debt consisted of the following:
| December 31, 2025 | December 31, 2024 | |||||||||||||||||||||||||||||||
| (In millions, except percentages) | Maturity Date | Outstanding Balance | Fair Value | Outstanding Balance | Fair Value | |||||||||||||||||||||||||||
| Asset Management | ||||||||||||||||||||||||||||||||
| May 27, 2026 | $ | $ | 3 | $ | $ | 3 | ||||||||||||||||||||||||||
| February 15, 2029 | 3 | 3 | ||||||||||||||||||||||||||||||
| June 5, 2030 | 3 | 3 | ||||||||||||||||||||||||||||||
| January 15, 2031 | 3 | 3 | ||||||||||||||||||||||||||||||
| November 15, 2033 | 3 | 3 | ||||||||||||||||||||||||||||||
| August 12, 2035 | 3 | 3 | ||||||||||||||||||||||||||||||
| March 15, 2048 | 3 | 3 | ||||||||||||||||||||||||||||||
| May 21, 2054 | 3 | 3 | ||||||||||||||||||||||||||||||
| September 15, 2053 | 4 | 4 | ||||||||||||||||||||||||||||||
December 15, 2054 | 3 | 3 | ||||||||||||||||||||||||||||||
| Retirement Services | ||||||||||||||||||||||||||||||||
| January 12, 2028 | 3 | 3 | ||||||||||||||||||||||||||||||
| April 3, 2030 | 3 | 3 | ||||||||||||||||||||||||||||||
| January 15, 2031 | 3 | 3 | ||||||||||||||||||||||||||||||
| February 1, 2033 | 3 | 3 | ||||||||||||||||||||||||||||||
| January 15, 2034 | 3 | 3 | ||||||||||||||||||||||||||||||
| May 25, 2051 | 3 | 3 | ||||||||||||||||||||||||||||||
| May 15, 2052 | 3 | 3 | ||||||||||||||||||||||||||||||
| April 1, 2054 | 3 | 3 | ||||||||||||||||||||||||||||||
| May 19, 2055 | 3 | |||||||||||||||||||||||||||||||
| October 15, 2054 | 3 | 3 | ||||||||||||||||||||||||||||||
| June 28, 2055 | 3 | |||||||||||||||||||||||||||||||
| March 30, 2064 | 4 | 4 | ||||||||||||||||||||||||||||||
| Total Debt | $ | $ | $ | $ | ||||||||||||||||||||||||||||
1 Interest rate is calculated as weighted average annualized. | ||||||||||||||||||||||||||||||||
2 Includes note discounts, as applicable. Outstanding balance is presented net of unamortized debt issuance costs totaling $ | ||||||||||||||||||||||||||||||||
3 Fair value is based on broker quotes. These notes are valued using Level 2 inputs based on the number and quality of broker quotes obtained, the standard deviations of the observed broker quotes and the percentage deviation from external pricing services. | ||||||||||||||||||||||||||||||||
4 Fair value is based on quoted market prices. These notes are classified as a Level 1 liability within the fair value hierarchy. | ||||||||||||||||||||||||||||||||
Asset Management – Notes Issued and Repayments
On August 12, 2025, AGM issued $500 million aggregate principal amount of its 5.150 % Senior Notes due 2035 (the “2035 Senior Notes”). The 2035 Senior Notes bear interest at a rate of 5.150 % per annum and interest is payable semi-annually in arrears on February 12 and August 12 of each year, which commenced on February 12, 2026. The 2035 Senior Notes will mature on August 12, 2035. On November 7, 2025, AGM issued an additional $350 million aggregate principal of its 2035 Senior Notes.
Also on November 7, 2025, AGM issued $400 million aggregate principal of its 4.600 % Senior Notes due 2031 (the “2031 Senior Notes”). The 2031 Senior Notes will bear interest at a rate of 4.600 % per annum and interest is payable semi-annually in arrears on January 15 and July 15 of each year, commencing on July 15, 2026. The 2031 Senior Notes will mature on January 15, 2031.
In connection with the Bridge acquisition, Apollo assumed the outstanding debt of Bridge, including its outstanding senior notes. On September 12, 2025, AGM repaid in full $375 million of aggregate principal amount of the Bridge notes, and no amounts remained outstanding under the Bridge notes as of September 30, 2025.
234
The indentures governing the Asset Management notes restrict the ability of AGM, AMH and the guarantors of the notes to incur indebtedness secured by liens on voting stock or profit participating equity interests of their respective subsidiaries, or merge, consolidate or sell, transfer or lease assets. The indentures also provide for customary events of default.
Retirement Services – Notes Issued
AHL Senior Notes – AHL’s senior unsecured notes are callable by AHL at any time. If called prior to a defined period before the scheduled maturity date, typically three or six months, the price is equal to the greater of (1) 100 % of the principal and any accrued and unpaid interest and (2) an amount equal to the sum of the present values of remaining scheduled payments, discounted from the scheduled payment date to the redemption date at the treasury rate plus a spread (as defined in the applicable prospectus supplement) and any accrued and unpaid interest.
During the second quarter of 2025, AHL issued $1.0 billion of 6.625 % Senior Notes due May 19, 2055 (the “2055 AHL Senior Notes”). AHL will accrue interest quarterly and pay interest on the 2055 AHL Senior Notes semi-annually, which commenced on November 19, 2025.
AHL Subordinated Notes – AHL has fixed-rate reset subordinated notes outstanding, which pay interest at the initially stated fixed rate until the interest rate reset dates, at which point the interest rate resets to the Five-Year U.S. Treasury Rate plus a spread. Reset terms are as defined in the applicable prospectus supplement. AHL may defer interest payments on the subordinated notes for up to consecutive years.
During the second quarter of 2025, AHL issued $600 million of 6.875 % Fixed-Rate Reset Junior Subordinated Debentures due June 28, 2055 (the “2055 AHL Subordinated Notes”). Athene will accrue interest quarterly and pay interest semi-annually at an annual fixed rate of 6.875 % on the 2055 AHL Subordinated Notes, which commenced on December 28, 2025 until June 28, 2035. On June 28, 2035, and every fifth annual anniversary thereafter, the interest rate will reset to the Five-Year U.S. Treasury Rate (as defined in the applicable prospectus supplement) plus 2.582 %. AHL may defer interest payments on the 2055 AHL Subordinated Notes for up to consecutive years.
Credit and Liquidity Facilities
The following table represents the Company’s credit and liquidity facilities as of December 31, 2025:
| Instrument/Facility | Maturity Date | Administrative Agent | Key terms | ||||||||
Asset Management – AGM credit facility | November 21, 2029 | Citibank | The borrowing capacity under the AGM credit facility is $ | ||||||||
Retirement Services – AHL credit facility | June 30, 2028 | Citibank | The borrowing capacity under the AHL credit facility is $ | ||||||||
Retirement Services – AHL liquidity facility | June 26, 2026 | Wells Fargo Bank | The borrowing capacity under the AHL liquidity facility is $ | ||||||||
Asset Management – Credit Facility
On November 21, 2024, AGM and AMH, as parent borrower and subsidiary borrower, respectively, entered into a $1.25 billion revolving credit facility with Citibank, N.A., as administrative agent, which matures on November 21, 2029 (“AGM credit facility”). As of December 31, 2025, AGM and AMH, as borrowers under the facility, could incur incremental facilities in an aggregate amount not to exceed $250 million plus additional amounts so long as AGM and AMH were in compliance with a net leverage ratio not to exceed 4.00 to 1.00.
As of December 31, 2025 and December 31, 2024, there were no
235
Asset Management – Bridge Credit Facility
In connection with the Bridge acquisition, Apollo assumed outstanding debt of Bridge, including the amended revolving credit agreement with CIBC as administrative agent (“Bridge credit facility”). The Bridge credit facility provided for revolving credit commitments of up to $150 million, with the ability to increase aggregate commitments up to an additional $75 million, and had a maturity date of June 3, 2026. The Bridge credit facility was terminated on December 31, 2025, and as of that date there were no amounts outstanding under the facility.
Retirement Services – Credit and Liquidity Facilities
AHL Credit Facility—On June 30, 2023, AHL, ALRe, Athene USA Corporation (“AUSA”) and AARe entered into a five-year revolving credit agreement with a syndicate of banks and Citibank, N.A. as administrative agent (“AHL credit facility”). The AHL credit facility is unsecured and has a commitment termination date of June 30, 2028, subject to up to two one-year extensions, in accordance with the terms of the AHL credit facility. In connection with the AHL credit facility, AHL and AUSA guaranteed all of the obligations of AHL, ALRe, AARe and AUSA under the AHL credit facility and the related loan documents, and ALRe and AARe guaranteed certain of the obligations of AHL, ALRe, AARe and AUSA under the AHL credit facility and the related loan documents. The borrowing capacity under the AHL credit facility is $1.25 billion, subject to being increased up to $1.75 billion in total on the terms described in the AHL credit facility.
The AHL credit facility contains various standard covenants with which Athene must comply, including the following:
1.Consolidated debt-to-capitalization ratio not to exceed 35 %;
2.Minimum consolidated net worth of no less than $14.8 billion; and
3.Restrictions on Athene’s ability to incur liens, with certain exceptions.
Interest accrues on outstanding borrowings at either the adjusted term secured overnight financing rate plus a margin or the base rate plus a margin, with the applicable margin varying based on AHL’s debt rating. Rates and terms are as defined in the AHL credit facility. As of December 31, 2025 and December 31, 2024, there were no
AHL Liquidity Facility—On June 27, 2025, AHL, AARe, ALRe and AAIA entered into a revolving credit agreement with a syndicate of banks and Wells Fargo Bank, National Association, as administrative agent, (“AHL liquidity facility”), which replaced the previous credit agreement dated as of June 28, 2024 and the commitments under it, which expired on June 27, 2025. The AHL liquidity facility is unsecured and has a commitment termination date of June 26, 2026, subject to any extensions of additional 364 -day periods with consent of extending lenders and/or “term-out” of outstanding loans (by which, at Athene’s election, the outstanding loans may be converted to term loans which shall have a maturity of up to one year after the original maturity date), in each case in accordance with the terms of the AHL liquidity facility. In connection with the AHL liquidity facility, AARe guaranteed all of the obligations of each other borrower under the AHL liquidity facility and the related loan documents. The AHL liquidity facility will be used for liquidity and working capital needs to meet short-term cash flow and investment timing differences. The borrowing capacity under the AHL liquidity facility is $2.6 billion, subject to being increased up to $3.1 billion in total on the terms described in the AHL liquidity facility. The AHL liquidity facility contains various standard covenants with which Athene must comply, including the following:
1.AARe minimum consolidated net worth of no less than $23.2 billion; and
2.Restrictions on Athene’s ability to incur liens, with certain exceptions.
Interest accrues on outstanding borrowings at the adjusted term secured overnight financing rate plus a margin or the base rate plus a margin, with applicable margin varying based on AARe’s financial strength rating. Rates and terms are as defined in the AHL liquidity facility. As of December 31, 2025 and December 31, 2024, there were no
236
Interest Expense
The following table presents the interest expense incurred related to the Company’s debt:
| Years ended December 31, | |||||||||||||||||
| (In millions) | 2025 | 2024 | 2023 | ||||||||||||||
| Asset Management | $ | $ | $ | ||||||||||||||
Retirement Services1 | |||||||||||||||||
| Total Interest Expense | $ | $ | $ | ||||||||||||||
Note: Debt issuance costs incurred are amortized into interest expense over the term of the debt arrangement, as applicable. | |||||||||||||||||
1 Interest expense for Retirement Services is included in policy and other operating expenses on the consolidated statements of operations. | |||||||||||||||||
Contractual Maturities
The table below presents the contractual maturities for the Company's debt arrangements:
| (In millions) | 2026 | 2027 - 2028 | 2029 - 2030 | 2031 and Thereafter | Total | ||||||||||||||||||||||||
| Asset Management | |||||||||||||||||||||||||||||
| Debt obligations | $ | $ | $ | $ | $ | ||||||||||||||||||||||||
| Retirement Services | |||||||||||||||||||||||||||||
| Debt obligations | |||||||||||||||||||||||||||||
Total Obligations as of December 31, 2025 | $ | $ | $ | $ | $ | ||||||||||||||||||||||||
15. Equity-Based Compensation
Under the Equity Plan, the Company grants equity-based awards to employees. Equity-based awards granted to employees and non-employees as compensation are measured based on the grant date fair value of the award, which considers the public share price of AGM’s common stock subject to certain discounts, as applicable.
The Company grants both service-based and performance-based awards. The estimated total grant date fair value for service-based awards is charged to compensation expense on a straight-line basis over the vesting period, which is generally to five years from the date of grant. Performance-based awards are typically recognized on an accelerated recognition method over the requisite service period to the extent the performance metrics are met or deemed probable. Equity-based awards that do not require future service are expensed immediately.
For the years ended December 31, 2025, 2024 and 2023, the Company recorded equity-based compensation expense of $789 million, $721 million and $1.0 billion, respectively. As of December 31, 2025, there was $650 million of estimated unrecognized compensation expense related to unvested RSU awards. This cost is expected to be recognized over a weighted-average period of 1.9 years.
The following table summarizes the weighted average discounts for service-based grants and performance-based grants:
| Years ended December 31, | |||||||||||||||||
| 2025 | 2024 | 2023 | |||||||||||||||
| Service-Based Grants: | |||||||||||||||||
Marketability discount for transfer restrictions1 | % | % | % | ||||||||||||||
| Performance-Based Grants: | |||||||||||||||||
Discount for the lack of distributions until vested2 | % | % | % | ||||||||||||||
Marketability discount for transfer restrictions1 | % | % | % | ||||||||||||||
1 Based on the Finnerty Model calculation. | |||||||||||||||||
2 Based on the present value of a growing annuity calculation. | |||||||||||||||||
237
Service-Based Awards
During the years ended December 31, 2025, 2024 and 2023, the Company awarded 4.5 million, 3.7 million and 5.0 million of service-based RSUs, respectively, with a grant date fair value of $674 million, $405 million and $339 million, respectively.
During the years ended December 31, 2025, 2024 and 2023, the Company recorded equity-based compensation expense on service-based RSUs of $533 million, $398 million and $313 million, respectively.
Performance-Based Awards
During the years ended December 31, 2025, 2024, and 2023, the Company awarded 0.8 million, 1.5 million and 1.5 million of performance-based RSUs, respectively, with a grant date fair value of $95 million, $181 million, and $97 million, respectively, which primarily vest subject to continued employment and the Company’s receipt of performance revenues, within prescribed periods, sufficient to cover the associated equity-based compensation expense.
During the years ended December 31, 2025, 2024 and 2023, the Company recorded equity-based compensation expense on performance-based awards of $147 million, $260 million and $175 million, respectively.
During the years ended December 31, 2025, 2024 and 2023, the Company issued equity awards where the number of shares to be issued is variable based on the achievement of specified performance targets. Compensation expense is recognized over the performance period based upon the probable outcome of the performance condition and the performance-based compensation is classified as a liability, and therefore, the fair value of these awards is remeasured each reporting period. Given the number of shares to be issued in settlement of these awards is not yet known, the tables below exclude the impact of these awards.
In December 2021, the Company awarded one-time grants to the then Co-Presidents of AAM of 6.0 million RSUs which vest on a cliff basis subject to continued employment over five years , with 2.0 million of those RSUs also subject to the Company’s achievement of certain fee related earnings and spread related earnings per share metrics. During the year ended December 31, 2025, the Company recorded equity-based compensation expense of $80 million for these one-time grants of which $56 million is related to service-based awards and $24 million is related to performance-based awards.
The following table summarizes RSU activity:
| Unvested | Weighted Average Grant Date Fair Value | Vested | Total Number of RSUs Outstanding | ||||||||||||||||||||
| Balance at January 1, 2025 | $ | ||||||||||||||||||||||
Granted 1 | |||||||||||||||||||||||
| Forfeited | ( | ( | ( | ||||||||||||||||||||
| Vested | ( | ||||||||||||||||||||||
| Issued | — | — | ( | ( | |||||||||||||||||||
| Balance at December 31, 2025 | $ | ||||||||||||||||||||||
1 Includes 0.2 million unvested RSUs with a fair value of $26 million converted as part of the Bridge acquisition.
Restricted Stock Awards
The Company also grants certain restricted stock awards tied to profit sharing arrangements. During the years ended December 31, 2025, 2024 and 2023, the Company awarded 0.4 million, 0.4 million and 0.6 million shares of restricted stock, respectively, relating to profit sharing arrangements with a grant date fair value of $56 million, $52 million and $41 million, respectively.
During the years ended December 31, 2025, 2024 and 2023, the Company recorded equity-based compensation expense related to restricted stock awards of $80 million, $46 million and $46 million, respectively. During the year ended December 31, 2025, there was $88 million of total unrecognized equity-based compensation expense related to unvested restricted stock awards, which is expected to be recognized over a weighted-average term of 1.7 years.
238
The following table summarizes restricted stock award activity:
| Unvested | Weighted Average Grant Date Fair Value | Vested | Total Shares of Restricted Stock Outstanding | ||||||||||||||||||||
Balance at January 1, 2025 | $ | ||||||||||||||||||||||
Granted1 | |||||||||||||||||||||||
| Forfeited | ( | ( | |||||||||||||||||||||
| Vested | ( | ||||||||||||||||||||||
Issued2 | — | ( | ( | ||||||||||||||||||||
Balance at December 31, 2025 | $ | ||||||||||||||||||||||
1 Includes | |||||||||||||||||||||||
2 Refers to issued shares that became freely transferable in 2025. | |||||||||||||||||||||||
16. Equity
Common Stock
Holders of common stock are entitled to participate in dividends from the Company on a pro rata basis.
During the years ended December 31, 2025, 2024 and 2023, the Company issued shares of common stock in settlement of vested RSUs. The Company has generally allowed holders of vested RSUs and exercised share options to settle their tax liabilities by reducing the number of shares of common stock issued to them, which the Company refers to as “net share settlement.” Additionally, the Company has generally allowed holders of share options to settle their exercise price by reducing the number of shares of common stock issued to them at the time of exercise by an amount sufficient to cover the exercise price. The net share settlement results in a liability for the Company and a corresponding adjustment to retained earnings (accumulated deficit).
On February 21, 2023, the AGM board of directors approved a reallocation of the Company’s prior share repurchase program, pursuant to which, the Company was authorized to repurchase (i) up to an aggregate of $1.0 billion of shares of its common stock in order to opportunistically reduce its share count, a decrease of $0.5 billion of shares from the previously authorized amount and (ii) up to an aggregate of $1.5 billion of shares of its common stock in order to offset the dilutive impact of share issuances under its equity incentive plans, an increase of $0.5 billion of shares from the previously authorized amount.
On February 8, 2024, the AGM board of directors terminated the Company’s prior share repurchase program and approved a new share repurchase program, pursuant to which, the Company is authorized to repurchase up to $3.0 billion of shares of its common stock to opportunistically reduce the Company’s share count or offset the dilutive impact of share issuances under the Company’s equity incentive plans. Effective February 9, 2026, the AGM board of directors terminated the Company’s prior share repurchase program and approved a new share repurchase program, pursuant to which, the Company is authorized to repurchase up to $4.0 billion of shares of its common stock to opportunistically reduce the Company’s share count or offset the dilutive impact of share issuances under the Company’s equity incentive plans. Shares of common stock may be repurchased from time to time in open market transactions, in privately negotiated transactions, pursuant to a trading plan adopted in accordance with Rule 10b5-1 of the Exchange Act, or otherwise, as well as through reductions of shares that otherwise would have been issued to participants under the Company’s Equity Plan in order to satisfy associated tax obligations. The repurchase program does not obligate the Company to make any repurchases at any specific time. The program is effective until the aggregate repurchase amount that has been approved by the AGM board of directors has been expended and may be suspended, extended, modified or discontinued at any time.
239
The table below outlines share activity:
| Years ended December 31, | |||||||||||||||||
| 2025 | 2024 | 2023 | |||||||||||||||
Shares of common stock issued in settlement of vested RSUs and options exercised1 | |||||||||||||||||
Reduction of shares of common stock issued2 | ( | ( | ( | ||||||||||||||
Shares of common stock purchased related to share issuances and forfeitures3 | ( | ( | |||||||||||||||
| Issuance of shares of common stock for equity-based awards | |||||||||||||||||
1 The gross value of shares issued was $ | |||||||||||||||||
2 Cash paid for tax liabilities associated with net share settlement was $ | |||||||||||||||||
3 Certain Apollo employees receive a portion of the profit sharing proceeds of certain funds in the form of (a) restricted shares of common stock that they are required to purchase with such proceeds or (b) RSUs, in each case which equity-based awards generally vest over | |||||||||||||||||
During the years ended December 31, 2025, 2024 and 2023, 5,708,804 , 7,845,000 and 7,469,544 shares of common stock, respectively, were repurchased in open market transactions as part of the publicly announced share repurchase programs discussed above, and such shares were subsequently canceled by the Company. The Company paid $773 million, $890 million and $508 million for these open market share repurchases during the years ended December 31, 2025, 2024 and 2023, respectively.
During the year ended December 31, 2025, the Company issued 540,177 shares of common stock in settlement of a deferred consideration obligation. During the second quarter of 2024, the Company issued 742,742 shares of common stock in settlement of a share-based contingent consideration. See note 19 for further information on the contingent consideration.
Mandatory Convertible Preferred Stock
On August 11, 2023, the Company issued 28,750,000 shares, or $1.4 billion aggregate liquidation preference, of its 6.75 % Series A Mandatory Convertible Preferred Stock (the “Mandatory Convertible Preferred Stock”).
Dividends on the Mandatory Convertible Preferred Stock will be payable on a cumulative basis when, as and if declared by the AGM board of directors, or an authorized committee thereof, at an annual rate of 6.75 % on the liquidation preference of $50.00 per share, and may be paid in cash or, subject to certain limitations, in shares of common stock or, subject to certain limitations, any combination of cash and shares of common stock. If declared, dividends on the Mandatory Convertible Preferred Stock will be payable quarterly on January 31, April 30, July 31 and October 31 of each year, commencing on October 31, 2023, and ending on, and including, July 31, 2026. The first dividend payment on October 31, 2023 was $0.7500 per share of Mandatory Convertible Preferred Stock, with subsequent quarterly cash dividends expected to be $0.8438 per share of Mandatory Convertible Preferred Stock.
Unless converted earlier in accordance with its terms, each share of Mandatory Convertible Preferred Stock will automatically convert on the mandatory conversion date, which is expected to be July 31, 2026, into between 0.5066 shares and 0.6079 shares of common stock, in each case, subject to customary anti-dilution adjustments described in the certificate of designations related to the Mandatory Convertible Preferred Stock (the “Certificate of Designations”). The number of shares of common stock issuable upon conversion will be determined based on the average volume weighted average price per share of common stock over the 20 consecutive trading day period beginning on, and including, the 21st scheduled trading day immediately prior to July 31, 2026.
Holders of shares of Mandatory Convertible Preferred Stock have the option to convert all or any portion of their shares of Mandatory Convertible Preferred Stock at any time. The conversion rate applicable to any early conversion may in certain circumstances be increased to compensate holders of the Mandatory Convertible Preferred Stock for certain unpaid accumulated dividends as described in the Certificate of Designations.
240
If a Fundamental Change, as defined in the Certificate of Designations, occurs on or prior to July 31, 2026, then holders of the Mandatory Convertible Preferred Stock will be entitled to convert all or any portion of their Mandatory Convertible Preferred Stock at the Fundamental Change Conversion Rate for a specified period of time and to also receive an amount to compensate them for certain unpaid accumulated dividends and any remaining future scheduled dividend payments.
The Mandatory Convertible Preferred Stock is not subject to redemption at the Company’s option.
During the years ended December 31, 2025 and 2024, 100 and 235 shares of the Mandatory Convertible Preferred Stock were converted at the option of the respective holders, respectively. As of December 31, 2025 and December 31, 2024, there were 28,749,665 28,749,765
Warrants
In 2022, the Company issued warrants in a private placement exercisable for up to 12.5 million shares of common stock at an exercise price of $82.80 per share. As of December 31, 2025, warrants exercisable for 7.4 million shares of common stock were vested and exercisable. In April 2025, the Company issued 1,080,041 shares of common stock in relation to a cashless exercise of 2.6 million vested warrants issued in 2022. The remaining warrants exercisable for 2.5 million shares of common stock will become exercisable in the first quarter of 2026. As of December 31, 2025, pursuant to certain anti-dilution provisions, the exercise price for the warrants was adjusted to $82.56 .
In November 2024, the Company issued warrants in a private placement exercisable for up to 2.9 million shares of common stock at an exercise price of $173.51 per share. The warrants are exercisable on the issuance date and each of the first, second, third, fourth, fifth and sixth anniversaries thereof. As of December 31, 2025, warrants exercisable for 0.8 million shares of common stock were vested and exercisable. Each warrant, to the extent exercised, will be settled on a “cashless net exercise basis.” The warrants will expire on the seventh anniversary of the issuance date, with any vested but unexercised warrants being automatically exercised at such time if the trading price of common stock is above the exercise price.
Donor-Advised Fund
In February 2025, the Company established a donor-advised fund (the “Apollo DAF”) as part of its ongoing commitment to philanthropy. The Company issued 1,213,003 shares of common stock in February 2025 to fund the Apollo DAF.
Dividends and Distributions
Outlined below is information regarding quarterly dividends and distributions (in millions, except per share data).
| Dividend Declaration Date | Dividend per Share of Common Stock | Payment Date | Dividend to Common Stockholders | Distribution Equivalents on Participating Securities | |||||||||||||||||||
| February 9, 2023 | $ | February 28, 2023 | $ | $ | |||||||||||||||||||
| May 9, 2023 | May 31, 2023 | ||||||||||||||||||||||
| August 3, 2023 | August 31, 2023 | ||||||||||||||||||||||
| November 1, 2023 | November 30, 2023 | ||||||||||||||||||||||
| Year ended December 31, 2023 | $ | $ | $ | ||||||||||||||||||||
| February 8, 2024 | $ | February 29, 2024 | $ | $ | |||||||||||||||||||
| May 2, 2024 | May 31, 2024 | ||||||||||||||||||||||
| August 1, 2024 | August 30, 2024 | ||||||||||||||||||||||
| November 5, 2024 | November 29, 2024 | ||||||||||||||||||||||
| Year ended December 31, 2024 | $ | $ | $ | ||||||||||||||||||||
| February 4, 2025 | $ | February 28, 2025 | $ | $ | |||||||||||||||||||
| May 2, 2025 | May 30, 2025 | ||||||||||||||||||||||
| August 5, 2025 | August 29, 2025 | ||||||||||||||||||||||
| November 4, 2025 | November 28, 2025 | ||||||||||||||||||||||
| Year ended December 31, 2025 | $ | $ | $ | ||||||||||||||||||||
241
Accumulated Other Comprehensive Income (Loss)
| (In millions) | Unrealized investment gains (losses) on AFS securities without a credit allowance | Unrealized investment gains (losses) on AFS securities with a credit allowance | Unrealized gains (losses) on hedging instruments | Remeasurement gains (losses) on future policy benefits related to discount rate | Remeasurement gains (losses) on market risk benefits related to credit risk | Foreign currency translation and other adjustments | Accumulated other comprehensive income (loss) | ||||||||||||||||||||||||||||||||||
| Balance at December 31, 2024 | $ | ( | $ | ( | $ | ( | $ | $ | ( | $ | ( | $ | ( | ||||||||||||||||||||||||||||
| Other comprehensive income (loss) before reclassifications | ( | ( | |||||||||||||||||||||||||||||||||||||||
Less: Reclassification adjustments for gains (losses) realized1 | ( | ( | ( | ||||||||||||||||||||||||||||||||||||||
| Less: Income tax provision (benefit) | ( | ( | |||||||||||||||||||||||||||||||||||||||
| Less: Other comprehensive income (loss) attributable to non-controlling interests, net of tax | ( | ( | |||||||||||||||||||||||||||||||||||||||
| Balance at December 31, 2025 | $ | ( | $ | ( | $ | ( | $ | $ | ( | $ | $ | ( | |||||||||||||||||||||||||||||
1 Recognized in investment related gains (losses) on the consolidated statements of operations. | |||||||||||||||||||||||||||||||||||||||||
| (In millions) | Unrealized investment gains (losses) on AFS securities without a credit allowance | Unrealized investment gains (losses) on AFS securities with a credit allowance | Unrealized gains (losses) on hedging instruments | Remeasurement gains (losses) on future policy benefits related to discount rate | Remeasurement gains (losses) on market risk benefits related to credit risk | Foreign currency translation and other adjustments | Accumulated other comprehensive income (loss) | ||||||||||||||||||||||||||||||||||
| Balance at December 31, 2023 | $ | ( | $ | ( | $ | ( | $ | $ | $ | $ | ( | ||||||||||||||||||||||||||||||
| Other comprehensive income (loss) before reclassifications | ( | ( | ( | ( | ( | ( | |||||||||||||||||||||||||||||||||||
Less: Reclassification adjustments for gains (losses) realized1 | ( | ( | ( | ||||||||||||||||||||||||||||||||||||||
| Less: Income tax provision (benefit) | ( | ( | ( | ( | |||||||||||||||||||||||||||||||||||||
| Less: Other comprehensive income (loss) attributable to non-controlling interests, net of tax | ( | ( | ( | ( | ( | ||||||||||||||||||||||||||||||||||||
| Balance at December 31, 2024 | $ | ( | $ | ( | $ | ( | $ | $ | ( | $ | ( | $ | ( | ||||||||||||||||||||||||||||
1 Recognized in investment related gains (losses) on the consolidated statements of operations. | |||||||||||||||||||||||||||||||||||||||||
242
| (In millions) | Unrealized investment gains (losses) on AFS securities without a credit allowance | Unrealized investment gains (losses) on AFS securities with a credit allowance | Unrealized gains (losses) on hedging instruments | Remeasurement gains (losses) on future policy benefits related to discount rate | Remeasurement gains (losses) on market risk benefits related to credit risk | Foreign currency translation and other adjustments | Accumulated other comprehensive income (loss) | ||||||||||||||||||||||||||||||||||
| Balance at December 31, 2022 | $ | ( | $ | ( | $ | $ | $ | $ | ( | $ | ( | ||||||||||||||||||||||||||||||
| Other comprehensive income (loss) before reclassifications | ( | ( | ( | ||||||||||||||||||||||||||||||||||||||
Less: Reclassification adjustments for gains (losses) realized1 | ( | ( | ( | ||||||||||||||||||||||||||||||||||||||
| Less: Income tax provision (benefit) | ( | ( | |||||||||||||||||||||||||||||||||||||||
| Less: Other comprehensive income (loss) attributable to non-controlling interests, net of subsidiary issuance of equity interest and tax | ( | ( | ( | ||||||||||||||||||||||||||||||||||||||
| Balance at December 31, 2023 | $ | ( | $ | ( | $ | ( | $ | $ | $ | $ | ( | ||||||||||||||||||||||||||||||
1 Recognized in investment related gains (losses) on the consolidated statements of operations. | |||||||||||||||||||||||||||||||||||||||||
243
17. Earnings per Share
The following presents basic and diluted net income (loss) per share of common stock computed using the two-class method:
| Basic and Diluted | |||||||||||||||||
| Years ended December 31, | |||||||||||||||||
| (In millions, except share and per share amounts) | 2025 | 2024 | 2023 | ||||||||||||||
| Numerator: | |||||||||||||||||
| Net income (loss) attributable to common stockholders | $ | $ | $ | ||||||||||||||
Dividends declared on common stock1 | ( | ( | ( | ||||||||||||||
Dividends on participating securities2 | ( | ( | ( | ||||||||||||||
| Earnings allocable to participating securities | ( | ( | ( | ||||||||||||||
| Undistributed income (loss) attributable to common stockholders: Basic | |||||||||||||||||
| Dilution effect on distributable income attributable to Mandatory Convertible Preferred Stock | |||||||||||||||||
| Dilution effect on distributable income attributable to contingent shares | ( | ||||||||||||||||
| Undistributed income (loss) attributable to common stockholders: Diluted | $ | $ | $ | ||||||||||||||
| Denominator: | |||||||||||||||||
| Weighted average number of shares of common stock outstanding: Basic | |||||||||||||||||
| Dilution effect of Mandatory Convertible Preferred Stock | |||||||||||||||||
| Dilution effect of options | |||||||||||||||||
| Dilution effect of warrants | |||||||||||||||||
| Dilution effect of contingent shares | |||||||||||||||||
| Weighted average number of shares of common stock outstanding: Diluted | |||||||||||||||||
| Net income (loss) per share of common stock: Basic | |||||||||||||||||
| Distributed income | $ | $ | $ | ||||||||||||||
| Undistributed income (loss) | |||||||||||||||||
| Net income (loss) per share of common stock: Basic | $ | $ | $ | ||||||||||||||
| Net income (loss) per share of common stock: Diluted | |||||||||||||||||
| Distributed income | $ | $ | $ | ||||||||||||||
| Undistributed income (loss) | |||||||||||||||||
| Net income (loss) per share of common stock: Diluted | $ | $ | $ | ||||||||||||||
1 See note 16 for information regarding quarterly dividends. | |||||||||||||||||
2 Participating securities consist of vested and unvested RSUs that have rights to dividends and unvested restricted shares. | |||||||||||||||||
The Company has granted RSUs that provide the right to receive, subject to vesting during continued employment, shares of common stock pursuant to the Equity Plan.
Any dividend equivalent paid to an employee on RSUs will not be returned to the Company upon forfeiture of the award by the employee. Vested and unvested RSUs that are entitled to non-forfeitable dividend equivalents qualify as participating securities and are included in the Company’s basic and diluted earnings per share computations using the two-class method. The holder of an RSU participating security would have a contractual obligation to share in the losses of the entity if the holder is obligated to fund the losses of the issuing entity or if the contractual principal or mandatory redemption amount of the participating security is reduced as a result of losses incurred by the issuing entity. The RSU participating securities do not have a mandatory redemption amount and the holders of the participating securities are not obligated to fund losses; therefore, neither the vested RSUs nor the unvested RSUs are subject to any contractual obligation to share in losses of the Company.
244
The following table summarizes the anti-dilutive securities:
| Years ended December 31, | |||||||||||||||||
| 2025 | 2024 | 2023 | |||||||||||||||
| Weighted average unvested RSUs | |||||||||||||||||
| Weighted average unexercised warrants | |||||||||||||||||
| Weighted average Mandatory Convertible Preferred Stock | |||||||||||||||||
| Weighted average unvested restricted shares | |||||||||||||||||
18. Related Parties
Asset Management
Due from/to related parties
Due from/to related parties includes:
•unpaid management fees, transaction and advisory fees and reimbursable expenses from the funds Apollo manages and their portfolio companies;
•reimbursable payments for certain operating costs incurred by these funds as well as their related parties; and
•other related party amounts arising from transactions, including loans to employees and periodic sales of ownership interests in funds managed by Apollo.
Due from/to related parties consisted of the following:
| (In millions) | December 31, 2025 | December 31, 2024 | |||||||||
| Due from Related Parties: | |||||||||||
Due from funds1 | $ | $ | |||||||||
| Due from portfolio companies | |||||||||||
| Due from employees and former employees | |||||||||||
Total Due from Related Parties2 | $ | $ | |||||||||
| Due to Related Parties: | |||||||||||
| Due to TRA holders | $ | $ | |||||||||
| Due to funds | |||||||||||
| Due to portfolio companies | |||||||||||
| Total Due to Related Parties | $ | $ | |||||||||
1 Includes $ | |||||||||||
2 Includes due from related parties of certain consolidated VIEs. | |||||||||||
Tax Receivable Agreements
All Apollo Operating Group entities have made an election under Section 754 of the U.S. Internal Revenue Code (“IRC”). The election results in an increase to the tax basis of underlying assets which will reduce the amount of gain and associated tax that AGM and its subsidiaries will otherwise be required to pay in the future.
The Apollo TRA provides for payment to the Former Managing Partners and Contributing Partners of 85 % of the amount of cash tax savings, if any, in U.S. federal, state, local and foreign income taxes the Company realizes as a result of the increases in tax basis of assets resulting from exchanges of AOG Units for Class A shares that have occurred in prior years. AGM and its subsidiaries retain the benefit of the remaining 15 % of actual cash tax savings. If the Company does not make the required annual payment on a timely basis as outlined in the tax receivable agreement, interest is accrued on the balance until the payment date.
In connection with its IPO in 2024, Bridge entered into a tax receivable agreement with certain equity holders in its business which was amended and restated in connection with the Bridge acquisition. Under the Bridge TRA, the Company is obligated to make payments to Bridge TRA holders based on 85 % of the tax benefits realized from the acquisition. As part of the Bridge
245
acquisition, the Company recorded a $383 million TRA liability due under the Bridge TRA, which is measured in accordance with ASC 450-20, Loss Contingencies.
As of December 31, 2025, both Apollo and Bridge TRA holders no longer own any operating units that could be exchanged pursuant to the Apollo TRA and Bridge TRA, respectively.
Due from Employees and Former Employees
As of December 31, 2025 and December 31, 2024, due from related parties includes various amounts due to Apollo, including employee loans and return of profit-sharing distributions. As of December 31, 2025 and December 31, 2024, the balance includes interest-bearing employee loans receivable of $12 million and $4 million, respectively. The outstanding principal amount of the loans as well as all accrued and unpaid interest is required to be repaid on a specified date, either during the relevant employee’s tenure or at the date of the relevant employee’s resignation, in accordance with the contractual terms of each respective loan arrangement.
The receivable from certain employees and former employees includes an amount for the potential return of profit-sharing distributions that would be due if certain funds were liquidated of $91 million and $94 million at December 31, 2025 and December 31, 2024, respectively.
Indemnity
Certain of the performance revenues Apollo earns from funds may be subject to repayment by its subsidiaries that are general partners of the funds in the event that certain specified return thresholds are not ultimately achieved. The Former Managing Partners, Contributing Partners and certain other investment professionals have personally guaranteed, subject to certain limitations, the obligations of these subsidiaries in respect of this obligation. Such guarantees are several and not joint and are limited to a particular individual’s distributions. Apollo has agreed to indemnify each of the Former Managing Partners and certain Contributing Partners against all amounts that they pay pursuant to any of these personal guarantees in favor of certain funds that it manages (including costs and expenses related to investigating the basis for or objecting to any claims made in respect of the guarantees) for all interests that the Former Managing Partners and Contributing Partners contributed or sold to the Apollo Operating Group.
Apollo recorded an indemnification liability of $0.4 million and $0.4 million as of December 31, 2025 and December 31, 2024, respectively.
Due to Related Parties
Based upon an assumed liquidation of certain of the funds Apollo manages, it has recorded a general partner obligation to return previously distributed performance allocations, which represents amounts due to certain funds. The obligation is recognized based upon an assumed liquidation of a fund’s net assets as of the reporting date. The actual determination and any required payment would not take place until the final disposition of a fund’s investments based on the contractual termination of the fund or as otherwise set forth in the respective governing document of the fund.
Apollo recorded general partner obligations to return previously distributed performance allocations related to certain funds of $212 million and $213 million as of December 31, 2025 and December 31, 2024, respectively.
Athora
Apollo, through ISGI, provides investment advisory services to certain portfolio companies of funds managed by Apollo and Athora, a strategic liabilities platform that acquires or reinsures blocks of insurance business in the German and broader European life insurance market (collectively, the “Athora Accounts”). AAM and its subsidiaries had equity commitments outstanding to Athora of up to $82 million as of December 31, 2025, subject to certain conditions. On July 3, 2025, AAM made a conditional commitment to invest, or cause one or more of its affiliates to invest, in Athora for up to an additional $2.0 billion, in connection with Athora’s agreement to acquire a U.K. insurer (the “Athora transaction”). The Athora transaction remains subject to closing conditions, including receipt of regulatory approvals. The amount ultimately funded pursuant to the conditional commitment, and sources of funding, are subject to change as a result of an anticipated capital raise by Athora between signing and closing of the Athora transaction. See “—Athora” in the Retirement Services section below for details on Athene’s conditional commitments to Athora.
246
Athora Sub-Advised
Apollo provides sub-advisory services with respect to a portion of the assets in certain portfolio companies of funds managed by Apollo and the Athora Accounts. Apollo broadly refers to “Athora Sub-Advised” assets as those assets in the Athora Accounts which Apollo explicitly sub-advises as well as those assets in the Athora Accounts which are invested directly in funds and investment vehicles Apollo manages.
Apollo earns a base management fee on the aggregate market value of substantially all of the investment accounts of or relating to Athora and also a sub-advisory fee on the Athora Sub-Advised assets, which varies depending on the specific asset class.
See “—Athora” in the Retirement Services section below for further details on Athene’s relationship with Athora.
Regulated Entities and Affiliated Service Providers
Apollo Global Securities, LLC (“AGS”) is a registered broker-dealer with the SEC and is a member of the Financial Industry Regulatory Authority, subject to the minimum net capital requirements of the SEC. AGS was in compliance with these requirements as of December 31, 2025. From time to time AGS, as well as other Apollo affiliates, provide services to related parties of Apollo, including Apollo funds and their portfolio companies, whereby the Company or its affiliates earn fees for providing such services.
Griffin Capital Securities, LLC (“GCS”) is a registered broker-dealer with the SEC and is a member of the Financial Industry Regulatory Authority, subject to the minimum net capital requirements of the SEC. GCS was in compliance with these requirements as of December 31, 2025.
Investment in SPACs
Apollo previously sponsored and consolidated two SPACs, Apollo Strategic Growth Capital II (“APSG II”) and Acropolis Infrastructure Acquisition Corp (“Acropolis”). Both SPACs were ultimately liquidated in the fourth quarter of 2023, resulting in a loss of $40 million. See details below.
On February 12, 2021, APSG II completed an IPO, raising total gross proceeds of $690 million. APSG Sponsor II, L.P., a subsidiary of Apollo, held Class B ordinary shares of APSG II, and consolidated APSG II as a VIE. In May 2023, APSG II amended its articles of association to extend the completion window for an initial business combination until February 12, 2024. Also in May 2023, shareholders holding an aggregate of 51,089,882 of APSG II’s Class A ordinary shares exercised their right to redeem their shares. The remaining 17,910,118 Class A ordinary shares were liquidated in November 2023. As a result, in the fourth quarter of 2023, the Company recognized a loss of $31 million.
On July 13, 2021, Acropolis completed an IPO, ultimately raising total gross proceeds of $345 million. Acropolis Infrastructure Acquisition Sponsor, L.P., a subsidiary of Apollo, held Class B common stock of Acropolis, and consolidated Acropolis as a VIE. In June 2023, Acropolis amended its certificate of incorporation to extend the completion window for an initial business combination until July 13, 2024. Also in June 2023, shareholders holding an aggregate of 26,499,201 shares of Acropolis’ Class A common stock exercised their right to redeem their shares. The remaining 8,000,799 shares of Class A common stock were liquidated in December 2023. As a result, in the fourth quarter of 2023, the Company recognized a loss of $9 million.
Retirement Services
AAA
Athene consolidates AAA as a VIE and AAA holds the majority of Athene’s alternative investment portfolio. Apollo established AAA to provide a single vehicle through which investors may participate in a portfolio of alternative investments, including those managed by Apollo. Additionally, the Company believes AAA enhances its ability to increase alternative assets under management by raising capital from third parties, which allows it to achieve greater scale and diversification for alternatives. During the third quarter of 2024, AAA underwent a restructuring which resulted in a change in consolidation that reduced Athene’s non-controlling interests by $1.1 billion and did not represent a withdrawal from AAA.
247
During the fourth quarter of 2025, a portion of Athene’s investments in AAA were converted to investments in AAA Lux. As a result, Athene began consolidating AAA Lux as a VIE, which resulted in an increase in non-controlling interests of $2.0 billion. AAA Lux provides a single vehicle designed primarily for foreign investors to participate in a portfolio of alternative investments, including alternative investments in which AAA participates.
Athora
Athene had an amended and restated cooperation agreement with Athora, which was terminated effective August 5, 2025. Pursuant to this agreement, among other things, (1) for a period of 30 days from the receipt of notice of a cession, Athene had the right of first refusal to reinsure (i) up to 50 % of the liabilities ceded from Athora’s reinsurance subsidiaries to Athora Life Re Ltd. and (ii) up to 20 % of the liabilities ceded from a third party to any of Athora’s insurance subsidiaries, subject to a limitation in the aggregate of 20 % of Athora’s liabilities, and (2) Athora agreed to cause its insurance subsidiaries to consider the purchase of certain funding agreements and/or other spread instruments issued by Athene’s insurance subsidiaries, subject to a limitation that the fair market value of such funding agreements purchased by any of Athora’s insurance subsidiaries may generally not exceed 3 % of the fair market value of such subsidiary’s total assets. As of August 5, 2025, Athene had not exercised its right of first refusal to reinsure liabilities ceded to Athora’s insurance or reinsurance subsidiaries.
The following table summarizes Athene’s investments in Athora:
| (In millions) | December 31, 2025 | December 31, 2024 | |||||||||
| Investment fund | $ | $ | |||||||||
| Non-redeemable preferred equity and corporate debt securities | |||||||||||
| Total investment in Athora | $ | $ | |||||||||
Additionally, as of December 31, 2025 and December 31, 2024, Athene had $29 million and $57 million, respectively, of funding agreements outstanding to Athora. As of December 31, 2025, Athene had commitments to make additional investments in Athora of $2.7 billion, which primarily relate to a conditional commitment made in connection with the Athora transaction. See “—Athora” in the Asset Management section above for further details on the Athora transaction.
Atlas
Athene has an equity investment in Atlas, an asset-backed specialty lender, indirectly through its investments in AAA and AAA Lux and, as of December 31, 2025 and December 31, 2024, Athene held $5.7 billion and $3.2 billion, respectively, of AFS securities issued by Atlas or its affiliates. Athene also held $724 million of reverse repurchase agreements issued by Atlas as of December 31, 2024, which matured during the year ended December 31, 2025. As of December 31, 2025, Athene had commitments to make additional investments in Atlas of $1.8 billion. Additionally, see note 19 for further information on assurance letters issued in support of Atlas.
Catalina
Athene has a strategic modco reinsurance agreement with certain affiliates of Catalina to cede certain in force funding agreements. Athene elected the fair value option on this agreement and had a liability of $103 million and $221 million as of December 31, 2025 and December 31, 2024, respectively, which is included in other liabilities on the consolidated statements of financial condition. During the first quarter of 2024, Athene entered into a modco reinsurance agreement with Catalina to cede a quota share of certain of Athene’s retail deferred annuity products. As of December 31, 2025 and December 31, 2024, Athene had a reinsurance recoverable balance of $6.3 billion and $4.3 billion, respectively, related to this agreement.
Skylign
Athene has investments in Skylign Aviation Holdings, LP (“Skylign”), a leading aviation finance group focused on aviation lending and leasing, both directly through notes issued by PK AirFinance, a subsidiary of Skylign, and indirectly through its investments in AAA and AAA Lux. As of December 31, 2025 and December 31, 2024, Athene directly held $566 million and $1.6 billion, respectively, of Skylign notes, which are included in investments in related parties on the consolidated statements of financial condition.
248
Venerable
VA Capital Company LLC (“VA Capital”) is owned by a consortium of investors, led by affiliates of Apollo, Crestview Partners III Management, LLC and Reverence Capital Partners L.P., and is the parent of Venerable. Athene also has coinsurance and modco agreements with VIAC, which is a subsidiary of Venerable. VIAC is a related party due to Athene’s minority equity investment in VA Capital, which is included in investments in related parties on the consolidated statements of financial condition. Athene also has AFS securities and term loans receivable issued by Venerable. Athene’s investments in VA Capital and Venerable are summarized below.
| (In millions) | December 31, 2025 | December 31, 2024 | |||||||||
| AFS securities | $ | $ | |||||||||
| Investment fund | |||||||||||
| Term loans receivable | |||||||||||
| Total investments in VA Capital and Venerable | $ | $ | |||||||||
Effective July 1, 2023, VIAC recaptured $2.7 billion of reserves, which represented a portion of their business that was subject to those coinsurance and modco agreements. Athene recognized a gain of $555 million, which is included in other revenues on the consolidated statements of operations, in the third quarter of 2023 as a result of the settlement of the recapture agreement. As a result of Athene’s intent to transfer the assets supporting this business to VIAC in connection with the recapture, Athene was required by U.S. GAAP to recognize the unrealized losses on these assets of $104 million as intent-to-sell impairments in the second quarter of 2023.
Additionally, Athene consolidates AP Violet ATH Holdings, L.P (“AP Violet”). AP Violet’s investment fund primarily represents an interest in VA Capital and was $142 million and $106 million as of December 31, 2025 and December 31, 2024, respectively.
Wheels
Athene invests in Wheels Inc. (“Wheels”) indirectly through its investments in AAA and AAA Lux. As of December 31, 2025 and December 31, 2024, Athene also directly held $949 million and $1.0 billion, respectively, of AFS securities issued by Wheels, which are included in investments in related parties on the consolidated statements of financial condition. Athene also had commitments to make additional investments in Wheels of $60 million as of December 31, 2025.
Apollo/Athene Dedicated Investment Programs
Athene’s subsidiary, ACRA 1 is partially owned by ADIP I, a series of funds managed by Apollo. Athene’s subsidiary, ALRe, directly holds 37 % of the economic interests in ACRA 1 and all of ACRA 1’s voting interests, with ADIP I holding the remaining 63 % of the economic interests. Athene’s subsidiary, ACRA 2, is partially owned by ADIP II, a fund managed by Apollo. ADIP II owns 63 % of the economic interests in ACRA 2, with ALRe directly owning the remaining 37 % of the economic interests. ALRe holds all of ACRA 2’s voting interests.
Athene received capital contributions and paid distributions relating to ACRA of the following:
| Years ended December 31, | |||||||||||||||||
| (In millions) | 2025 | 2024 | 2023 | ||||||||||||||
| Contributions from ADIP | $ | $ | $ | ||||||||||||||
| Distributions to ADIP | ( | ( | ( | ||||||||||||||
During the fourth quarter of 2024, Athene purchased investments in ADIP I and ADIP II. As of December 31, 2025 and December 31, 2024, Athene held investments in ADIP of $231 million and $238 million, respectively, which are accounted for as equity method investments and included in investments in related parties on the consolidated statements of financial condition. As of December 31, 2025, Athene had commitments to make additional investments in ADIP of $343 million.
249
ARI
On January 27, 2026, Athene entered into a definitive agreement to acquire an approximately $9 billion portfolio of commercial mortgage loans from ARI. The purchase price will be based on 99.7 % of the total commitment amounts of the loans, subject to adjustments as provided in the definitive agreement. Completion of the transaction, which is expected to occur in the second quarter of 2026, is subject to approval by the holders of a majority of ARI’s outstanding shares of common stock and the satisfaction of customary closing conditions.
19. Commitments and Contingencies
Investment Commitments
The Company has unfunded capital commitments of $553 million as of December 31, 2025 related to the funds it manages. Separately, Athene had commitments to make investments, inclusive of related party commitments discussed previously and those of its consolidated VIEs, of $35.2 billion as of December 31, 2025. Athene’s commitments primarily include capital contributions to investment funds and mortgage loan commitments. The Company expects most of the current commitments will be invested over the next five years ; however, these commitments could become due any time upon counterparty request.
Contingent Obligations
Performance allocations with respect to certain funds are subject to reversal in the event of future losses to the extent of the cumulative revenues recognized in income to date. If all of the existing investments became worthless, the amount of cumulative revenues that have been recognized by Apollo through December 31, 2025 and that could be reversed approximates $6.0 billion. Performance allocations are affected by changes in the fair values of the underlying investments in the funds that Apollo manages. Valuations, on an unrealized basis, can be significantly affected by a variety of external factors including, but not limited to, bond yields and industry trading multiples. Movements in these items can affect valuations quarter to quarter even if the underlying business fundamentals remain stable. Management views the possibility of all of the investments becoming worthless as remote.
Additionally, at the end of the life of certain funds, Apollo may be obligated as general partner, to repay the funds’ performance allocations received in excess of what was ultimately earned. This obligation amount, if any, will depend on final realized values of investments at the end of the life of each fund or as otherwise set forth in the partnership agreement of the fund.
Certain funds may not generate performance allocations as a result of unrealized and realized losses that are recognized in the current and prior reporting periods. In certain cases, performance allocations will not be generated until additional unrealized and realized gains occur. Any appreciation would first cover the deductions for invested capital, unreturned organizational expenses, operating expenses, management fees and priority returns based on the terms of the respective fund agreements.
One of Apollo’s subsidiaries, AGS, provides underwriting commitments in connection with securities offerings of related parties of Apollo, including portfolio companies of the funds Apollo manages, as well as third parties. As of December 31, 2025, there were no open underwriting commitments.
AGS has entered into an arrangement with certain funds managed by State Street Global Advisors (“SSG”) to provide firm bids for certain securities sold to SSG managed funds. These firm bids are at market prices determined by AGS on an intra-daily basis, which if accepted by SSG, would obligate AGS to purchase the securities at such prices. The total obligation of AGS to provide these firm bids is limited to 25 % of the prior day’s end-of-day net asset value of the securities held by SSG that were originated from AGS, with an additional weekly cap set at 50 % of the net asset value from five trading days prior.
The Company, along with a third-party institutional investor, has committed to provide financing to a consolidated VIE that invests across Apollo’s capital markets platform (such VIE, the “Apollo Capital Markets Partnership”). Pursuant to these arrangements, the Company has committed equity financing to the Apollo Capital Markets Partnership. The Apollo Capital Markets Partnership also has a revolving credit facility with Sumitomo Mitsui Banking Corporation, as lead arranger, administrative agent and letter of credit issuer, Mizuho Bank Ltd., and other lenders party thereto, pursuant to which it may borrow up to $2.5 billion. The revolving credit facility, which has a final maturity date of October 15, 2027, is non-recourse to the Company, except that the Company provided customary comfort letters with respect to its capital contributions to the Apollo Capital Markets Partnership. As of December 31, 2025, the Apollo Capital Markets Partnership had funded commitments of $1.4 billion, on a net basis, to transactions across Apollo’s capital markets platform, all of which were funded
250
through the revolving credit facility and other asset-based financing. No capital had been funded by the Company to the Apollo Capital Markets Partnership pursuant to its commitment.
Whether the commitments of the Apollo Capital Markets Partnership are actually funded, in whole or in part, depends on the contractual terms of such commitments, including the satisfaction or waiver of any conditions to closing or funding. It is expected that between the time the Apollo Capital Markets Partnership makes a commitment and funding of such commitment, efforts will be made to syndicate such commitment to, among others, third parties, which should reduce its risk when committing to certain transactions. The Apollo Capital Markets Partnership may also, with respect to a particular transaction, enter into other arrangements with third parties which reduce its commitment risk.
In connection with the acquisition of Stone Tower in 2012, Apollo agreed to pay its former owners a specified percentage of future performance revenues earned from certain of its funds, CLOs, and strategic investment accounts. This obligation was determined based on the present value of estimated future performance revenue payments and is recorded in other liabilities. The fair value of the remaining contingent obligation was $72 million and $67 million as of December 31, 2025 and December 31, 2024, respectively. This contingent consideration obligation is remeasured to fair value at each reporting period until the obligations are satisfied. The changes in the fair value of the Stone Tower contingent consideration obligation is reflected in profit sharing expense within compensation and benefits in the consolidated statements of operations.
In connection with the acquisition of Griffin Capital’s U.S. asset management business on May 3, 2022, Apollo agreed to pay its former owners certain share-based consideration contingent on specified AUM and capital raising thresholds. This obligation was determined based on the present value of estimated future performance relative to such thresholds. During the second quarter of 2024, the specified capital raise thresholds were achieved, and the Company issued 742,742 shares of common stock to settle the share-based consideration obligation to Griffin Capital’s former owners. As of December 31, 2024, the remaining contingent obligation based on the specified AUM threshold was not met and the contingent obligation expired without satisfaction; therefore, there is no remaining contingent obligation outstanding. The Company recorded a loss of $58 million related to these contingent obligations in 2024. The changes in the fair value of the Griffin Capital contingent consideration obligation were reflected in other income (loss) in the consolidated statements of income through December 31, 2024.
Indemnifications and Contingent Performance Guarantees
In connection with the Bridge acquisition and consistent with standard business practices, Bridge has provided general indemnifications to certain officers and directors when they act in good faith in the performance of their duties for Bridge. Bridge’s maximum exposure under these arrangements cannot be determined as these indemnities relate to future claims that may be made against Bridge or related parties, but which have not yet occurred. No liability related to these indemnities has been recorded in the consolidated statements of financial condition as of December 31, 2025. Based on past experience, management believes that the risk of loss related to these indemnities is remote.
The Company may incur contingent liabilities for claims that may be made against it in the future. Bridge enters into contracts that contain a variety of representations, warranties and covenants. For example, Bridge and certain Bridge funds have provided non-recourse carve-out guarantees for fraud, willful misconduct and other customary wrongful acts, environmental indemnities, mechanics liens, and other performance guarantees. As of December 31, 2025, the aggregate notional amount of loans that Bridge provided contingent performance guarantees for under these arrangements is $758 million, and the Company’s liabilities for these matters would require a claim to be made against the Company in the future.
Funding Agreements
Athene is a member of the FHLB and, through its membership, has issued funding agreements to the FHLB in exchange for cash advances. As of December 31, 2025 and December 31, 2024, Athene had $23.3 billion and $15.6 billion, respectively, of FHLB funding agreements outstanding. Athene is required to provide collateral in excess of the funding agreement amounts outstanding, considering any discounts to the securities posted and prepayment penalties.
Athene has a FABN program, which allows Athene Global Funding, a special purpose, unaffiliated statutory trust, to offer its senior secured medium-term notes. Athene Global Funding uses the net proceeds from each sale to purchase one or more funding agreements from Athene. As of December 31, 2025 and December 31, 2024, Athene had $34.6 billion and $24.1 billion, respectively, of FABN funding agreements outstanding. Athene had $10.4 billion of board-authorized FABN capacity remaining as of December 31, 2025.
251
Athene also issues secured and other funding agreements. Secured funding agreements issued under Athene’s FABR programs involve special-purpose, unaffiliated entities entering into repurchase agreements with a third party, the proceeds of which are used by the special-purpose entities to purchase funding agreements from Athene. As of December 31, 2025 and December 31, 2024, Athene had $27.1 billion and $14.8 billion, respectively, of secured and other funding agreements outstanding, of which $21.0 billion and $12.0 billion were issued under the FABR program, respectively, and $6.1 billion and $2.8 billion were direct funding agreements, respectively.
Pledged Assets and Funds in Trust (Restricted Assets)
Athene’s restricted investments and cash balances included on the consolidated statements of financial condition are as follows:
| (In millions) | December 31, 2025 | December 31, 2024 | |||||||||
| AFS securities | $ | $ | |||||||||
| Trading securities | |||||||||||
| Equity securities | |||||||||||
| Mortgage loans | |||||||||||
| Investment funds | |||||||||||
| Derivative assets | |||||||||||
| Short-term investments | |||||||||||
| Other investments | |||||||||||
| Restricted cash and cash equivalents | |||||||||||
| Total restricted assets | $ | $ | |||||||||
The restricted assets are primarily related to reinsurance trusts established in accordance with coinsurance agreements and the FHLB and secured funding agreements described above.
Letters of Credit
Athene has undrawn letters of credit totaling $1.1 billion as of December 31, 2025. These letters of credit were issued for Athene’s reinsurance program and have expirations through June 19, 2028.
Atlas
In connection with the Company and CS’s previously announced transaction, whereby Atlas acquired certain assets of the CS Securitized Products Group, two subsidiaries of the Company have each issued an assurance letter to CS to guarantee the full five year deferred purchase obligation of Atlas in the amount of $3.3 billion. In March 2024, in connection with Atlas concluding its investment management agreement with CS, the deferred purchase obligation amount was reduced to $2.5 billion. In addition, certain strategic investors have made equity commitments to Atlas which therefore obligates these investors for a portion of the deferred purchase obligation. The Company’s guarantee is not probable of payment, therefore, there is no liability on the Company’s consolidated financial statements.
Litigation and Regulatory Matters
The Company is party to various legal actions arising from time to time in the ordinary course of business, including claims and lawsuits, arbitrations, reviews, investigations or proceedings by governmental and self-regulatory agencies regarding the Company’s business.
On December 21, 2017, several entities referred to collectively as “Harbinger” commenced an action in New York Supreme Court captioned Harbinger Capital Partners II LP et al. v. Apollo Global Management LLC, et al. (No. 657515/2017). The complaint named as defendants AAM, and funds managed by Apollo that invested in SkyTerra Communications, Inc. (“SkyTerra”), among others. The complaint alleged that during the period of Harbinger’s various equity and debt investments in SkyTerra from 2004 to 2010, the defendants concealed from Harbinger material defects in SkyTerra technology. The complaint further alleged that Harbinger would not have made investments in SkyTerra totaling approximately $1.9 billion had it known of the defects, and that the public disclosure of these defects ultimately led to SkyTerra filing for bankruptcy in 2012 (after it had been renamed LightSquared). The complaint sought $1.9 billion in damages, as well as punitive damages, interest, costs, and fees. On June 12, 2019, Harbinger voluntarily discontinued the state action without prejudice. On June 8, 2020, Harbinger
252
refiled its litigation in New York Supreme Court, captioned Harbinger Capital Partners II, LP et al. v. Apollo Global Management, LLC et al. (No. 652342/2020). The complaint added eight new defendants and three new claims relating to Harbinger’s contention that the new defendants induced Harbinger to buy CCTV One Four Holdings, LLC (“CCTV”) to support SkyTerra’s network even though they allegedly knew that the network had material defects. On November 23, 2020, Defendants filed in bankruptcy court a motion to reopen LightSquared’s bankruptcy proceedings, and on November 24, 2020, filed in the state court a motion to stay the state court proceedings pending a ruling by the bankruptcy court on the bankruptcy motion. On February 1, 2021, the bankruptcy court denied the bankruptcy motion. Defendants filed their motions to dismiss the New York Supreme Court action on March 31, 2021, which were granted in part and denied in part on May 23, 2023. The court granted in full the Defendants’ motions to dismiss Harbinger’s complaint as time-barred and denied as moot the Defendants’ motion to dismiss the complaint for failure to state a claim. On March 18, 2025, the New York Supreme Court Appellate Division, First Department affirmed the court’s ruling. On April 17, 2025, plaintiffs filed a motion for re-argument or, in the alternative, leave to appeal to the Court of Appeals, which the First Department denied on July 24, 2025. On August 25, 2025, Harbinger filed a motion for leave to appeal to the Court of Appeals. On September 22, 2025, Apollo filed its opposition to Harbinger’s motion for leave to appeal. Apollo believes the claims in this action are without merit. No reasonable estimate of possible loss, if any, can be made at this time.
On August 17, 2023, a purported stockholder of AGM filed a shareholder derivative complaint (the “Original Complaint”) in the Court of Chancery of the State of Delaware against current AGM directors Marc Rowan, Scott Kleinman, and James Zelter, former AGM directors Alvin Krongard, Michael Ducey, and Pauline Richards, Apollo Former Managing Partners Leon Black and Joshua Harris, and, as a nominal defendant, AGM. The action is captioned Anguilla Social Security Board vs. Black et al., C.A. No. 2023-0846-JTL and challenges the $570 million payments being made to the Former Managing Partners and Contributing Partners in connection with the elimination of the Up-C structure that was in place prior to Apollo’s merger with Athene. As previously disclosed in Apollo’s SEC filings, this purported stockholder previously had sought and received documents relating to the transaction pursuant to Section 220 of the Delaware General Corporation Law. The Original Complaint alleged that the challenged payments amount to corporate waste, that the Former Managing Partners and Contributing Partners received payments in connection with the Corporate Recapitalization that exceed fair value and therefore breached their fiduciary duties, and that the independent conflicts committee of the AAM board of directors (which then consisted of Mr. Krongard, Mr. Ducey, and Ms. Richards) that negotiated the elimination of the TRA breached their fiduciary duties. The Original Complaint alleged that pre-suit demand was futile because a majority of AGM’s board is either not independent from the Former Managing Partners or face a substantial likelihood of liability in light of the challenges to the transaction. The Original Complaint sought, among other things, declaratory relief, unspecified monetary damages, interest, restitution, disgorgement, injunctive relief, costs, and attorneys’ fees. On November 16, 2023, the defendants moved to dismiss the Original Complaint on the basis that, among other things, the plaintiff failed to make a pre-suit demand on the Apollo board of directors. On February 9, 2024, the plaintiff filed an amended complaint (the “Amended Complaint”) that adds new factual allegations but names the same defendants, asserts the same causes of action, and seeks the same relief as the Original Complaint. The Amended Complaint alleges that pre-suit demand was futile for the same reasons alleged in the Original Complaint. On April 25, 2024, the defendants moved to dismiss the Amended Complaint. On September 20, 2024, the Court of Chancery denied the defendants’ motion to dismiss. AGM and the defendants filed answers to the Amended Complaint on November 25, 2024. On October 28, 2024, the AGM board of directors adopted resolutions forming a Special Litigation Committee (the “SLC”) comprising directors whom the board determined to be independent and disinterested. The AGM board of directors delegated to the SLC, among other things, the full and exclusive power and authority of the board to investigate, review and evaluate the facts and circumstances asserted in the litigation and determine whether pursuing the litigation is in the best interests of AGM and its stockholders. Pursuant to an order of the court, all proceedings in the litigation are stayed until April 30, 2026. No reasonable estimate of possible loss, if any, can be made at this time.
On March 14, 2024, a purported stockholder of AGM filed a class action complaint in the Court of Chancery of the State of Delaware against AGM. The complaint alleges, among other things, that certain provisions of the stockholders agreement, entered into on January 1, 2022 between AGM and the Former Managing Partners, violate Delaware law. Apollo believes the claims in this action are without merit. On July 11, 2024, AGM moved to dismiss. On August 7, 2024, the court entered an order staying the motion to dismiss pending the resolution of the appeal of the decision in West Palm Beach Firefighters’ Pension Fund v. Moelis & Co., 311 A.3d 809 (Del. Ch. 2024). The stay expired on January 20, 2026. Pursuant to an order of the court issued on February 4, 2026, briefing on Apollo’s motion to dismiss will resume with plaintiff’s opposition to the motion, which is to be filed on March 6, 2026. No reasonable estimate of possible loss, if any, can be made at this time.
253
Following assertions made by German tax authorities regarding historical transactions in one of the Company’s funds, the Company voluntarily disclosed certain internal reorganization transactions of fund entities to these authorities. While no tax assessment has been received to date with respect to such reorganizations, the Company believes the German tax authorities may seek assessments and any potential assessment could be material. The Company believes no such tax is due and intends to contest any assessment vigorously. At this time, the Company cannot reasonably estimate any potential loss.
Guaranty Association Assessments
Guaranty associations may subject member insurers, including Athene, to assessments that require the insurers to pay funds to cover contractual obligations under insurance policies issued by insurance companies that become impaired or insolvent. The assessments are based on an insurer’s proportionate share of premiums written in that state during a specified one-year or three-year period for lines of business in which the impaired or insolvent insurer engaged, subject to prescribed limits.
On December 30, 2022, the North Carolina Wake County Superior Court entered an Order of Liquidation (“Liquidation Order”) against Bankers Life Insurance Company (“BLIC”) and Colorado Bankers Life Insurance Company (“CBLIC”), which was affirmed by the North Carolina Court of Appeals on March 5, 2024. On April 9, 2024, GBIG Holdings, LLC (“GBIG”), the sole shareholder of BLIC and CBLIC, filed a Petition for Discretionary Review requesting the North Carolina Supreme Court review the decision by the North Carolina Court of Appeals to affirm the Liquidation Order. On July 11, 2024, GBIG filed a Motion to Withdraw its Petition for Discretionary Review. The North Carolina Supreme Court granted the Motion to Withdraw on August 23, 2024, which made the Liquidation Order effective on November 30, 2024. Athene was not a party to this litigation. Guaranty associations began levying assessments in connection with these liquidations in 2024. During the year ended December 31, 2024, Athene recorded guaranty association expenses related to the BLIC and CBLIC insolvencies of $152 million, which were net of $11 million that Athene expected to recover through future premium tax credits. As of December 31, 2024, the consolidated statements of financial position included a liability of $18 million. As of December 31, 2025, the potential assessments from the guaranty associations were no longer considered material to Athene, and calculations are no longer being updated. Accordingly, Athene did not record any material amounts related to the BLIC or CBLIC insolvencies during the year ended December 31, 2025.
20. Statutory Requirements
Athene’s insurance and reinsurance subsidiaries are subject to insurance laws and regulations in the jurisdictions in which they operate, including Bermuda and the U.S. Certain regulations include restrictions that limit the dividends or other distributions, such as loans or cash advances, available to stockholders without prior approval of the insurance regulatory authorities. The differences between financial statements prepared for insurance regulatory authorities and U.S. GAAP financial statements vary by jurisdiction.
Bermuda Statutory Requirements
ALRe, AARe, Athene Co-Invest Reinsurance Affiliate 1A Ltd. (“ACRA 1A”) and Athene Co-Invest Reinsurance Affiliate 2A Ltd. (“ACRA 2A”) are each licensed by the BMA as long-term insurers and are subject to the Insurance Act 1978, as amended (the “Bermuda Insurance Act”) and regulations promulgated thereunder. The BMA implemented the Economic Balance Sheet (the “EBS”) framework into the BSCR, which was granted equivalence to the European Union’s Directive (2009/138/EC) (“Solvency II”). The insurer must have a BSCR ratio of 100 % or greater to be considered solvent by the BMA.
Under the Bermuda Insurance Act, long-term insurers are required to maintain minimum statutory capital and surplus to meet the minimum margin of solvency (“MMS”) and minimum economic statutory capital and surplus (EBS capital and surplus) to meet the ECR. For Athene’s Class C reinsurers, ACRA 1A and ACRA 2A, MMS is equal to the greater of $500,000 , 1.5 % of the total statutory assets or 25 % of ECR. For Athene’s Class E reinsurers, ALRe and AARe, MMS is equal to the greater of $8 million, 2 % of the first $500 million of statutory assets plus 1.5 % of statutory assets above $500 million or 25 % of ECR. For each class, the ECR is calculated based on a risk-based capital model where risk factor charges are applied to the EBS. The ECR is floored at the MMS. For Athene’s Bermuda reinsurance subsidiaries, the ECR is the binding regulatory constraint. As of December 31, 2025 and December 31, 2024, Athene’s Bermuda reinsurance subsidiaries EBS capital and surplus resulted in a BSCR ratio in excess of TCL. While not specifically referred to in the Bermuda Insurance Act, TCL is also an important threshold for statutory capital and surplus. TCL is equal to 120 % of ECR, as calculated pursuant to the BSCR formula, and serves as an early warning tool for the BMA.
254
Amounts reported for Athene’s Bermuda entities within these statutory disclosures exclude the impact of any deferred taxes related to Bermuda CIT for periods prior to January 1, 2025.
Under the Bermuda statutory framework, statutory financial statements are generally equivalent to U.S. GAAP financial statements, with the exception of prudential filters and permitted practices granted by the BMA. Athene’s Bermuda subsidiaries have permission in the statutory financial statements to use amortized cost instead of fair value as the basis for certain investments. Additionally, Athene’s Bermuda subsidiaries use U.S. statutory reserving principles for the calculation of insurance reserves instead of U.S. GAAP, subject to the reserves being proved adequate based on cash flow testing. The following represents the effect of the permitted practices to the statutory financial statements:
| December 31, 2025 | |||||||||||||||||||||||
| (In millions) | ALRe | AARe | ACRA 1A | ACRA 2A | |||||||||||||||||||
| Increase (decrease) to capital and surplus due to permitted practices | $ | $ | $ | $ | |||||||||||||||||||
| Increase (decrease) to statutory net income due to permitted practices | ( | ( | ( | ||||||||||||||||||||
Under the Bermuda Insurance Act, Athene’s Bermuda subsidiaries are prohibited from paying a dividend in an amount exceeding 25% of the prior year’s statutory capital and surplus, unless at least two members of the companies’ respective board of directors and its principal representative in Bermuda sign and submit to the BMA an affidavit attesting that a dividend in excess of this amount would not cause the subsidiary to fail to meet its relevant margins. In certain instances, the Bermuda subsidiary would also be required to provide prior notice to the BMA in advance of the payment of dividends. In the event that such an affidavit is submitted to the BMA, and further subject to meeting the MMS and ECR requirements, a Bermuda subsidiary is permitted to distribute up to the sum of 100% of statutory surplus and an amount less than 15% of statutory capital. Distributions in excess of this amount require the approval of the BMA. The following represents the maximum distribution Athene’s Bermuda subsidiaries would be permitted to remit to its parent without the need for prior approval:
| (In millions) | December 31, 2025 | December 31, 2024 | |||||||||
| ALRe | $ | $ | |||||||||
| AARe | |||||||||||
| ACRA 1A | |||||||||||
| ACRA 2A | |||||||||||
U.S. Statutory Requirements
Athene’s primary regulated U.S. subsidiaries and the corresponding insurance regulatory authorities are as follows:
| Subsidiary | Regulatory Authority | |||||||
| AAIA | Iowa Insurance Division | |||||||
| AANY | New York Department of Financial Services | |||||||
| Athene Re USA IV | State of Vermont Department of Financial Regulation | |||||||
Each entity’s statutory statements are presented on the basis of accounting practices determined by the respective regulatory authority. The regulatory authority recognizes only statutory accounting practices prescribed or permitted by the corresponding state for determining and reporting the financial condition and results of operations of an insurance company and for determining its solvency under insurance law.
Each of the Athene domiciliary states have adopted requirements for our regulated U.S. subsidiaries to submit a Risk-Based Capital report annually, which compares an insurer’s total adjusted capital (“TAC”) to its authorized control level RBC (“ACL”), each such term as defined pursuant to applicable state law. A company’s RBC is calculated by using a specified formula that applies factors to various risks inherent in the insurer’s operations, including risks attributable to its assets, underwriting experience, interest rates and other business expenses. Statutory RBC is measured on two bases, ACL and company action level RBC (“CAL”), with ACL calculated as one-half of CAL. The annual RBC report is used by regulators to set in motion appropriate regulatory actions relating to insurers that show indications of weak or deteriorating status. As of
255
December 31, 2025 and December 31, 2024, each of Athene’s U.S. insurance subsidiaries’ TAC was significantly in excess of the levels that would prompt regulatory action under the laws of the Athene domiciliary states.
The maximum dividend these subsidiaries can pay to stockholders, without prior approval of the respective state insurance department, is subject to restrictions relating to statutory surplus or net gain from operations. The maximum dividend payment over a twelve-month period may not, without prior approval, be paid from a source other than earned surplus and may not exceed the greater of (1) the prior year’s net gain from operations or (2) 10% of prior year’s policyholders’ surplus. Based on these restrictions, the maximum dividend AAIA could pay to its parent absent regulatory approval was $0
In some instances, the states of domicile of U.S. subsidiaries have adopted prescribed accounting practices that differ from the required accounting outlined in NAIC Statutory Accounting Principles (“SAP”). These subsidiaries also have certain accounting practices permitted by the states of domicile that differ from those found in NAIC SAP. These prescribed and permitted practices are described as follows:
AAIA
Among the products issued by AAIA are indexed universal life insurance and indexed annuities. These products allow a portion of the premium to earn interest based on certain indices, including the S&P 500 and other bespoke indices. Athene purchases call options, futures and variance swaps to hedge the growth in interest credited to the customer as a direct result of increases in the related index. The Iowa Insurance Division allows an insurer to elect (1) to use an amortized cost method to account for certain derivative instruments, such as call options, purchased to hedge the growth in interest credited to the customer on indexed insurance products and (2) to use an indexed annuity reserve calculation methodology under which call options associated with the current index interest crediting term are valued at zero. AAIA has elected to apply this option to its over-the-counter call options and reserve liabilities. As a result of the practice described above, AAIA’s statutory surplus, net of reinsurance, decreased by $52 million and increased by $38 million as of December 31, 2025 and December 31, 2024, respectively.
Athene Re USA IV
AAIA has ceded the AmerUs Closed Block to Athene Re USA IV on a 100% funds withheld basis. A permitted practice in the State of Vermont allows Athene Re USA IV to include as admitted assets the face amount of all issued and outstanding letters of credit used to fund its reinsurance obligations to AAIA in its statutory financial statements. If Athene Re USA IV had not followed this permitted practice, then it would not have exceeded authorized control level risk based capital requirements. As of December 31, 2025 and December 31, 2024, Athene Re USA IV included as admitted assets $76 million and $86 million, respectively, related to the outstanding letters of credit.
Statutory capital and surplus and net income (loss)
The following table presents, for each of Athene’s primary insurance subsidiaries, the best estimates of statutory capital and surplus and the statutory net income (loss) as of the date these financial statements were issued:
| Statutory capital & surplus | Statutory net income (loss) | ||||||||||||||||||||||||||||
| December 31, | Years ended December 31, | ||||||||||||||||||||||||||||
| (In millions) | 2025 | 2024 | 2025 | 2024 | 2023 | ||||||||||||||||||||||||
| ALRe | $ | $ | $ | $ | $ | ||||||||||||||||||||||||
| AARe | |||||||||||||||||||||||||||||
| ACRA 1A | ( | ||||||||||||||||||||||||||||
| ACRA 2A | ( | ||||||||||||||||||||||||||||
| AAIA | ( | ||||||||||||||||||||||||||||
| AANY | ( | ||||||||||||||||||||||||||||
The statutory capital and surplus and net income (loss) of our Bermuda entities as of and for the year ended December 31, 2025 include the impact of deferred tax assets related to Bermuda CIT. Due to the January 2026 Bermuda CIT revocation as described in note 13, AARe will record a full valuation allowance in the first quarter of 2026. ACRA 1A and ACRA 2A will reverse the Bermuda CIT deferred tax assets and liabilities previously recorded. This change would have resulted in AARe,
256
ACRA 1A and ACRA 2A’s December 31, 2025 statutory capital and surplus increasing (decreasing) by $(847 ) million, $164 million, and $(45 ) million, respectively.
21. Segments
The Company conducts its business through three reportable segments: (i) Asset Management, (ii) Retirement Services and (iii) Principal Investing. Segment information is utilized by the Company’s chief operating decision maker (“CODM”) to assess performance and to allocate resources. AGM’s CEO is the CODM, who is also solely responsible for decisions related to the allocation of resources on a company-wide basis.
For each segment, the CODM uses the key measure of Segment Income to allocate resources (including employees, financial or capital resources) to that segment in the annual budget and forecasting process. The performance is measured by the Company’s chief operating decision maker on an unconsolidated basis because the chief operating decision maker makes operating decisions and assesses the performance of each of the Company’s business segments based on financial and operating metrics and data that exclude the effects of consolidation of any of the affiliated funds.
Segment Income
Segment Income is the key performance measure used by management in evaluating the performance of the asset management, retirement services, and principal investing segments. Management uses Segment Income to make key operating decisions such as the following:
•decisions related to the allocation of resources such as staffing decisions, including hiring and locations for deployment of the new hires;
•decisions related to capital deployment such as providing capital to facilitate growth for the business and/or to facilitate expansion into new businesses;
•decisions related to expenses, such as determining annual discretionary bonuses and equity-based compensation awards to its employees. With respect to compensation, management seeks to align the interests of certain professionals and selected other individuals with those of the investors in the funds and those of Apollo’s stockholders by providing such individuals a profit sharing interest in the performance fees earned in relation to the funds. To achieve that objective, a certain amount of compensation is based on Apollo’s performance and growth for the year; and
•decisions related to the amount of earnings available for dividends to common stockholders and holders of equity-based awards that participate in dividends.
Segment Income is a measure of profitability and has certain limitations in that it does not take into account certain items included under U.S. GAAP. Segment Income is the sum of (i) Fee Related Earnings, (ii) Spread Related Earnings and (iii) Principal Investing Income. Segment Income excludes the effects of the consolidation of any of the related funds, interest and other financing costs related to AGM not attributable to any specific segment, taxes and related payables, transaction-related charges and other non-operating expenses. Transaction-related charges includes equity-based compensation charges, the amortization of intangible assets, contingent consideration, and certain other charges associated with acquisitions, and restructuring charges. Non-operating expenses include certain charitable contributions and other non-operating expenses. In addition, Segment Income excludes non-cash revenue and expense related to equity awards granted by unconsolidated related parties to employees of the Company, compensation and administrative related expense reimbursements, as well as the assets, liabilities and operating results of the funds and VIEs that are included in the consolidated financial statements.
Segment Income may not be comparable to similarly titled measures used by other companies and is not a measure of performance calculated in accordance with U.S. GAAP. We use Segment Income as a measure of operating performance, not as a measure of liquidity. Segment Income should not be considered in isolation or as a substitute for net income or other income data prepared in accordance with U.S. GAAP. The use of Segment Income without consideration of related U.S. GAAP measures is not adequate due to the adjustments described above. Management compensates for these limitations by using Segment Income as a supplemental measure to U.S. GAAP results, to provide a more complete understanding of our performance as management measures it. A reconciliation of Segment Income to its most directly comparable U.S. GAAP measure of income (loss) before income tax provision can be found in this note.
257
Fee Related Earnings
Fee Related Earnings (“FRE”) is a component of Segment Income that is used to assess the performance of the Asset Management segment. FRE is the sum of (i) management fees, (ii) capital solutions and other related fees, (iii) fee-related performance fees from indefinite term vehicles, that are measured and received on a recurring basis and not dependent on realization events of the underlying investments, excluding performance fees from Athene and performance fees from origination platforms dependent on capital appreciation, and (iv) other income, net, less (a) fee-related compensation, excluding equity-based compensation, (b) non-compensation expenses incurred in the normal course of business, (c) placement fees and (d) non-controlling interests in the management companies of certain funds the Company manages.
Spread Related Earnings
Spread Related Earnings (“SRE”) is a component of Segment Income that is used to assess the performance of the Retirement Services segment, excluding certain market volatility, which consists of investment gains (losses), net of offsets, and non-operating change in insurance liabilities and related derivatives, and certain expenses related to integration, restructuring, and equity-based compensation, as well as other items. For the Retirement Services segment, SRE equals the sum of (i) the net investment earnings on Athene’s net invested assets and (ii) management fees received on business managed for others, less (x) cost of funds, (y) operating expenses excluding equity-based compensation and (z) financing costs, including interest expense and preferred dividends, if any, paid to Athene preferred stockholders.
Principal Investing Income
Principal Investing Income (“PII”) is a component of Segment Income that is used to assess the performance of the Principal Investing segment. For the Principal Investing segment, PII is the sum of (i) realized performance fees, including certain realizations received in the form of equity, and (ii) realized investment income, less (x) realized principal investing compensation expense, excluding expense related to equity-based compensation, and (y) certain corporate compensation and non-compensation expenses.
258
The following presents financial data for the Company’s reportable segments.
| Years ended December 31, | |||||||||||||||||
| (In millions) | 2025 | 2024 | 2023 | ||||||||||||||
Asset Management | |||||||||||||||||
Management fees1 | $ | $ | $ | ||||||||||||||
| Capital solutions fees and other, net | |||||||||||||||||
| Fee-related performance fee | |||||||||||||||||
| Fee-related compensation | ( | ( | ( | ||||||||||||||
| Other operating expenses | ( | ( | ( | ||||||||||||||
| Fee Related Earnings | |||||||||||||||||
| Retirement Services | |||||||||||||||||
| Fixed income and other net investment income | |||||||||||||||||
| Alternative net investment income | |||||||||||||||||
| Strategic capital management fees | |||||||||||||||||
| Cost of funds | ( | ( | ( | ||||||||||||||
| Other operating expenses | ( | ( | ( | ||||||||||||||
| Interest and other financing costs | ( | ( | ( | ||||||||||||||
| Spread Related Earnings | |||||||||||||||||
| Principal Investing | |||||||||||||||||
Realized performance fees2 | |||||||||||||||||
| Realized investment income | ( | ||||||||||||||||
| Principal investing compensation | ( | ( | ( | ||||||||||||||
| Other operating expenses | ( | ( | ( | ||||||||||||||
| Principal Investing Income | |||||||||||||||||
| Segment Income | $ | $ | $ | ||||||||||||||
| Years ended December 31, | |||||||||||||||||
| (In millions) | 2025 | 2024 | 2023 | ||||||||||||||
| Segment Revenue | |||||||||||||||||
Asset Management1 | $ | $ | $ | ||||||||||||||
| Retirement Services | |||||||||||||||||
Principal Investing2 | |||||||||||||||||
| Total Segment Revenue | $ | $ | $ | ||||||||||||||
| (In millions) | December 31, 2025 | December 31, 2024 | |||||||||
| Segment Assets | |||||||||||
| Asset Management | $ | $ | |||||||||
| Retirement Services | |||||||||||
| Principal Investing | |||||||||||
| Total Assets | $ | $ | |||||||||
1 Includes intersegment management fees from Retirement Services of $ | |||||||||||
2 Includes intersegment realized performance fees from Retirement Services of $ | |||||||||||
259
The following presents the reconciliation of Segment Income and Segment Revenue to income (loss) before income tax (provision) benefit and total revenues reported in the consolidated statements of operations:
| Years ended December 31, | |||||||||||||||||
| (In millions) | 2025 | 2024 | 2023 | ||||||||||||||
| Segment Income | $ | $ | $ | ||||||||||||||
Asset Management Adjustments: | |||||||||||||||||
Equity-based profit sharing expense1,5 | ( | ( | ( | ||||||||||||||
| Equity-based compensation | ( | ( | ( | ||||||||||||||
| Net (income) loss attributable to non-controlling interests in consolidated entities | |||||||||||||||||
Unrealized performance fees5 | ( | ||||||||||||||||
Unrealized profit sharing expense5 | ( | ( | |||||||||||||||
HoldCo interest and other financing costs2 | ( | ( | ( | ||||||||||||||
Unrealized principal investment (income) loss5 | ( | ||||||||||||||||
Unrealized net (gains) losses from investment activities5 | ( | ||||||||||||||||
Transaction-related costs, restructuring and other non-operating expenses3 | ( | ( | ( | ||||||||||||||
| Retirement Services Adjustments: | |||||||||||||||||
| Investment gains (losses), net of offsets | |||||||||||||||||
Non-operating change in insurance liabilities and related derivatives4 | |||||||||||||||||
| Integration, restructuring and other non-operating items | ( | ( | ( | ||||||||||||||
| Equity-based compensation | ( | ( | ( | ||||||||||||||
| Income (loss) before income tax (provision) benefit | $ | $ | $ | ||||||||||||||
1 Equity-based profit sharing expense includes stock-based grants that are tied to realized performance within the Principal Investing segment. | |||||||||||||||||
2 Represents interest and other financing costs related to AGM not attributable to any specific segment. | |||||||||||||||||
3 Transaction-related costs, restructuring and other non-operating expenses includes: (a) contingent consideration, certain equity-based charges, amortization of intangible assets and certain other expenses associated with acquisitions; (b) gains (losses) from changes in the tax receivable agreement liability; (c) merger-related transaction and integration costs associated with Company’s merger with Athene and (d) other non-operating expenses, including the issuance of shares of AGM common stock for charitable contributions. In the year ended December 31, 2025, other non-operating expenses includes $ | |||||||||||||||||
4 Includes change in fair values of derivatives and embedded derivatives, non-operating change in funding agreements, change in fair value of market risk benefits, and non-operating change in liability for future policy benefits. | |||||||||||||||||
5 Represents adjustments that primarily impact the Principal Investing segment. | |||||||||||||||||
260
| Years ended December 31, | |||||||||||||||||
| (In millions) | 2025 | 2024 | 2023 | ||||||||||||||
| Segment Revenues | $ | $ | $ | ||||||||||||||
Asset Management Adjustments: | |||||||||||||||||
Adjustments related to consolidated funds and VIEs1 | |||||||||||||||||
Performance fees2 | ( | ||||||||||||||||
Principal investment income (loss)2 | |||||||||||||||||
Equity awards granted by unconsolidated related parties, reimbursable expenses and other1 | |||||||||||||||||
| Retirement Services Adjustments: | |||||||||||||||||
Premiums, product charges, investment related gains (losses) and other retirement services revenue3 | |||||||||||||||||
| Change in fair value of reinsurance assets | ( | ||||||||||||||||
| Forward points adjustment on FX derivative hedges | ( | ( | ( | ||||||||||||||
| Held-for-trading amortization | |||||||||||||||||
| Reinsurance impacts | |||||||||||||||||
| ACRA non-controlling interests on net investment earnings | |||||||||||||||||
| Other retirement services adjustments | ( | ( | ( | ||||||||||||||
| Total Revenues | $ | $ | $ | ||||||||||||||
1 Represents advisory fees, management fees and performance fees earned from consolidated VIEs which are eliminated in consolidation. Includes non-cash revenues related to equity awards granted by unconsolidated related parties to employees of the Company and certain compensation and administrative related expense reimbursements. | |||||||||||||||||
2 Represents adjustments that primarily impact the Principal Investing segment. | |||||||||||||||||
3 Refer to the consolidated statements of operations for a breakout of individual items. | |||||||||||||||||
The following table presents the reconciliation of the Company’s total reportable segment assets to total assets:
| (In millions) | December 31, 2025 | December 31, 2024 | |||||||||
| Total reportable segment assets | $ | $ | |||||||||
Adjustments1 | |||||||||||
| Total Assets | $ | $ | |||||||||
1 Represents the addition of assets of consolidated funds and VIEs and consolidation elimination adjustments. | |||||||||||
Geographic Information
The Company conducts its asset management business primarily in the U.S. with domestically generated revenues making up 63 %, 58 % and 66 % of total asset management GAAP revenues for the years ended December 31, 2025, 2024 and 2023, respectively.
The table below presents the percentage of total asset management GAAP revenues attributed to the Company’s region of domicile and attributed to all foreign regions which the Company derives its revenues. Revenues attributed to a geographic region are generally based on the country of domicile of the Apollo funds.
| Years ended December 31, | |||||||||||||||||
| 2025 | 2024 | 2023 | |||||||||||||||
| Asset Management | |||||||||||||||||
| Americas | % | % | % | ||||||||||||||
| Europe, Middle East and Africa | |||||||||||||||||
| Asia-Pacific | |||||||||||||||||
| % | % | % | |||||||||||||||
261
22. Subsequent Events
Dividends
On February 9, 2026, the Company declared a cash dividend of $0.51 per share of common stock, which will be paid on February 27, 2026 to holders of record at the close of business on February 19, 2026.
On February 9, 2026, the Company also declared and set aside for payment a cash dividend of $0.8438 per share of its Mandatory Convertible Preferred Stock, which will be paid on April 30, 2026 to holders of record at the close of business on April 15, 2026.
262
ITEM 8A. UNAUDITED SUPPLEMENTAL PRESENTATION OF STATEMENTS OF FINANCIAL CONDITION
| December 31, 2025 | |||||||||||||||||||||||
| (In millions) | Apollo Global Management, Inc. and Consolidated Subsidiaries1 | Consolidated Funds and VIEs | Eliminations | Consolidated | |||||||||||||||||||
| Assets | |||||||||||||||||||||||
| Asset Management | |||||||||||||||||||||||
| Cash and cash equivalents | $ | 3,350 | $ | — | $ | — | $ | 3,350 | |||||||||||||||
| Restricted cash and cash equivalents | 19 | — | — | 19 | |||||||||||||||||||
| Investments | 6,750 | — | (524) | 6,226 | |||||||||||||||||||
| Assets of consolidated variable interest entities | |||||||||||||||||||||||
| Cash and cash equivalents | 5 | 322 | — | 327 | |||||||||||||||||||
| Investments | 431 | 3,211 | (133) | 3,509 | |||||||||||||||||||
| Due from related parties | 16 | — | — | 16 | |||||||||||||||||||
| Other assets | 30 | 325 | (125) | 230 | |||||||||||||||||||
| Due from related parties | 728 | — | (81) | 647 | |||||||||||||||||||
| Goodwill | 1,848 | — | — | 1,848 | |||||||||||||||||||
| Other assets | 3,376 | — | — | 3,376 | |||||||||||||||||||
| 16,553 | 3,858 | (863) | 19,548 | ||||||||||||||||||||
| Retirement Services | |||||||||||||||||||||||
| Cash and cash equivalents | 14,994 | — | — | 14,994 | |||||||||||||||||||
| Restricted cash and cash equivalents | 1,332 | — | — | 1,332 | |||||||||||||||||||
| Investments | 321,757 | — | (676) | 321,081 | |||||||||||||||||||
| Investments in related parties | 52,251 | — | (17,272) | 34,979 | |||||||||||||||||||
| Assets of consolidated variable interest entities | |||||||||||||||||||||||
| Cash and cash equivalents | 23 | 546 | — | 569 | |||||||||||||||||||
| Investments | 1,596 | 28,578 | (182) | 29,992 | |||||||||||||||||||
| Other assets | 4 | 342 | — | 346 | |||||||||||||||||||
| Reinsurance recoverable | 10,282 | — | — | 10,282 | |||||||||||||||||||
| Deferred acquisition costs, deferred sales inducements and value of business acquired | 8,634 | — | — | 8,634 | |||||||||||||||||||
| Goodwill | 4,072 | — | — | 4,072 | |||||||||||||||||||
| Other assets | 15,177 | — | (57) | 15,120 | |||||||||||||||||||
| 430,122 | 29,466 | (18,187) | 441,401 | ||||||||||||||||||||
| Total Assets | $ | 446,675 | $ | 33,324 | $ | (19,050) | $ | 460,949 | |||||||||||||||
| (Continued) | |||||||||||||||||||||||
263
| December 31, 2025 | |||||||||||||||||||||||
| (In millions) | Apollo Global Management, Inc. and Consolidated Subsidiaries1 | Consolidated Funds and VIEs | Eliminations | Consolidated | |||||||||||||||||||
| Liabilities, Redeemable non-controlling interests and Equity | |||||||||||||||||||||||
| Liabilities | |||||||||||||||||||||||
| Asset Management | |||||||||||||||||||||||
| Accounts payable, accrued expenses, and other liabilities | $ | 3,861 | $ | — | $ | — | $ | 3,861 | |||||||||||||||
| Due to related parties | 1,165 | — | (103) | 1,062 | |||||||||||||||||||
| Debt | 5,516 | — | — | 5,516 | |||||||||||||||||||
| Liabilities of consolidated variable interest entities | |||||||||||||||||||||||
| Debt, at fair value | — | 177 | (177) | — | |||||||||||||||||||
| Accounts payable, accrued expenses, and other liabilities | 141 | 1,859 | (51) | 1,949 | |||||||||||||||||||
| 10,683 | 2,036 | (331) | 12,388 | ||||||||||||||||||||
| Retirement Services | |||||||||||||||||||||||
| Interest sensitive contract liabilities | 315,889 | — | — | 315,889 | |||||||||||||||||||
| Future policy benefits | 50,264 | — | — | 50,264 | |||||||||||||||||||
| Market risk benefits | 4,930 | — | — | 4,930 | |||||||||||||||||||
| Debt | 7,848 | — | — | 7,848 | |||||||||||||||||||
| Payables for collateral on derivatives and securities to repurchase | 11,085 | — | — | 11,085 | |||||||||||||||||||
| Other liabilities | 14,329 | — | — | 14,329 | |||||||||||||||||||
| Liabilities of consolidated variable interest entities | |||||||||||||||||||||||
| Other liabilities | 32 | 1,681 | (12) | 1,701 | |||||||||||||||||||
| 404,377 | 1,681 | (12) | 406,046 | ||||||||||||||||||||
| Total Liabilities | 415,060 | 3,717 | (343) | 418,434 | |||||||||||||||||||
Commitments and Contingencies (note 19) | |||||||||||||||||||||||
| Equity | |||||||||||||||||||||||
Mandatory Convertible Preferred Stock | 1,398 | — | — | 1,398 | |||||||||||||||||||
| Additional paid in capital | 16,914 | 40 | — | 16,954 | |||||||||||||||||||
| Retained earnings (accumulated deficit) | 7,731 | 18,784 | (18,881) | 7,634 | |||||||||||||||||||
| Accumulated other comprehensive income (loss) | (2,636) | 31 | (40) | (2,645) | |||||||||||||||||||
| Total AGM Stockholders’ Equity | 23,407 | 18,855 | (18,921) | 23,341 | |||||||||||||||||||
| Non-controlling interests | 8,208 | 10,752 | 214 | 19,174 | |||||||||||||||||||
| Total Equity | 31,615 | 29,607 | (18,707) | 42,515 | |||||||||||||||||||
| Total Liabilities and Equity | $ | 446,675 | $ | 33,324 | $ | (19,050) | $ | 460,949 | |||||||||||||||
1 Certain investment managers and general partners of the funds managed by the Company are VIEs. Such investment managers and general partners have other equity investors at risk that do not have the ability to make significant decisions related to the entity’s operations. The assets and liabilities of such VIEs are presented within Apollo Global Management, Inc. and Consolidated Subsidiaries. | |||||||||||||||||||||||
| (Concluded) | |||||||||||||||||||||||
264
| December 31, 2024 | |||||||||||||||||||||||
| (In millions) | Apollo Global Management, Inc. and Consolidated Subsidiaries | Consolidated Funds and VIEs | Eliminations | Consolidated | |||||||||||||||||||
| Assets | |||||||||||||||||||||||
| Asset Management | |||||||||||||||||||||||
| Cash and cash equivalents | $ | 2,692 | $ | — | $ | — | $ | 2,692 | |||||||||||||||
| Restricted cash and cash equivalents | 3 | — | — | 3 | |||||||||||||||||||
| Investments | 6,558 | — | (472) | 6,086 | |||||||||||||||||||
| Assets of consolidated variable interest entities | |||||||||||||||||||||||
| Cash and cash equivalents | — | 158 | — | 158 | |||||||||||||||||||
| Investments | — | 2,962 | (156) | 2,806 | |||||||||||||||||||
| Other assets | — | 188 | (104) | 84 | |||||||||||||||||||
| Due from related parties | 630 | — | (46) | 584 | |||||||||||||||||||
| Goodwill | 264 | — | — | 264 | |||||||||||||||||||
| Other assets | 2,579 | — | — | 2,579 | |||||||||||||||||||
| 12,726 | 3,308 | (778) | 15,256 | ||||||||||||||||||||
| Retirement Services | |||||||||||||||||||||||
| Cash and cash equivalents | 12,733 | — | — | 12,733 | |||||||||||||||||||
| Restricted cash and cash equivalents | 943 | — | — | 943 | |||||||||||||||||||
| Investments | 262,561 | — | (278) | 262,283 | |||||||||||||||||||
| Investments in related parties | 44,332 | — | (15,448) | 28,884 | |||||||||||||||||||
| Assets of consolidated variable interest entities | |||||||||||||||||||||||
| Cash and cash equivalents | — | 583 | — | 583 | |||||||||||||||||||
| Investments | 1,807 | 21,722 | (105) | 23,424 | |||||||||||||||||||
| Other assets | 12 | 553 | — | 565 | |||||||||||||||||||
| Reinsurance recoverable | 8,194 | — | — | 8,194 | |||||||||||||||||||
| Deferred acquisition costs, deferred sales inducements and value of business acquired | 7,173 | — | — | 7,173 | |||||||||||||||||||
| Goodwill | 4,063 | — | — | 4,063 | |||||||||||||||||||
| Other assets | 13,865 | — | (71) | 13,794 | |||||||||||||||||||
| 355,683 | 22,858 | (15,902) | 362,639 | ||||||||||||||||||||
| Total Assets | $ | 368,409 | $ | 26,166 | $ | (16,680) | $ | 377,895 | |||||||||||||||
| (Continued) | |||||||||||||||||||||||
265
| December 31, 2024 | |||||||||||||||||||||||
| (In millions) | Apollo Global Management, Inc. and Consolidated Subsidiaries | Consolidated Funds and VIEs | Eliminations | Consolidated | |||||||||||||||||||
| Liabilities, Redeemable non-controlling interests and Equity | |||||||||||||||||||||||
| Liabilities | |||||||||||||||||||||||
| Asset Management | |||||||||||||||||||||||
| Accounts payable, accrued expenses, and other liabilities | $ | 3,616 | $ | — | $ | — | $ | 3,616 | |||||||||||||||
| Due to related parties | 834 | — | (124) | 710 | |||||||||||||||||||
| Debt | 4,279 | — | — | 4,279 | |||||||||||||||||||
| Liabilities of consolidated variable interest entities | |||||||||||||||||||||||
| Debt, at fair value | — | 123 | (123) | — | |||||||||||||||||||
| Other liabilities | — | 1,417 | (54) | 1,363 | |||||||||||||||||||
| 8,729 | 1,540 | (301) | 9,968 | ||||||||||||||||||||
| Retirement Services | |||||||||||||||||||||||
| Interest sensitive contract liabilities | 253,637 | — | — | 253,637 | |||||||||||||||||||
| Future policy benefits | 49,902 | — | — | 49,902 | |||||||||||||||||||
| Market risk benefits | 4,028 | — | — | 4,028 | |||||||||||||||||||
| Debt | 6,309 | — | — | 6,309 | |||||||||||||||||||
| Payables for collateral on derivatives and securities to repurchase | 11,652 | — | — | 11,652 | |||||||||||||||||||
| Other liabilities | 9,789 | — | (5) | 9,784 | |||||||||||||||||||
| Liabilities of consolidated variable interest entities | |||||||||||||||||||||||
| Other liabilities | 30 | 1,610 | (5) | 1,635 | |||||||||||||||||||
| 335,347 | 1,610 | (10) | 336,947 | ||||||||||||||||||||
| Total Liabilities | 344,076 | 3,150 | (311) | 346,915 | |||||||||||||||||||
Commitments and Contingencies (note 19) | |||||||||||||||||||||||
| Redeemable non-controlling interests | |||||||||||||||||||||||
| Redeemable non-controlling interests | — | 16 | — | 16 | |||||||||||||||||||
| Equity | |||||||||||||||||||||||
Mandatory Convertible Preferred Stock | 1,398 | — | — | 1,398 | |||||||||||||||||||
| Additional paid in capital | 15,287 | 40 | — | 15,327 | |||||||||||||||||||
| Retained earnings (accumulated deficit) | 6,021 | 16,673 | (16,672) | 6,022 | |||||||||||||||||||
| Accumulated other comprehensive income (loss) | (5,485) | (60) | 51 | (5,494) | |||||||||||||||||||
| Total AGM Stockholders’ Equity | 17,221 | 16,653 | (16,621) | 17,253 | |||||||||||||||||||
| Non-controlling interests | 7,112 | 6,347 | 252 | 13,711 | |||||||||||||||||||
| Total Equity | 24,333 | 23,000 | (16,369) | 30,964 | |||||||||||||||||||
| Total Liabilities, Redeemable non-controlling interests and Equity | $ | 368,409 | $ | 26,166 | $ | (16,680) | $ | 377,895 | |||||||||||||||
| (Concluded) | |||||||||||||||||||||||
266
ITEM 9. CHANGES IN AND DISAGREEMENTS WITH ACCOUNTANTS ON ACCOUNTING AND FINANCIAL DISCLOSURES
None.
ITEM 9A. CONTROLS AND PROCEDURES
We maintain “disclosure controls and procedures”, as such term is defined in Rules 13a-15(e) and 15d-15(e) under the Exchange Act, that are designed to ensure that information required to be disclosed by us in reports that we file or submit under the Exchange Act is recorded, processed, summarized and reported within the time periods specified in SEC rules and forms, and that such information is accumulated and communicated to our management, including our Chief Executive Officer and Chief Financial Officer, as appropriate, to allow timely decisions regarding required disclosure. In designing disclosure controls and procedures, our management necessarily was required to apply its judgment in evaluating the cost-benefit relationship of possible disclosure controls and procedures. The design of any disclosure controls and procedures also is based in part upon certain assumptions about the likelihood of future events, and there can be no assurance that any design will succeed in achieving its stated goals under all potential future conditions. Any controls and procedures, no matter how well designed and operated, can provide only reasonable assurance of achieving the desired objectives.
Our management, including our Chief Executive Officer and Chief Financial Officer, evaluated the effectiveness of our disclosure controls and procedures pursuant to Rule 13a-15 under the Exchange Act as of the end of the period covered by this report. Based on that evaluation, our Chief Executive Officer and Chief Financial Officer have concluded that, as of the end of the period covered by this report, our disclosure controls and procedures (as defined in Rule 13a-15(e) under the Exchange Act) are effective at the reasonable assurance level to accomplish their objectives of ensuring that information we are required to disclose in reports that we file or submit under the Exchange Act is recorded, processed, summarized and reported within the time periods specified in SEC rules and forms, and that such information is accumulated and communicated to our management, including our Chief Executive Officer and Chief Financial Officer as appropriate, to allow timely decisions regarding required disclosure.
Changes in internal control over financial reporting
No changes in our internal control over financial reporting (as such term is defined in Rules 13a–15(f) and 15d–15(f) under the Exchange Act) occurred during our most recent quarter, that have materially affected, or are reasonably likely to materially affect, our internal control over financial reporting.
Management’s Report on Internal Control Over Financial Reporting
Management of Apollo is responsible for establishing and maintaining adequate internal control over financial reporting. Apollo’s internal control over financial reporting is a process designed under the supervision of its principal executive and principal financial officers to provide reasonable assurance regarding the reliability of financial reporting and the preparation of its consolidated financial statements for external reporting purposes in accordance with accounting principles generally accepted in the United States of America.
Apollo’s internal control over financial reporting includes policies and procedures that pertain to the maintenance of records that, in reasonable detail, accurately and fairly reflect transactions and dispositions of assets, provide reasonable assurances that transactions are recorded as necessary to permit preparation of financial statements in accordance with generally accepted accounting principles, and that receipts and expenditures are being made only in accordance with authorizations of management and the directors, and provide reasonable assurance regarding prevention or timely detection of unauthorized acquisition, use or disposition of Apollo’s assets that could have a material effect on its financial statements.
Because of its inherent limitations, internal control over financial reporting may not prevent or detect misstatements. In addition, projections of any evaluation of effectiveness to future periods are subject to the risk that controls may become inadequate because of changes in conditions or that the degree of compliance with the policies or procedures may deteriorate.
267
Management conducted an assessment of the effectiveness of Apollo’s internal control over financial reporting as of December 31, 2025 based on the framework established in Internal Control – Integrated Framework (2013) issued by the Committee of Sponsoring Organizations of the Treadway Commission. Management’s evaluation excluded internal controls over financial reporting related to Bridge, which was acquired on September 2, 2025. Bridge represented 0.5% of total assets, 0.3% of total revenues and (1.2)% of net income (loss) of the Company’s consolidated financial statements as of and for the year ended December 31, 2025. Management is in the process of integrating Bridge’s operations, accounting systems, and control environment into Apollo’s internal control framework and expects to include Bridge in its assessment of internal control over financial reporting for fiscal year 2026. Based on this assessment, management has determined that Apollo’s internal control over financial reporting as of December 31, 2025 was effective.
Deloitte & Touche LLP, an independent registered public accounting firm, has audited Apollo’s financial statements included in this report and issued its report on the effectiveness of Apollo’s internal control over financial reporting as of December 31, 2025, which is included herein.
ITEM 9B. OTHER INFORMATION
During the three months ended December 31, 2025, no director or officer (as defined in Rule 16a-1(f) under the Exchange Act) of AGM adopted terminated
ITEM 9C. DISCLOSURE REGARDING FOREIGN JURISDICTIONS THAT PREVENT INSPECTIONS
Not applicable.
268
PART III
Item 10. Directors, Executive Officers and Corporate Governance
The information required by this item is incorporated by reference to the Company’s definitive Proxy Statement for its 2026 Annual Meeting of Stockholders (the “2026 Proxy Statement”) to be filed with the Securities and Exchange Commission within 120 days of December 31, 2025 under the captions “Board of Directors,” “Corporate Governance,” “Proposal 1—Election of Directors”, “Executive Officers” and “Insider Trading Policy for Employees, Officers and Directors.”
Item 11. Executive Compensation
The information required by this item is incorporated by reference to the 2026 Proxy Statement under the caption “Executive Compensation.”
Item 12. Security Ownership of Certain Beneficial Owners and Management and Related Stockholder Matters
The information required by this item is incorporated by reference to the 2026 Proxy Statement under the captions “Security Ownership of Certain Beneficial Owners and Management.” and “Securities Authorized for Issuance under the Equity Plan.”
Item 13. Certain Relationships and Related Transactions, and Director Independence
The information required by this item is incorporated by reference to the 2026 Proxy Statement under the captions “Certain Relationships and Related Transactions” and “Corporate Governance—Director Independence.”
Item 14. Principal Accountant Fees and Services
The information required by this item is incorporated by reference to the 2026 Proxy Statement under the caption “Proposal 4—Ratification of Appointment of Accountants.”
269
PART IV
ITEM 15. EXHIBITS, FINANCIAL STATEMENT SCHEDULES
The following documents are filed as part of this report:
| 1. | ||||||||
| 2. | Financial Statement Schedules | |||||||
| Any remaining schedules are omitted because they are inapplicable. | ||||||||
| 3. | ||||||||
270
APOLLO GLOBAL MANAGEMENT, INC.
Schedule I—Condensed Financial Information of Registrant (Parent Company Only) - Statements of Financial Condition
| (In millions, except share data) | As of December 31, 2025 | As of December 31, 2024 | |||||||||
| Assets | |||||||||||
| Cash | $ | $ | |||||||||
| Investments | |||||||||||
| Due from subsidiaries | |||||||||||
| Goodwill | |||||||||||
| Other assets | |||||||||||
| Total Assets | $ | $ | |||||||||
| Liabilities and Equity | |||||||||||
| Liabilities | |||||||||||
| Accounts payable, accrued expenses, and other liabilities | $ | $ | |||||||||
| Due to subsidiaries | |||||||||||
| Debt | |||||||||||
| Total Liabilities | |||||||||||
| Equity | |||||||||||
Mandatory Convertible Preferred Stock, | |||||||||||
Common Stock, $ | |||||||||||
| Additional paid in capital | |||||||||||
| Retained earnings (accumulated deficit) | |||||||||||
| Accumulated other comprehensive income (loss) | ( | ( | |||||||||
| Total Equity | |||||||||||
| Total Liabilities and Equity | $ | $ | |||||||||
| See accompanying notes to condensed financial information of registrant (parent company only) | |||||||||||
271
APOLLO GLOBAL MANAGEMENT, INC.
Schedule I—Condensed Financial Information of Registrant (Parent Company Only) - Statements of Operations
| Years ended December 31, | |||||||||||||||||
| (In millions) | 2025 | 2024 | 2023 | ||||||||||||||
| Revenues | |||||||||||||||||
| Investment income (loss) | $ | $ | $ | ||||||||||||||
| Total Revenues | |||||||||||||||||
| Expenses | |||||||||||||||||
| Interest expense | |||||||||||||||||
| General, administrative and other | |||||||||||||||||
| Total Expenses | |||||||||||||||||
| Other income (loss) | |||||||||||||||||
| Other income (loss), net | ( | ||||||||||||||||
| Total Other income (loss) | ( | ||||||||||||||||
| Income (loss) before income tax (provision) benefit | |||||||||||||||||
| Income tax (provision) benefit | ( | ( | |||||||||||||||
| Net income (loss) attributable to Apollo Global Management, Inc. | |||||||||||||||||
| Preferred stock dividends | ( | ( | ( | ||||||||||||||
| Net income (loss) attributable to Apollo Global Management, Inc. common stockholders | $ | $ | $ | ||||||||||||||
| See accompanying notes to condensed financial information of registrant (parent company only) | |||||||||||||||||
272
APOLLO GLOBAL MANAGEMENT, INC.
Schedule I—Condensed Financial Information of Registrant (Parent Company Only) - Statements of Cash Flows
| Years ended December 31, | |||||||||||||||||
| (In millions) | 2025 | 2024 | 2023 | ||||||||||||||
| Cash Flows from Operating Activities | |||||||||||||||||
| Net cash used in operating activities | $ | ( | $ | ( | $ | ( | |||||||||||
| Cash Flows from Investing Activities | |||||||||||||||||
| Contributions to subsidiaries | ( | ( | |||||||||||||||
| Distributions from subsidiaries | |||||||||||||||||
| Purchase of investments | ( | ||||||||||||||||
| Sale of investments | |||||||||||||||||
| Due from subsidiaries, net | |||||||||||||||||
| Net cash provided by investing activities | |||||||||||||||||
| Cash Flows from Financing Activities | |||||||||||||||||
| Preferred stock dividends | ( | ( | ( | ||||||||||||||
| Common stock dividends | ( | ( | ( | ||||||||||||||
| Issuance of debt | |||||||||||||||||
| Payment of debt issuance cost | ( | ( | ( | ||||||||||||||
| Issuance of Mandatory Convertible Preferred stock, net of issuance costs | |||||||||||||||||
| Repurchase of common stock | ( | ( | ( | ||||||||||||||
| Due to subsidiaries, net | ( | ||||||||||||||||
| Net cash provided by (used in) financing activities | ( | ( | |||||||||||||||
| Net Increase (Decrease) in Cash and Cash Equivalents | ( | ||||||||||||||||
| Cash and Cash Equivalents, Beginning of Period | |||||||||||||||||
| Cash and Cash Equivalents, End of Period | $ | $ | $ | ||||||||||||||
| Supplemental Disclosure of Cash Flow Information | |||||||||||||||||
| Cash paid for taxes | $ | $ | $ | ||||||||||||||
| Cash paid for interest | |||||||||||||||||
| See accompanying notes to condensed financial information of registrant (parent company only) | |||||||||||||||||
273
APOLLO GLOBAL MANAGEMENT, INC.
Schedule I—Condensed Financial Information of Registrant (Parent Company Only) - Notes to Financial Statements
1. Basis of Presentation
The accompanying condensed financial statements of Apollo Global Management Inc. (“AGM”) should be read in conjunction with the consolidated financial statements and notes of AGM and its subsidiaries (“consolidated financial statements”).
For purposes of these condensed financial statements, AGM’s wholly owned and majority owned subsidiaries are presented under the equity method of accounting. Under this method, the assets and liabilities of subsidiaries are not consolidated. The investments in subsidiaries are recorded on the condensed statements of financial condition. The income from subsidiaries is reported on a net basis as equity earnings of subsidiaries on the condensed statements of operations.
2. Intercompany Transactions
Unsecured Revolving Notes Receivable – AGM has unsecured revolving notes receivable from its subsidiaries Apollo Asset Management (“AAM”) and Athene Holding Ltd. (“AHL”). The note from AAM accrues interest at a rate per annum equal to the U.S. short-term federal rate applicable at the time the proceeds are loaned and the balance is due at AGM’s request. The note from AAM had an outstanding net receivable balance of $0 million and $121 million as of December 31, 2025 and 2024, respectively. The note from AHL has a borrowing capacity of $500 million. Interest accrues at a rate per annum, equal to the U.S. mid-term applicable federal rate, and the balance is due on December 13, 2028, or earlier at AGM’s request. There was no outstanding balance on the note from AHL as of December 31, 2025 and 2024.
Unsecured Revolving Note Payable – In addition to the unsecured revolving notes receivable described above, AGM has unsecured revolving notes payable to its subsidiaries AAM and AHL. The note to AAM accrues interest at a rate per annum equal to the U.S. short-term federal rate applicable at the time the proceeds are loaned and the balance is due at AAM’s request. The note to AAM had an outstanding net payable balance of $685 million and $0 million as of December 31, 2025 and 2024, respectively. The note payable to AHL has a borrowing capacity of $500 million. Interest accrues at a rate per annum, equal to the U.S. mid-term applicable federal rate, and the balance is due on December 13, 2028, or earlier at AHL’s request. The note had an outstanding balance of $227 million and $142 million as of December 31, 2025 and 2024, respectively.
3. Dividends
During the years ended December 31, 2025, 2024 and 2023, AGM received $750 million, $452 million and $1,082 million, respectively, of cash dividends from its subsidiaries. See note 20 – “Statutory Requirements” to the consolidated financial statements for additional information on subsidiary dividend restrictions.
4. Debt and Guarantees
See note 14 – “Debt” and note 19 – “Commitments and Contingencies” to the consolidated financial statements for additional information on the Company’s debt and guarantees.
5. Equity
See note 16 – “Equity” to the consolidated financial statements for additional information on the Company’s 6.75 % Series A Mandatory Convertible Preferred Stock.
274
| (In millions) | Additions | ||||||||||||||||||||||||||||
| Description | Balance at beginning of year | Charged to costs and expenses | Assumed through acquisitions | Deductions | Balance at end of year | ||||||||||||||||||||||||
| Reserves deducted from assets to which they apply | |||||||||||||||||||||||||||||
Year ended December 31, 2025 | |||||||||||||||||||||||||||||
| Valuation allowance on deferred tax assets | $ | $ | $ | $ | $ | ||||||||||||||||||||||||
Year ended December 31, 2024 | |||||||||||||||||||||||||||||
| Valuation allowance on deferred tax assets | |||||||||||||||||||||||||||||
Year ended December 31, 2023 | |||||||||||||||||||||||||||||
| Valuation allowance on deferred tax assets | ( | ||||||||||||||||||||||||||||
275
| Exhibit Number | Exhibit Description | |||||||
| 2.1 | ||||||||
| 3.1 | ||||||||
| 3.2 | ||||||||
| 3.3 | ||||||||
| 3.4 | ||||||||
| 4.1 | ||||||||
| 4.2 | ||||||||
| 4.3 | ||||||||
| 4.4 | ||||||||
| 4.5 | ||||||||
| 4.6 | ||||||||
| 4.7 | ||||||||
| 4.8 | ||||||||
276
| 4.9 | ||||||||
| 4.10 | ||||||||
| 4.11 | ||||||||
| 4.12 | ||||||||
| 4.13 | ||||||||
| 4.14 | ||||||||
| 4.15 | Certain instruments defining the rights of holders of long-term debt securities of the Registrant and its subsidiaries are omitted pursuant to Item 601(b)(4)(iii) of Regulation S-K. The Registrant hereby undertakes to furnish to the Securities and Exchange Commission, upon request, copies of any such instruments. | |||||||
| *4.16 | ||||||||
| +10.1 | ||||||||
| +10.2 | ||||||||
| +10.3 | ||||||||
| +10.4 | ||||||||
| +10.5 | ||||||||
| +10.6 | ||||||||
| +10.7 | ||||||||
277
278
279
| +10.33 | ||||||||
| +10.34 | ||||||||
| +10.35 | ||||||||
| +10.36 | ||||||||
| +10.37 | ||||||||
| +10.38 | ||||||||
| +10.39 | ||||||||
| +10.40 | ||||||||
| +10.41 | ||||||||
| +10.42 | ||||||||
| +10.43 | ||||||||
| +10.44 | ||||||||
| +10.45 | ||||||||
280
| +10.46 | ||||||||
| +10.47 | ||||||||
| +10.48 | ||||||||
| +10.49 | ||||||||
| +10.50 | ||||||||
| +10.51 | ||||||||
| +10.52 | ||||||||
| +10.53 | ||||||||
| +10.54 | ||||||||
| +10.55 | ||||||||
| +10.56 | ||||||||
| +10.57 | ||||||||
| +10.58 | ||||||||
281
| +10.59 | ||||||||
| +10.60 | ||||||||
| +10.61 | ||||||||
| +10.62 | ||||||||
| †+10.63 | ||||||||
| †+10.64 | ||||||||
| +10.65 | ||||||||
| +10.66 | ||||||||
| 10.67 | ||||||||
| 10.68 | ||||||||
| 10.69 | ||||||||
| 10.70 | ||||||||
| 10.71 | ||||||||
| 10.72 | ||||||||
282
283
| +10.86 | ||||||||
| +10.87 | ||||||||
| +10.88 | ||||||||
| *+10.89 | ||||||||
| *19.1 | ||||||||
| *21.1 | ||||||||
| *22.1 | ||||||||
| *23.1 | ||||||||
| *31.1 | ||||||||
| *31.2 | ||||||||
| *32.1 | ||||||||
| *32.2 | ||||||||
| 97.1 | ||||||||
| 101 | Interactive data files pursuant to Rule 405 of Regulation S-T, formatted in Inline XBRL (eXtensible Business Reporting Language): (i) the Consolidated Statements of Financial Condition as of December 31, 2025 and December 31, 2024, (ii) the Consolidated Statements of Operations for the years ended December 31, 2025, 2024 and 2023, (iii) the Consolidated Statements of Comprehensive Income (Loss) for the years ended December 31, 2025, 2024 and 2023, (iv) the Consolidated Statements of Equity for the years ended December 31, 2025, 2024 and 2023, (v) the Consolidated Statements of Cash Flows for the years ended December 31, 2025, 2024 and 2023, and (vi) the Notes to the Consolidated Financial Statements. | |||||||
| 104 | Cover Page Interactive Data File (formatted in Inline XBRL in Exhibit 101). | |||||||
| * | Filed herewith. | ||||
| + | Management contract or compensatory plan or arrangement. | ||||
† | Certain information contained in this exhibit has been omitted because it is not material and is the type that the registrant treats as private or confidential. | ||||
The agreements and other documents filed as exhibits to this report are not intended to provide factual information or other disclosure other than with respect to the terms of the agreements or other documents themselves, and you should not rely on them for that purpose. In particular, any representations and warranties made by us in these agreements or other documents were made solely within the specific context of the relevant agreement or document and may not describe the actual state of affairs as of the date they were made or at any other time.
284
ITEM 16. FORM 10-K SUMMARY
Not applicable.
285
SIGNATURES
Pursuant to the requirements of the Securities Exchange Act of 1934, the registrant has duly caused this report to be signed on its behalf by the undersigned, thereunto duly authorized.
| Apollo Global Management, Inc. | |||||||||||
| (Registrant) | |||||||||||
| Date: February 25, 2026 | By: | /s/ Martin Kelly | |||||||||
| Name: | Martin Kelly | ||||||||||
| Title: | Chief Financial Officer (principal financial officer and authorized signatory) | ||||||||||
286
Pursuant to the requirements of the Securities Exchange Act of 1934, this report has been signed below by the following persons on behalf of the registrant and in the capacities and on the dates indicated:
| Name | Title | Date | ||||||||||||
| /s/ Marc Rowan | Chairman, Chief Executive Officer and Director | February 25, 2026 | ||||||||||||
| Marc Rowan | (principal executive officer) | |||||||||||||
| /s/ Martin Kelly | Chief Financial Officer | February 25, 2026 | ||||||||||||
| Martin Kelly | (principal financial officer) | |||||||||||||
| /s/ Kristy Kinahan | Chief Accounting Officer | February 25, 2026 | ||||||||||||
| Kristy Kinahan | (principal accounting officer) | |||||||||||||
| /s/ James Belardi | Director | February 25, 2026 | ||||||||||||
| James Belardi | Executive Chairman of AHL | |||||||||||||
| /s/ Scott Kleinman | Director | February 25, 2026 | ||||||||||||
| Scott Kleinman | Co-President of AAM | |||||||||||||
| /s/ James Zelter | Director | February 25, 2026 | ||||||||||||
| James Zelter | President | |||||||||||||
| /s/ Gary Cohn | Lead Independent Director | February 25, 2026 | ||||||||||||
| Gary Cohn | ||||||||||||||
| /s/ Marc Beilinson | Director | February 25, 2026 | ||||||||||||
| Marc Beilinson | ||||||||||||||
| /s/ Jessica Bibliowicz | Director | February 25, 2026 | ||||||||||||
| Jessica Bibliowicz | ||||||||||||||
| /s/ Kerry Murphy Healey | Director | February 25, 2026 | ||||||||||||
| Kerry Murphy Healey | ||||||||||||||
| /s/ Mitra Hormozi | Director | February 25, 2026 | ||||||||||||
| Mitra Hormozi | ||||||||||||||
| /s/ Pamela Joyner | Director | February 25, 2026 | ||||||||||||
| Pamela Joyner | ||||||||||||||
| /s/ Brian Leach | Director | February 25, 2026 | ||||||||||||
| Brian Leach | ||||||||||||||
| /s/ David Simon | Director | February 25, 2026 | ||||||||||||
| David Simon | ||||||||||||||
287
| /s/ Lynn Swann | Director | February 25, 2026 | ||||||||||||
| Lynn Swann | ||||||||||||||
| /s/ Patrick Toomey | Director | February 25, 2026 | ||||||||||||
| Patrick Toomey | ||||||||||||||
288