10-Q: Quarterly report [Sections 13 or 15(d)]
Published on August 7, 2025
UNITED STATES
SECURITIES AND EXCHANGE COMMISSION
WASHINGTON, D.C. 20549
Form 10-Q
(Mark One)
QUARTERLY REPORT PURSUANT TO SECTION 13 OR 15(d) OF THE SECURITIES EXCHANGE ACT OF 1934 |
|||||
FOR THE QUARTERLY PERIOD ENDED JUNE 30, 2025 OR
| TRANSITION REPORT PURSUANT TO SECTION 13 OR 15(d) OF THE SECURITIES EXCHANGE ACT OF 1934 | |||||
FOR THE TRANSITION PERIOD FROM TO
Commission File Number: 001-41197

(Exact name of registrant as specified in its charter)
| (State or other jurisdiction of incorporation or organization) | (I.R.S. Employer Identification No.) | |||||||
(Address of principal executive offices) (Zip Code)
(212 ) 515-3200
(Registrant’s telephone number, including area code)
Securities registered pursuant to Section 12(b) of the Act:
| Title of each class | Trading Symbol(s) | Name of each exchange on which registered | ||||||||||||
Indicate by check mark whether the registrant (1) has filed all reports required to be filed by Section 13 or 15(d) of the Securities Exchange Act of 1934 during the preceding 12 months (or for such shorter period that the registrant was required to file such reports), and (2) has been subject to such filing requirements for the past 90 days. Yes x No ☐
Indicate by check mark whether the registrant has submitted electronically every Interactive Data File required to be submitted pursuant to Rule 405 of Regulation S-T (§232.405 of this chapter) during the preceding 12 months (or for such shorter period that the registrant was required to submit such files). Yes x No ☐
Indicate by check mark whether the registrant is a large accelerated filer, an accelerated filer, a non-accelerated filer, a smaller reporting company or an emerging growth company. See the definitions of “large accelerated filer,” “accelerated filer,” “smaller reporting company,” and “emerging growth company” in Rule 12b-2 of the Exchange Act.
| Accelerated filer ☐ | Non-accelerated filer ☐ | Smaller reporting company | Emerging growth company | ||||||||||||||||||||||||||||||||||||||
If an emerging growth company, indicate by check mark if the registrant has elected not to use the extended transition period for complying with any new or revised financial accounting standards provided pursuant to Section 13(a) of the Exchange Act. ☐
Indicate by check mark whether the registrant is a shell company (as defined in Rule 12b-2 of the Exchange Act). Yes ☐ No x
As of August 5, 2025, there were 572,026,735 shares of the registrant’s common stock outstanding.
| TABLE OF CONTENTS | ||||||||
| PART I | ||||||||
| ITEM 1. | ||||||||
| ITEM 1A. | ||||||||
| ITEM 2. | ||||||||
| ITEM 3. | ||||||||
| ITEM 4. | ||||||||
| PART II | ||||||||
| ITEM 1. | ||||||||
| ITEM 1A. | ||||||||
| ITEM 2. | ||||||||
| ITEM 3. | ||||||||
| ITEM 4. | ||||||||
| ITEM 5. | ||||||||
| ITEM 6. | ||||||||
2
Forward-Looking Statements
This report may contain forward-looking statements that are within the meaning of Section 27A of the Securities Act of 1933, as amended (the “Securities Act”), and Section 21E of the Securities Exchange Act of 1934, as amended (the “Exchange Act”). These statements include, but are not limited to, discussions related to Apollo’s expectations regarding the performance of its business, its liquidity and capital resources and the other non-historical statements in the discussion and analysis. These forward-looking statements are based on management’s beliefs, as well as assumptions made by, and information currently available to, management. When used in this report, the words “believe,” “anticipate,” “estimate,” “expect,” “intend,” “target” or future or conditional verbs, such as “will,” “should,” “could,” or “may,” and variations of such words and similar expressions are intended to identify forward-looking statements. Although management believes that the expectations reflected in these forward-looking statements are reasonable, it can give no assurance that these expectations will prove to have been correct. These statements are subject to certain risks, uncertainties and assumptions, including risks relating to inflation, interest rate fluctuations and market conditions generally, international trade barriers, domestic or international political developments and other geopolitical events, including geopolitical tensions and hostilities, the impact of energy market dislocation, our ability to manage our growth, our ability to operate in highly competitive environments, the performance of the funds we manage, our ability to raise new funds, the variability of our revenues, earnings and cash flow, the accuracy of management’s assumptions and estimates, our dependence on certain key personnel, our use of leverage to finance our businesses and investments by the funds we manage, Athene’s ability to maintain or improve financial strength ratings, the impact of Athene’s reinsurers failing to meet their assumed obligations, Athene’s ability to manage its business in a highly regulated industry, changes in our regulatory environment and tax status, and litigation risks, among others. We believe these factors include but are not limited to those described under the section entitled “Risk Factors” in the Company’s annual report on Form 10-K filed with the United States Securities and Exchange Commission (“SEC”) on February 24, 2025 (the “2024 Annual Report”), as such factors may be updated from time to time in our periodic filings with the SEC, which are accessible on the SEC’s website at www.sec.gov. These factors should not be construed as exhaustive and should be read in conjunction with the other cautionary statements that are included in this report and in our other filings with the SEC. We undertake no obligation to publicly update any forward-looking statements, whether as a result of new information, future developments or otherwise, except as required by applicable law.
Terms Used in This Report
In this report, references to “Apollo,” “we,” “us,” “our,” and the “Company” refer to Apollo Global Management, Inc. (“AGM”) and its subsidiaries unless the context requires otherwise. References to “AGM common stock” or “common stock” of the Company refer to shares of common stock, par value $0.00001 per share, of AGM and “Mandatory Convertible Preferred Stock” refers to the 6.75% Series A Mandatory Convertible Preferred Stock of AGM.
The use of any defined term in this report to mean more than one entity, person, security or other item collectively is solely for convenience of reference and in no way implies that such entities, persons, securities or other items are one indistinguishable group. For example, notwithstanding the use of the defined terms “Apollo,” “we,” “us,” “our,” and the “Company” in this report to refer to AGM and its subsidiaries, each subsidiary of AGM is a standalone legal entity that is separate and distinct from AGM and any of its other subsidiaries. Any AGM entity (including any Athene entity) referenced herein is responsible for its own financial, contractual and legal obligations.
| Term or Acronym | Definition | ||||
| AAA | Apollo Aligned Alternatives Aggregator, LP | ||||
| AAIA | Athene Annuity and Life Company | ||||
| AAM | Apollo Asset Management, Inc. (f/k/a Apollo Global Management, Inc. prior to the Mergers.) | ||||
| AARe | Athene Annuity Re Ltd., a Bermuda reinsurance subsidiary | ||||
| ABS | Asset-backed securities | ||||
| Accord+ | Apollo Accord+ Fund, L.P., together with its parallel funds and alternative investment vehicles | ||||
| Accord+ II | Apollo Accord+ II Fund, L.P., together with its parallel funds and alternative investment vehicles | ||||
| Accord I | Apollo Accord Master Fund, L.P., together with its feeder funds | ||||
| Accord II | Apollo Accord Master Fund II, L.P., together with its feeder funds | ||||
| Accord III | Apollo Accord Master Fund III, L.P., together with its feeder funds | ||||
| Accord III B | Apollo Accord Master Fund III B, L.P., together with its feeder funds | ||||
| Accord IV | Apollo Accord Fund IV, L.P., together with its parallel funds and alternative investment vehicles | ||||
| Accord V | Apollo Accord Fund V, L.P., together with its parallel funds and alternative investment vehicles | ||||
3
| Accord VI | Apollo Accord Fund VI, L.P., together with its parallel funds and alternative investment vehicles | ||||
| Accord Funds | Accord I, Accord II, Accord III, Accord III B, Accord IV, Accord V and Accord VI | ||||
| Accord+ Funds | Accord+ and Accord+ II | ||||
| ACRA | ACRA 1 and ACRA 2 | ||||
| ACRA 1 | Athene Co-Invest Reinsurance Affiliate Holding Ltd., together with its subsidiaries | ||||
| ACRA 2 | Athene Co-Invest Reinsurance Affiliate Holding 2 Ltd., together with its subsidiaries | ||||
| ADCF | Apollo Diversified Credit Fund | ||||
| ADIP | ADIP I and ADIP II | ||||
| ADIP I | Apollo/Athene Dedicated Investment Program (A), L.P., together with its parallel funds, a series of funds managed by Apollo including third-party capital that, through ACRA 1, invests alongside Athene in certain investments | ||||
| ADIP II | Apollo/Athene Dedicated Investment Program II, L.P., a fund managed by Apollo including third-party capital that, through ACRA 2, invests alongside Athene in certain investments | ||||
| Adjusted Net Income Shares Outstanding, or ANI Shares Outstanding | Consists of total shares of common stock outstanding, RSUs that participate in dividends, and shares of common stock assumed to be issuable upon the conversion of the shares of Mandatory Convertible Preferred Stock | ||||
| ADREF | Apollo Diversified Real Estate Fund | ||||
| ADS | Apollo Debt Solutions BDC | ||||
| AFS | Available-for-sale | ||||
| AIOF I | Apollo Infra Equity US Fund, L.P. and Apollo Infra Equity International Fund, L.P., including their feeder funds and alternative investment vehicles | ||||
| AIOF II | Apollo Infrastructure Opportunities Fund II, L.P., together with its parallel funds and alternative investment vehicles | ||||
| AIOF III | Apollo Infrastructure Opportunities Fund III, L.P., together with its parallel funds and alternative investment vehicles | ||||
| ALRe | Athene Life Re Ltd., a Bermuda reinsurance subsidiary | ||||
| Alternative investments | Alternative investments, including investment funds and certain VIEs, adjusted for reinsurance impacts and to include Athene's proportionate share of ACRA alternative investments based on its economic ownership | ||||
| AMH | Apollo Management Holdings, L.P., a Delaware limited partnership, that is an indirect subsidiary of AGM | ||||
| ANRP I | Apollo Natural Resources Partners, L.P., together with its alternative investment vehicles | ||||
| ANRP II | Apollo Natural Resources Partners II, L.P., together with its alternative investment vehicles | ||||
| ANRP III | Apollo Natural Resources Partners III, L.P., together with its parallel funds and alternative investment vehicles | ||||
| AOCI | Accumulated other comprehensive income (loss) | ||||
| AOG Unit Payment | On December 31, 2021, holders of units of the Apollo Operating Group (“AOG Units”) (other than Athene and the Company) sold and transferred a portion of such AOG Units to APO Corp., a wholly-owned consolidated subsidiary of the Company, in exchange for an amount equal to $3.66 multiplied by the total number of AOG Units held by such holders immediately prior to such transaction. | ||||
| Apollo DAF | The donor-advised fund established by Apollo | ||||
| Apollo funds, our funds and references to the funds we manage | The funds (including the parallel funds and alternative investment vehicles of such funds), partnerships, accounts, including strategic investment accounts or “SIAs,” alternative asset companies and other entities for which subsidiaries of Apollo provide investment management or advisory services. | ||||
| Apollo Operating Group | (i) The entities through which we currently operate our asset management business and (ii) one or more entities formed for the purpose of, among other activities, holding certain of our gains or losses on our principal investments in the funds, which we refer to as our “principal investments.” | ||||
| ARI | Apollo Commercial Real Estate Finance, Inc. | ||||
| ARIS | Apollo Realty Income Solutions, Inc. | ||||
4
| Assets Under Management, or AUM | The assets of the funds, partnerships and accounts to which Apollo provides investment management, advisory, or certain other investment-related services, including, without limitation, capital that such funds, partnerships and accounts have the right to call from investors pursuant to capital commitments. Our AUM equals the sum of: 1. the NAV, plus used or available leverage and/or capital commitments, or gross assets plus capital commitments, of the credit and certain equity funds, partnerships and accounts for which we provide investment management or advisory services, other than certain CLOs, CDOs, and certain perpetual capital vehicles, which have a fee-generating basis other than the mark-to-market value of the underlying assets; for certain perpetual capital vehicles in credit, gross asset value plus available financing capacity; 2. the fair value of the investments of the equity and certain credit funds, partnerships and accounts Apollo manages or advises, plus the capital that such funds, partnerships and accounts are entitled to call from investors pursuant to capital commitments, plus portfolio level financings; 3. the gross asset value associated with the reinsurance investments of the portfolio company assets Apollo manages or advises; and 4. the fair value of any other assets that Apollo manages or advises for the funds, partnerships and accounts to which Apollo provides investment management, advisory, or certain other investment-related services, plus unused credit facilities, including capital commitments to such funds, partnerships and accounts for investments that may require pre-qualification or other conditions before investment plus any other capital commitments to such funds, partnerships and accounts available for investment that are not otherwise included in the clauses above. Apollo’s AUM measure includes Assets Under Management for which Apollo charges either nominal or zero fees. Apollo’s AUM measure also includes assets for which Apollo does not have investment discretion, including certain assets for which Apollo earns only investment-related service fees, rather than management or advisory fees. Apollo’s definition of AUM is not based on any definition of Assets Under Management contained in its governing documents or in any management agreements of the funds Apollo manages. Apollo considers multiple factors for determining what should be included in its definition of AUM. Such factors include but are not limited to (1) Apollo’s ability to influence the investment decisions for existing and available assets; (2) Apollo’s ability to generate income from the underlying assets in the funds it manages; and (3) the AUM measures that Apollo uses internally or believes are used by other investment managers. Given the differences in the investment strategies and structures among other alternative investment managers, Apollo’s calculation of AUM may differ from the calculations employed by other investment managers and, as a result, this measure may not be directly comparable to similar measures presented by other investment managers. Apollo’s calculation also differs from the manner in which its affiliates registered with the SEC report “Regulatory Assets Under Management” on Form ADV and Form PF in various ways. Apollo uses AUM, Gross capital deployment and Dry powder as performance measurements of its investment activities, as well as to monitor fund size in relation to professional resource and infrastructure needs. |
||||
| Athene | Athene Holding Ltd. (“Athene Holding” or “AHL”, together with its subsidiaries, “Athene”), a leading financial services company specializing in retirement services that issues, reinsures and acquires retirement savings products designed for the increasing number of individuals and institutions seeking to fund retirement needs, and to which Apollo, through its consolidated subsidiary ISG, provides asset management and advisory services. | ||||
| Athora | Athora Holding, Ltd. (“Athora Holding”, together with its subsidiaries, “Athora”), a strategic liabilities platform that acquires or reinsures blocks of insurance business in the German and broader European life insurance market (collectively, the “Athora Accounts”). Apollo, through ISGI, provides investment advisory services to Athora. Athora Non-Sub-Advised Assets includes the Athora assets which are managed by Apollo but not sub-advised by Apollo nor invested in Apollo funds or investment vehicles. Athora Sub-Advised includes assets which the Company explicitly sub-advises as well as those assets in the Athora Accounts which are invested directly in funds and investment vehicles Apollo manages. | ||||
| Atlas | An equity investment of AAA and refers to certain subsidiaries of Atlas Securitized Products Holdings LP | ||||
| AUM with Future Management Fee Potential | The committed uninvested capital portion of total AUM not currently earning management fees. The amount depends on the specific terms and conditions of each fund. | ||||
| AUSA | Athene USA Corporation | ||||
| Bermuda capital | The capital of Athene's non-U.S. reinsurance subsidiaries as reported in the Bermuda statutory financial statements and applying U.S. statutory accounting principles for policyholder reserve liabilities which are subjected to U.S. cash flow testing requirements, excluding certain items that do not exist under Athene's applicable Bermuda requirements, such as interest maintenance reserves. There are certain Bermuda statutory accounting differences, primarily (1) marking to market of inception date investment gains or losses relating to reinsurance transactions and (2) admission of certain deferred tax assets, that may from time to time result in material differences from the calculation of statutory capital under U.S. statutory accounting principles. | ||||
| Bermuda RBC | The risk-based capital ratio of Athene’s non-U.S. reinsurance subsidiaries calculated using Bermuda capital and applying NAIC risk-based capital factors on an aggregate basis, excluding U.S. subsidiaries which are included within Athene’s U.S. RBC Ratio. | ||||
| BMA | Bermuda Monetary Authority | ||||
5
| Capital solutions fees and other, net | Primarily includes transaction fees earned by our capital solutions business which we refer to as Apollo Capital Solutions (“ACS”) related to underwriting, structuring, arrangement and placement of debt and equity securities, and syndication for funds managed by Apollo, portfolio companies of funds managed by Apollo, and third parties. Capital solutions fees and other, net also includes advisory fees for the ongoing monitoring of portfolio operations and directors’ fees. These fees also include certain offsetting amounts, including reductions in management fees related to a percentage of these fees recognized (“management fee offset”) and other additional revenue sharing arrangements. |
||||
| CDO | Collateralized debt obligation | ||||
| Class A shares | Class A common stock, $0.00001 par value per share, of AAM prior to the Mergers. | ||||
| CLO | Collateralized loan obligation | ||||
| CMBS | Commercial mortgage-backed securities | ||||
| CML | Commercial mortgage loan | ||||
| Contributing Partners | Partners and their related parties (other than Messrs. Leon Black, Joshua Harris and Marc Rowan, our co-founders) who indirectly beneficially owned AOG units. | ||||
| Consolidated RBC | The consolidated risk-based capital ratio of Athene’s non-U.S. reinsurance and U.S. insurance subsidiaries calculated by aggregating U.S. RBC and Bermuda RBC. | ||||
| Cost of funds | Cost of funds includes liability costs related to cost of crediting on both deferred annuities, including, with respect to Athene's fixed indexed annuities, option costs, and institutional costs related to institutional products, as well as other liability costs, but does not include the proportionate share of the ACRA cost of funds associated with the non-controlling interests. Other liability costs include DAC, DSI and VOBA amortization, certain market risk benefit costs, the cost of liabilities on products other than deferred annuities and institutional products, premiums and certain product charges and other revenues. Athene includes the costs related to business added through assumed reinsurance transactions but excludes the costs on business related to ceded reinsurance transactions. Cost of funds is computed as the total liability costs divided by the average net invested assets for the relevant period, presented on an annualized basis for interim periods. | ||||
| Credit Strategies | Apollo Credit Strategies Master Fund Ltd., together with its feeder funds | ||||
| CS | Credit Suisse AG | ||||
| DAC | Deferred acquisition costs | ||||
| Deferred annuities | Fixed indexed annuities, annual reset annuities, multi-year guaranteed annuities and registered index-linked annuities | ||||
| Dry Powder | The amount of capital available for investment or reinvestment subject to the provisions of the applicable limited partnership agreements or other governing agreements of the funds, partnerships and accounts we manage. Dry powder excludes uncalled commitments which can only be called for fund fees and expenses and commitments from perpetual capital vehicles. | ||||
| DSI | Deferred sales inducement | ||||
| EPF Funds | Apollo European Principal Finance Fund, L.P., Apollo European Principal Finance Fund II (Dollar A), L.P., EPF III, and EPF IV, together with their parallel funds and alternative investment vehicles | ||||
| EPF III | Apollo European Principal Finance Fund III (Dollar A), L.P., together with its parallel funds and alternative investment vehicles | ||||
| EPF IV | Apollo European Principal Finance Fund IV (Dollar A), L.P., together with its parallel funds and alternative investment vehicles | ||||
| Equity Plan | Refers collectively to the Company’s 2019 Omnibus Equity Incentive Plan and the Company’s 2019 Omnibus Equity Incentive Plan for Estate Planning Vehicles. | ||||
| FABN | Funding agreement backed notes | ||||
| FASB | Financial Accounting Standards Board |
||||
| FCI Funds | Financial Credit Investment I, L.P., Financial Credit Investment II, L.P., together with its feeder funds, Financial Credit Investment Fund III L.P., and Financial Credit Investment IV, L.P., together with its feeder funds | ||||
| Fee-Generating AUM | Fee-Generating AUM consists of assets of the funds, partnerships and accounts to which we provide investment management, advisory, or certain other investment-related services and on which we earn management fees, monitoring fees or other investment-related fees pursuant to management or other fee agreements on a basis that varies among the Apollo funds, partnerships and accounts. Management fees are normally based on “net asset value,” “gross assets,” “adjusted par asset value,” “adjusted cost of all unrealized portfolio investments,” “capital commitments,” “adjusted assets,” “stockholders’ equity,” “invested capital” or “capital contributions,” each as defined in the applicable management agreement. Monitoring fees, also referred to as advisory fees, with respect to the structured portfolio company investments of the funds, partnerships and accounts we manage or advise, are generally based on the total value of such structured portfolio company investments, which normally includes leverage, less any portion of such total value that is already considered in Fee-Generating AUM. | ||||
6
| Fee Related Earnings, or FRE | Component of Segment Income that is used to assess the performance of the Asset Management segment. FRE is the sum of (i) management fees, (ii) capital solutions and other related fees, (iii) fee-related performance fees from indefinite term vehicles, that are measured and received on a recurring basis and not dependent on realization events of the underlying investments, excluding performance fees from Athene and performance fees from origination platforms dependent on capital appreciation, and (iv) other income, net, less (a) fee-related compensation, excluding equity-based compensation, (b) non-compensation expenses incurred in the normal course of business, (c) placement fees and (d) non-controlling interests in the management companies of certain funds the Company manages. |
||||
| FIA | Fixed indexed annuity, which is an insurance contract that earns interest at a crediting rate based on a specified index on a tax-deferred basis | ||||
| Fixed annuities | FIAs together with fixed rate annuities | ||||
| Former Managing Partners | Messrs. Leon Black, Joshua Harris and Marc Rowan collectively and, when used in reference to holdings of interests in Apollo or AP Professional Holdings, L.P. includes certain related parties of such individuals | ||||
| Freedom Parent Holdings | Freedom Parent Holdings, L.P. |
||||
| GDP | Gross Domestic Product | ||||
Gross capital deployment |
The gross capital that has been invested by the funds and accounts we manage during the relevant period, but excludes certain investment activities primarily related to hedging and cash management functions at the firm. Gross capital deployment is not reduced or netted down by sales or refinancings, and takes into account leverage used by the funds and accounts we manage in gaining exposure to the various investments that they have made. |
||||
| GLWB | Guaranteed lifetime withdrawal benefit | ||||
| GMDB | Guaranteed minimum death benefit | ||||
| Gross IRR of accord series, ADIP funds and the European principal finance funds | The annualized return of a fund based on the actual timing of all cumulative fund cash flows before management fees, performance fees allocated to the general partner and certain other expenses. Calculations may include certain investors that do not pay fees. The terminal value is the net asset value as of the reporting date. Non-U.S. dollar denominated (“USD”) fund cash flows and residual values are converted to USD using the spot rate as of the reporting date. In addition, gross IRRs at the fund level will differ from those at the individual investor level as a result of, among other factors, timing of investor-level inflows and outflows. Gross IRR does not represent the return to any fund investor. | ||||
| Gross IRR of a traditional private equity or hybrid value fund | The cumulative investment-related cash flows (i) for a given investment for the fund or funds which made such investment, and (ii) for a given fund, in the relevant fund itself (and not any one investor in the fund), in each case, on the basis of the actual timing of investment inflows and outflows (for unrealized investments assuming disposition on June 30, 2025 or other date specified) aggregated on a gross basis quarterly, and the return is annualized and compounded before management fees, performance fees and certain other expenses (including interest incurred by the fund itself) and measures the returns on the fund’s investments as a whole without regard to whether all of the returns would, if distributed, be payable to the fund’s investors. In addition, gross IRRs at the fund level will differ from those at the individual investor level as a result of, among other factors, timing of investor-level inflows and outflows. Gross IRR does not represent the return to any fund investor. | ||||
| Gross IRR of infrastructure funds | The cumulative investment-related cash flows in the fund itself (and not any one investor in the fund), on the basis of the actual timing of cash inflows and outflows (for unrealized investments assuming disposition on June 30, 2025 or other date specified) starting on the date that each investment closes, and the return is annualized and compounded before management fees, performance fees, and certain other expenses (including interest incurred by the fund itself) and measures the returns on the fund’s investments as a whole without regard to whether all of the returns would, if distributed, be payable to the fund’s investors. Non-USD fund cash flows and residual values are converted to USD using the spot rate as of the reporting date. In addition, gross IRRs at the fund level will differ from those at the individual investor level as a result of, among other factors, timing of investor-level inflows and outflows. Gross IRR does not represent the return to any fund investor. | ||||
| HoldCo | Apollo Global Management, Inc. (f/k/a Tango Holdings, Inc.) | ||||
| HVF I | Apollo Hybrid Value Fund, L.P., together with its parallel funds and alternative investment vehicles | ||||
| HVF II | Apollo Hybrid Value Fund II, L.P., together with its parallel funds and alternative investment vehicles | ||||
| Inflows | (i) At the individual strategy level, subscriptions, commitments, and other increases in available capital, such as acquisitions or leverage, net of inter-strategy transfers, and (ii) on an aggregate basis, the sum of inflows across the credit and equity investing strategies. | ||||
| IPO | Initial Public Offering | ||||
| ISG | Apollo Insurance Solutions Group LP | ||||
| ISGI | Refers collectively to Apollo Asset Management Europe LLP, a subsidiary of AAM (“AAME”) and Apollo Asset Management PC LLP, a wholly-owned subsidiary of AAME (“AAME PC”) |
||||
| Management Fee Offset | Under the terms of the limited partnership agreements for certain funds, the management fee payable by the funds may be subject to a reduction based on a certain percentage of such advisory and transaction fees, net of applicable broken deal costs. | ||||
| Market risk benefits | Guaranteed lifetime withdrawal benefits and guaranteed minimum death benefits | ||||
| Mergers | Completion of the previously announced merger transactions pursuant to the Merger Agreement | ||||
7
| Merger Agreement | The Agreement and Plan of Merger dated as of March 8, 2021 by and among AAM, AGM, AHL, Blue Merger Sub, Ltd., a Bermuda exempted company, and Green Merger Sub, Inc., a Delaware corporation. | ||||
| Merger Date | January 1, 2022 | ||||
| MFIC | MidCap Financial Investment Corporation (f/k/a Apollo Investment Corporation or “AINV”) | ||||
| MidCap FinCo | MidCap FinCo LLC, together with its subsidiaries | ||||
| Modco | Modified coinsurance | ||||
| NAIC | National Association of Insurance Commissioners | ||||
| NAV | Net Asset Value | ||||
| Net invested assets | Represent the investments that directly back Athene's net reserve liabilities as well as surplus assets. Net invested assets include Athene’s (a) total investments on the condensed consolidated statements of financial condition, with available-for-sale securities, trading securities and mortgage loans at cost or amortized cost, excluding derivatives, (b) cash and cash equivalents and restricted cash, (c) investments in related parties, (d) accrued investment income, (e) VIE and VOE assets, liabilities and non-controlling interest adjustments, (f) net investment payables and receivables, (g) policy loans ceded (which offset the direct policy loans in total investments) and (h) an adjustment for the allowance for credit losses. Net invested assets exclude the derivative collateral offsetting the related cash positions. Athene includes the investments supporting assumed funds withheld and modco agreements and excludes the investments related to ceded reinsurance transactions in order to match the assets with the income received. Net invested assets include Athene’s economic ownership of ACRA investments but do not include the investments associated with the non-controlling interests. | ||||
| Net investment earned rate | Computed as income from Athene’s net invested assets, excluding the proportionate share of the ACRA net investment income associated with the non-controlling interests, divided by the average net invested assets for the relevant period, presented on an annualized basis for interim periods. | ||||
| Net investment spread | Net investment spread measures Athene’s investment performance plus its strategic capital management fees less its total cost of funds, presented on an annualized basis for interim periods. | ||||
| Net IRR of accord series, ADIP funds and the European principal finance funds | The annualized return of a fund after management fees, performance fees allocated to the general partner and certain other expenses, calculated on investors that pay such fees. The terminal value is the net asset value as of the reporting date. Non-USD fund cash flows and residual values are converted to USD using the spot rate as of the reporting date. In addition, net IRR at the fund level will differ from that at the individual investor level as a result of, among other factors, timing of investor-level inflows and outflows. Net IRR does not represent the return to any fund investor. | ||||
| Net IRR of a traditional private equity or the hybrid value funds | The gross IRR applicable to a fund, including returns for related parties which may not pay fees or performance fees, net of management fees, certain expenses (including interest incurred or earned by the fund itself) and realized performance fees all offset to the extent of interest income, and measures returns at the fund level on amounts that, if distributed, would be paid to investors of the fund. The timing of cash flows applicable to investments, management fees and certain expenses, may be adjusted for the usage of a fund’s subscription facility. To the extent that a fund exceeds all requirements detailed within the applicable fund agreement, the estimated unrealized value is adjusted such that a percentage of up to 20.0% of the unrealized gain is allocated to the general partner of such fund, thereby reducing the balance attributable to fund investors. In addition, net IRR at the fund level will differ from that at the individual investor level as a result of, among other factors, timing of investor-level inflows and outflows. Net IRR does not represent the return to any fund investor. | ||||
| Net IRR of infrastructure funds | The cumulative cash flows in a fund (and not any one investor in the fund), on the basis of the actual timing of cash inflows received from and outflows paid to investors of the fund (assuming the ending net asset value as of the reporting date or other date specified is paid to investors), excluding certain non-fee and non-performance fee bearing parties, and the return is annualized and compounded after management fees, performance fees, and certain other expenses (including interest incurred by the fund itself) and measures the returns to investors of the fund as a whole. Non-USD fund cash flows and residual values are converted to USD using the spot rate as of the reporting date. In addition, net IRR at the fund level will differ from that at the individual investor level as a result of, among other factors, timing of investor-level inflows and outflows. Net IRR does not represent the return to any fund investor. | ||||
| Net reserve liabilities | Represent Athene's policyholder liability obligations net of reinsurance and used to analyze the costs of its liabilities. Net reserve liabilities include Athene’s (a) interest sensitive contract liabilities, (b) future policy benefits, (c) net market risk benefits, (d) long-term repurchase obligations, (e) dividends payable to policyholders and (f) other policy claims and benefits, offset by reinsurance recoverable, excluding policy loans ceded. Net reserve liabilities include Athene’s economic ownership of ACRA reserve liabilities but do not include the reserve liabilities associated with the non-controlling interests. Net reserve liabilities are net of the ceded liabilities to third-party reinsurers as the costs of the liabilities are passed to such reinsurers and, therefore, Athene has no net economic exposure to such liabilities, assuming its reinsurance counterparties perform under the agreements. Net reserve liabilities include the underlying liabilities assumed through modco reinsurance agreements in order to match the liabilities with the expenses incurred. | ||||
8
| Non-Fee-Generating AUM | AUM that does not produce management fees or monitoring fees. This measure generally includes the following: (i) fair value above invested capital for those funds that earn management fees based on invested capital; (ii) net asset values related to general partner and co-investment interests; (iii) unused credit facilities; (iv) available commitments on those funds that generate management fees on invested capital; (v) structured portfolio company investments that do not generate monitoring fees; and (vi) the difference between gross asset and net asset value for those funds that earn management fees based on net asset value. |
||||
| NYC UBT | New York City Unincorporated Business Tax | ||||
Origination |
Represents (i) capital that has been invested in new equity, debt or debt-like investments by Apollo's equity and credit strategies (whether purchased by funds and accounts managed by Apollo, or syndicated to third parties) where Apollo or one of Apollo's origination platforms has sourced, negotiated, or significantly affected the commercial terms of the investment; (ii) new capital pools formed by debt issuances, including CLOs; and (iii) net purchases of certain assets by the funds and accounts we manage that we consider to be private, illiquid, and hard to access assets and which the funds and accounts otherwise may not be able to meaningfully access. Origination generally excludes any issuance of debt or debt-like investments by the portfolio companies of the funds we manage. | ||||
| Other operating expenses within the Principal Investing segment | Expenses incurred in the normal course of business and includes allocations of non-compensation expenses related to managing the business. | ||||
| Other operating expenses within the Retirement Services segment | Expenses incurred in the normal course of business inclusive of compensation and non-compensation expenses, excluding the proportionate share of the ACRA operating expenses associated with the non-controlling interests. | ||||
| Payout annuities | Annuities with a current cash payment component, which consist primarily of single premium immediate annuities, supplemental contracts and structured settlements. | ||||
| PCD | Purchased Credit Deteriorated Investments | ||||
| Performance allocations, Performance fees, Performance revenues, Incentive fees and Incentive income | The interests granted to Apollo by a fund managed by Apollo that entitle Apollo to receive allocations, distributions or fees which are based on the performance of such fund or its underlying investments. | ||||
| Performance Fee-Eligible AUM | AUM that may eventually produce performance fees. All funds for which we are entitled to receive a performance fee allocation or incentive fee are included in Performance Fee-Eligible AUM, which consists of the following: (i) “Performance Fee-Generating AUM”, which refers to invested capital of the funds, partnerships and accounts we manage, advise, or to which we provide certain other investment-related services, that is currently above its hurdle rate or preferred return, and profit of such funds, partnerships and accounts is being allocated to, or earned by, the general partner in accordance with the applicable limited partnership agreements or other governing agreements; (ii) “AUM Not Currently Generating Performance Fees”, which refers to invested capital of the funds, partnerships and accounts we manage, advise, or to which we provide certain other investment-related services, that is currently below its hurdle rate or preferred return; and (iii) “Uninvested Performance Fee-Eligible AUM”, which refers to capital of the funds, partnerships and accounts we manage, advise, or to which we provide certain other investment-related services, that is available for investment or reinvestment subject to the provisions of applicable limited partnership agreements or other governing agreements, which capital is not currently part of the NAV or fair value of investments that may eventually produce performance fees allocable to, or earned by, the general partner. |
||||
| Perpetual capital | Assets under management of certain vehicles with an indefinite duration, which assets may only be withdrawn under certain conditions or subject to certain limitations, including satisfying required hold periods or percentage limits on the amounts that may be redeemed over a particular period. The investment management, advisory or other service agreements with our perpetual capital vehicles may be terminated under certain circumstances. |
||||
| Principal Investing Income, or PII | Component of Segment Income that is used to assess the performance of the Principal Investing segment. For the Principal Investing segment, PII is the sum of (i) realized performance fees, including certain realizations received in the form of equity, (ii) realized investment income, less (x) realized principal investing compensation expense, excluding expense related to equity-based compensation, and (y) certain corporate compensation and non-compensation expenses. | ||||
| Principal investing compensation | Realized performance compensation, distributions related to investment income and dividends, and includes allocations of certain compensation expenses related to managing the business. | ||||
| Policy loan | A loan to a policyholder under the terms of, and which is secured by, a policyholder’s policy. | ||||
| Realized Value | All cash investment proceeds received by the relevant Apollo fund, including interest and dividends, but does not give effect to management fees, expenses, incentive compensation or performance fees to be paid by such Apollo fund. | ||||
| Redding Ridge | Redding Ridge Asset Management, LLC and its subsidiaries, which is a standalone, self-managed asset management business established in connection with risk retention rules that manages CLOs and retains the required risk retention interests. | ||||
| Redding Ridge Holdings | Redding Ridge Holdings LP | ||||
9
| Remaining Cost | Total Invested Capital, reduced for any return of capital proceeds received to date. | ||||
| RMBS | Residential mortgage-backed securities | ||||
| RML | Residential mortgage loan | ||||
| RSUs | Restricted share units | ||||
| SIA | Strategic investment account | ||||
| Spread Related Earnings, or SRE | Component of Segment Income that is used to assess the performance of the Retirement Services segment, excluding certain market volatility, which consists of investment gains (losses), net of offsets and non-operating change in insurance liabilities and related derivatives, and certain expenses related to integration, restructuring, equity-based compensation, and other expenses. For the Retirement Services segment, SRE equals the sum of (i) the net investment earnings on Athene’s net invested assets and (ii) management fees received on business managed for others, less (x) cost of funds, (y) operating expenses excluding equity-based compensation and (z) financing costs, including interest expense and preferred dividends, if any, paid to Athene preferred stockholders. |
||||
| Surplus assets | Assets in excess of Athene’s policyholder obligations, determined in accordance with the applicable domiciliary jurisdiction’s statutory accounting principles. | ||||
| Tax receivable agreement | The tax receivable agreement entered into by and among APO Corp., the Former Managing Partners, the Contributing Partners, and other parties thereto | ||||
| Total Invested Capital | The aggregate cash invested by the relevant Apollo fund and includes capitalized costs relating to investment activities, if any, but does not give effect to cash pending investment or available for reserves and excludes amounts, if any, invested on a financed basis with leverage facilities | ||||
| Total Value | The sum of the total Realized Value and Unrealized Value of investments | ||||
| Traditional private equity funds | Apollo Investment Fund I, L.P. (“Fund I”), AIF II, L.P. (“Fund II”), a mirrored investment account established to mirror Fund I and Fund II for investments in debt securities (“MIA”), Apollo Investment Fund III, L.P. (together with its parallel funds, “Fund III”), Apollo Investment Fund IV, L.P. (together with its parallel fund, “Fund IV”), Apollo Investment Fund V, L.P. (together with its parallel funds and alternative investment vehicles, “Fund V”), Apollo Investment Fund VI, L.P. (together with its parallel funds and alternative investment vehicles, “Fund VI”), Apollo Investment Fund VII, L.P. (together with its parallel funds and alternative investment vehicles, “Fund VII”), Apollo Investment Fund VIII, L.P. (together with its parallel funds and alternative investment vehicles, “Fund VIII”), Apollo Investment Fund IX, L.P. (together with its parallel funds and alternative investment vehicles, “Fund IX”) and Apollo Investment Fund X, L.P. (together with its parallel funds and alternative investment vehicles, “Fund X”). |
||||
| U.S. GAAP | Generally accepted accounting principles in the United States of America | ||||
| U.S. RBC | The CAL RBC ratio for AAIA, Athene's parent U.S. insurance company | ||||
| U.S. Treasury | United States Department of the Treasury | ||||
| Unrealized Value | The fair value consistent with valuations determined in accordance with GAAP, for investments not yet realized and may include payments in kind, accrued interest and dividends receivable, if any, and before the effect of certain taxes. In addition, amounts include committed and funded amounts for certain investments. | ||||
| Venerable | Venerable Holdings, Inc., together with its subsidiaries | ||||
| VIAC | Venerable Insurance and Annuity Company | ||||
| VIE | Variable interest entity | ||||
| Vintage Year | The year in which a fund’s final capital raise occurred, or, for certain funds, the year of a fund’s effective date or the year in which a fund’s investment period commences pursuant to its governing agreements. | ||||
| VOBA | Value of business acquired | ||||
| VOE | Voting interest entity | ||||
| WACC | Weighted average cost of capital | ||||
10
PART I - FINANCIAL INFORMATION
ITEM 1. FINANCIAL STATEMENTS
Index to Condensed Consolidated Financial Statements (unaudited)
APOLLO GLOBAL MANAGEMENT, INC.
CONDENSED CONSOLIDATED STATEMENTS OF FINANCIAL CONDITION (UNAUDITED)
| (In millions, except share data) | As of June 30, 2025 |
As of December 31, 2024 |
|||||||||
| Assets | |||||||||||
| Asset Management | |||||||||||
| Cash and cash equivalents | $ | $ | |||||||||
| Restricted cash and cash equivalents | |||||||||||
| Investments | |||||||||||
| Assets of consolidated variable interest entities | |||||||||||
| Cash and cash equivalents | |||||||||||
| Investments | |||||||||||
| Other assets | |||||||||||
| Due from related parties | |||||||||||
| Goodwill | |||||||||||
| Other assets | |||||||||||
| Retirement Services | |||||||||||
| Cash and cash equivalents | |||||||||||
| Restricted cash and cash equivalents | |||||||||||
| Investments | |||||||||||
| Investments in related parties | |||||||||||
| Assets of consolidated variable interest entities | |||||||||||
| Cash and cash equivalents | |||||||||||
| Investments | |||||||||||
| Other assets | |||||||||||
| Reinsurance recoverable | |||||||||||
| Deferred acquisition costs, deferred sales inducements and value of business acquired | |||||||||||
| Goodwill | |||||||||||
| Other assets | |||||||||||
| Total Assets | $ |
|
$ |
|
|||||||
| (Continued) | |||||||||||
See accompanying notes to the unaudited condensed consolidated financial statements. | |||||||||||
12
APOLLO GLOBAL MANAGEMENT, INC.
CONDENSED CONSOLIDATED STATEMENTS OF FINANCIAL CONDITION (UNAUDITED)
| (In millions, except share data) | As of June 30, 2025 |
As of December 31, 2024 |
|||||||||
| Liabilities, Redeemable non-controlling interests and Equity | |||||||||||
| Liabilities | |||||||||||
| Asset Management | |||||||||||
| Accounts payable, accrued expenses, and other liabilities | $ | $ | |||||||||
| Due to related parties | |||||||||||
| Debt | |||||||||||
| Liabilities of consolidated variable interest entities | |||||||||||
| Other liabilities | |||||||||||
| Retirement Services | |||||||||||
| Interest sensitive contract liabilities | |||||||||||
| Future policy benefits | |||||||||||
| Market risk benefits | |||||||||||
| Debt | |||||||||||
| Payables for collateral on derivatives and securities to repurchase | |||||||||||
| Other liabilities | |||||||||||
| Liabilities of consolidated variable interest entities | |||||||||||
| Other liabilities | |||||||||||
| Total Liabilities |
|
|
|||||||||
Commitments and Contingencies (note 16) |
|||||||||||
| Redeemable non-controlling interests | |||||||||||
| Redeemable non-controlling interests | |||||||||||
| Equity | |||||||||||
Mandatory Convertible Preferred Stock, |
|||||||||||
Common Stock, $ |
|||||||||||
| Additional paid in capital | |||||||||||
| Retained earnings (accumulated deficit) | |||||||||||
| Accumulated other comprehensive income (loss) | ( |
( |
|||||||||
| Total Apollo Global Management, Inc. Stockholders’ Equity | |||||||||||
| Non-controlling interests | |||||||||||
| Total Equity |
|
|
|||||||||
| Total Liabilities, Redeemable non-controlling interests and Equity | $ |
|
$ |
|
|||||||
| (Concluded) | |||||||||||
See accompanying notes to the unaudited condensed consolidated financial statements. | |||||||||||
13
APOLLO GLOBAL MANAGEMENT, INC.
CONDENSED CONSOLIDATED STATEMENTS OF OPERATIONS (UNAUDITED)
| Three months ended June 30, | Six months ended June 30, | ||||||||||||||||||||||
| (In millions, except per share data) | 2025 | 2024 | 2025 | 2024 | |||||||||||||||||||
| Revenues | |||||||||||||||||||||||
| Asset Management | |||||||||||||||||||||||
| Management fees | $ | $ | $ | $ | |||||||||||||||||||
| Advisory and transaction fees, net | |||||||||||||||||||||||
| Investment income (loss) | |||||||||||||||||||||||
| Incentive fees | |||||||||||||||||||||||
| Retirement Services | |||||||||||||||||||||||
| Premiums | |||||||||||||||||||||||
| Product charges | |||||||||||||||||||||||
| Net investment income | |||||||||||||||||||||||
| Investment related gains (losses) | ( |
( |
( |
||||||||||||||||||||
| Revenues of consolidated variable interest entities | |||||||||||||||||||||||
| Other revenues | |||||||||||||||||||||||
| Total Revenues | |||||||||||||||||||||||
| Expenses | |||||||||||||||||||||||
| Asset Management | |||||||||||||||||||||||
| Compensation and benefits | |||||||||||||||||||||||
| Interest expense | |||||||||||||||||||||||
| General, administrative and other | |||||||||||||||||||||||
| Retirement Services | |||||||||||||||||||||||
| Interest sensitive contract benefits | |||||||||||||||||||||||
| Future policy and other policy benefits | |||||||||||||||||||||||
| Market risk benefits remeasurement (gains) losses | ( |
( |
( |
||||||||||||||||||||
| Amortization of deferred acquisition costs, deferred sales inducements and value of business acquired | |||||||||||||||||||||||
| Policy and other operating expenses | |||||||||||||||||||||||
| Total Expenses | |||||||||||||||||||||||
Other income (loss) – Asset Management |
|||||||||||||||||||||||
| Net gains (losses) from investment activities | ( |
( |
( |
||||||||||||||||||||
| Net gains (losses) from investment activities of consolidated variable interest entities | |||||||||||||||||||||||
| Other income (loss), net | ( |
( |
|||||||||||||||||||||
| Total Other income (loss) | ( |
( |
|||||||||||||||||||||
| Income (loss) before income tax (provision) benefit | |||||||||||||||||||||||
| Income tax (provision) benefit | ( |
( |
( |
( |
|||||||||||||||||||
| Net income (loss) | |||||||||||||||||||||||
| Net (income) loss attributable to non-controlling interests | ( |
( |
( |
( |
|||||||||||||||||||
| Net income (loss) attributable to Apollo Global Management, Inc. | |||||||||||||||||||||||
| Preferred stock dividends | ( |
( |
( |
( |
|||||||||||||||||||
| Net income (loss) attributable to Apollo Global Management, Inc. common stockholders | $ | $ | $ | $ | |||||||||||||||||||
| Earnings (loss) per share | |||||||||||||||||||||||
| Net income (loss) attributable to common stockholders - Basic | $ | $ | $ | $ | |||||||||||||||||||
| Net income (loss) attributable to common stockholders - Diluted | $ | $ | $ | $ | |||||||||||||||||||
| Weighted average shares outstanding – Basic | |||||||||||||||||||||||
| Weighted average shares outstanding – Diluted | |||||||||||||||||||||||
See accompanying notes to the unaudited condensed consolidated financial statements. |
|||||||||||||||||||||||
14
APOLLO GLOBAL MANAGEMENT, INC.
CONDENSED CONSOLIDATED STATEMENTS OF COMPREHENSIVE INCOME (LOSS) (UNAUDITED)
| Three months ended June 30, | Six months ended June 30, | ||||||||||||||||||||||
| (In millions) | 2025 | 2024 | 2025 | 2024 | |||||||||||||||||||
| Net income (loss) | $ | $ | $ | ||||||||||||||||||||
| Other comprehensive income (loss), before tax | |||||||||||||||||||||||
| Unrealized investment gains (losses) on available-for-sale securities | ( |
( |
|||||||||||||||||||||
| Unrealized gains (losses) on hedging instruments | ( |
||||||||||||||||||||||
| Remeasurement gains (losses) on future policy benefits related to discount rate | ( |
( |
|||||||||||||||||||||
| Remeasurement gains (losses) on market risk benefits related to credit risk | ( |
( |
|||||||||||||||||||||
| Foreign currency translation and other adjustments | ( |
( |
|||||||||||||||||||||
| Other comprehensive income (loss), before tax | ( |
( |
|||||||||||||||||||||
| Income tax expense (benefit) related to other comprehensive income (loss) | ( |
( |
|||||||||||||||||||||
| Other comprehensive income (loss) | ( |
( |
|||||||||||||||||||||
| Comprehensive income (loss) | |||||||||||||||||||||||
| Comprehensive (income) loss attributable to non-controlling interests | ( |
( |
( |
( |
|||||||||||||||||||
| Comprehensive income (loss) attributable to Apollo Global Management, Inc. | $ | $ | $ | $ | |||||||||||||||||||
See accompanying notes to the unaudited condensed consolidated financial statements. | |||||||||||||||||||||||
15
APOLLO GLOBAL MANAGEMENT, INC.
CONDENSED CONSOLIDATED STATEMENTS OF EQUITY (UNAUDITED)
For the three and six months ended June 30, 2024 |
|||||||||||||||||||||||||||||||||||||||||||||||
| Apollo Global Management, Inc. Stockholders | |||||||||||||||||||||||||||||||||||||||||||||||
| (In millions, except share data) | Common Stock | Series A Mandatory Convertible Preferred Stock |
Additional Paid in Capital |
Retained Earnings (Accumulated Deficit) | Accumulated Other Comprehensive Income (Loss) |
Total Apollo Global Management, Inc. Stockholders’ Equity (Deficit) |
Non-Controlling Interests |
Total Equity | |||||||||||||||||||||||||||||||||||||||
Balance at April 1, 2024 |
|
$ |
|
$ |
|
$ |
|
$ | ( |
$ |
|
$ |
|
$ |
|
||||||||||||||||||||||||||||||||
| Consolidation/deconsolidation of VIEs | — | — | — | — | — | — | ( |
( |
|||||||||||||||||||||||||||||||||||||||
| Other changes in equity of non-controlling interests | — | — | — | — | — | — | |||||||||||||||||||||||||||||||||||||||||
| Issuance of common stock related to equity transactions | — | — | — | — | |||||||||||||||||||||||||||||||||||||||||||
| Capital increase related to equity-based compensation | — | — | — | — | — | ||||||||||||||||||||||||||||||||||||||||||
| Capital contributions | — | — | — | — | — | — | |||||||||||||||||||||||||||||||||||||||||
| Dividends/distributions | — | ( |
— | ( |
— | ( |
( |
( |
|||||||||||||||||||||||||||||||||||||||
| Payments related to issuances of common stock for equity-based awards | — | ( |
— | ( |
— | ( |
|||||||||||||||||||||||||||||||||||||||||
| Repurchase of common stock | ( |
— | ( |
— | — | ( |
— | ( |
|||||||||||||||||||||||||||||||||||||||
| Stock option exercises | — | — | — | — | |||||||||||||||||||||||||||||||||||||||||||
| Net income (loss) | — | — | — | ||||||||||||||||||||||||||||||||||||||||||||
| Other comprehensive income (loss) | — | — | — | — | ( |
( |
( |
( |
|||||||||||||||||||||||||||||||||||||||
Balance at June 30, 2024 |
|
$ |
|
$ |
|
$ |
|
$ | ( |
$ |
|
$ |
|
$ |
|
||||||||||||||||||||||||||||||||
Balance at January 1, 2024 |
|
$ |
|
$ |
|
$ |
|
$ | ( |
$ |
|
$ |
|
$ |
|
||||||||||||||||||||||||||||||||
| Consolidation/deconsolidation of VIEs | — | — | — | — | — | — | ( |
( |
|||||||||||||||||||||||||||||||||||||||
| Other changes in equity of non-controlling interests | — | — | — | — | — | — | |||||||||||||||||||||||||||||||||||||||||
| Issuance of common stock related to equity transactions | — | — | — | — | |||||||||||||||||||||||||||||||||||||||||||
| Accretion of redeemable non-controlling interests | — | — | ( |
— | — | ( |
— | ( |
|||||||||||||||||||||||||||||||||||||||
| Capital increase related to equity-based compensation | — | — | — | — | — | ||||||||||||||||||||||||||||||||||||||||||
| Capital contributions | — | — | — | — | — | — | |||||||||||||||||||||||||||||||||||||||||
| Dividends/distributions | — | ( |
— | ( |
— | ( |
( |
( |
|||||||||||||||||||||||||||||||||||||||
| Payments related to issuances of common stock for equity-based awards | — | ( |
— | ( |
— | ( |
|||||||||||||||||||||||||||||||||||||||||
| Repurchase of common stock | ( |
— | ( |
— | — | ( |
— | ( |
|||||||||||||||||||||||||||||||||||||||
| Stock option exercises | — | — | — | — | |||||||||||||||||||||||||||||||||||||||||||
| Net income (loss) | — | — | — | ||||||||||||||||||||||||||||||||||||||||||||
| Other comprehensive income (loss) | — | — | — | — | ( |
( |
( |
( |
|||||||||||||||||||||||||||||||||||||||
Balance at June 30, 2024 |
|
$ |
|
$ |
|
$ |
|
$ | ( |
$ |
|
$ |
|
$ |
|
||||||||||||||||||||||||||||||||
16
APOLLO GLOBAL MANAGEMENT, INC.
CONDENSED CONSOLIDATED STATEMENTS OF EQUITY (UNAUDITED)
For the three and six months ended June 30, 2025 |
|||||||||||||||||||||||||||||||||||||||||||||||
| Apollo Global Management, Inc. Stockholders | |||||||||||||||||||||||||||||||||||||||||||||||
| (In millions, except share data) | Common Stock | Series A Mandatory Convertible Preferred Stock |
Additional Paid in Capital |
Retained Earnings (Accumulated Deficit) | Accumulated Other Comprehensive Income (Loss) |
Total Apollo Global Management, Inc. Stockholders’ Equity (Deficit) |
Non-Controlling
Interests
|
Total Equity |
|||||||||||||||||||||||||||||||||||||||
| Balance at April 1, 2025 |
|
$ |
|
$ |
|
$ |
|
$ | ( |
$ |
|
$ |
|
$ |
|
||||||||||||||||||||||||||||||||
| Other changes in equity of non-controlling interests | — | — | — | — | — | — | ( |
( |
|||||||||||||||||||||||||||||||||||||||
| Capital increase related to equity-based compensation | — | — | — | — | — | ||||||||||||||||||||||||||||||||||||||||||
| Capital contributions | — | — | — | — | — | — | |||||||||||||||||||||||||||||||||||||||||
| Dividends/distributions | — | ( |
— | ( |
— | ( |
( |
( |
|||||||||||||||||||||||||||||||||||||||
| Payments related to issuances of common stock for equity-based awards | — | ( |
— | ( |
— | ( |
|||||||||||||||||||||||||||||||||||||||||
| Stock option and warrant exercises | — | — | — | — | |||||||||||||||||||||||||||||||||||||||||||
| Net income (loss) | — | — | — | ||||||||||||||||||||||||||||||||||||||||||||
| Other comprehensive income (loss) | — | — | — | — | |||||||||||||||||||||||||||||||||||||||||||
Balance at June 30, 2025 |
|
$ |
|
$ |
|
$ |
|
$ | ( |
$ |
|
$ |
|
$ |
|
||||||||||||||||||||||||||||||||
Balance at January 1, 2025 |
|
$ |
|
$ |
|
$ |
|
$ | ( |
$ |
|
$ |
|
$ |
|
||||||||||||||||||||||||||||||||
| Consolidation/deconsolidation of VIEs | — | — | — | — | — | — | ( |
( |
|||||||||||||||||||||||||||||||||||||||
| Issuance of warrants | — | — | — | — | — | ||||||||||||||||||||||||||||||||||||||||||
| Other changes in equity of non-controlling interests | — | — | — | — | — | — | ( |
( |
|||||||||||||||||||||||||||||||||||||||
| Issuance of common stock related to equity transactions | — | — | — | — | — | — | — | ||||||||||||||||||||||||||||||||||||||||
| Accretion of redeemable non-controlling interests | — | — | — | — | — | ||||||||||||||||||||||||||||||||||||||||||
| Issuance of common stock to donor-advised fund | — | — | — | — | |||||||||||||||||||||||||||||||||||||||||||
| Capital increase related to equity-based compensation | — | — | — | — | — | ||||||||||||||||||||||||||||||||||||||||||
| Capital contributions | — | — | — | — | — | — | |||||||||||||||||||||||||||||||||||||||||
| Dividends/distributions | — | ( |
— | ( |
— | ( |
( |
( |
|||||||||||||||||||||||||||||||||||||||
| Payments related to issuances of common stock for equity-based awards | — | ( |
— | ( |
— | ( |
|||||||||||||||||||||||||||||||||||||||||
| Repurchase of common stock | ( |
— | ( |
— | — | ( |
— | ( |
|||||||||||||||||||||||||||||||||||||||
| Stock option and warrant exercises | — | — | — | — | |||||||||||||||||||||||||||||||||||||||||||
| Net income (loss) | — | — | — | ||||||||||||||||||||||||||||||||||||||||||||
| Other comprehensive income (loss) | — | — | — | — | |||||||||||||||||||||||||||||||||||||||||||
Balance at June 30, 2025 |
|
$ |
|
$ |
|
$ |
|
$ | ( |
$ |
|
$ |
|
$ |
|
||||||||||||||||||||||||||||||||
| (Concluded) | |||||||||||||||||||||||||||||||||||||||||||||||
See accompanying notes to the unaudited condensed consolidated financial statements. | |||||||||||||||||||||||||||||||||||||||||||||||
17
APOLLO GLOBAL MANAGEMENT, INC.
CONDENSED CONSOLIDATED STATEMENTS OF CASH FLOWS (UNAUDITED)
| Six months ended June 30, | |||||||||||
| (In millions) | 2025 | 2024 | |||||||||
| Cash Flows from Operating Activities | |||||||||||
| Net income (loss) | $ | $ | |||||||||
| Adjustments to reconcile net income (loss) to net cash provided by operating activities: | |||||||||||
| Equity-based compensation | |||||||||||
| Net investment income | ( |
( |
|||||||||
| Net recognized (gains) losses on investments and derivatives | ( |
||||||||||
| Depreciation and amortization | |||||||||||
| Net amortization (accretion) of net investment premiums, discount and other | ( |
( |
|||||||||
| Policy acquisition costs deferred | ( |
( |
|||||||||
| Other non-cash amounts included in net income (loss), net | |||||||||||
| Changes in consolidation | ( |
( |
|||||||||
| Changes in operating assets and liabilities: | |||||||||||
| Purchases of investments by funds and VIEs | ( |
( |
|||||||||
| Proceeds from sale of investments by funds and VIEs | |||||||||||
| Interest sensitive contract liabilities | |||||||||||
| Future policy benefits, market risk benefits and reinsurance recoverable | ( |
( |
|||||||||
| Other assets and liabilities, net | ( |
( |
|||||||||
| Net cash provided by operating activities | $ | $ | |||||||||
| Cash Flows from Investing Activities | |||||||||||
| Purchases of investments and contributions to equity method investments | $ | ( |
$ | ( |
|||||||
| Purchases of available-for-sale securities | ( |
( |
|||||||||
| Purchases of mortgage loans | ( |
( |
|||||||||
| Purchases of investment funds | ( |
( |
|||||||||
| Purchases of U.S. Treasury securities | ( |
||||||||||
| Purchases of derivatives instruments and other investments | ( |
( |
|||||||||
| Sales, maturities and repayments of investments and distributions from equity method investments | |||||||||||
| Other investing activities, net | ( |
( |
|||||||||
| Net cash used in investing activities | $ | ( |
$ | ( |
|||||||
| Cash Flows from Financing Activities | |||||||||||
| Issuance of debt | $ | $ | |||||||||
| Repayment of debt | ( |
( |
|||||||||
| Repurchase of common stock | ( |
( |
|||||||||
| Common stock dividends | ( |
( |
|||||||||
| Preferred stock dividends | ( |
( |
|||||||||
| Distributions paid to non-controlling interests | ( |
( |
|||||||||
| Contributions from non-controlling interests | |||||||||||
| Deposits on investment-type policies and contracts | |||||||||||
| Withdrawals on investment-type policies and contracts | ( |
( |
|||||||||
| Net change in cash collateral posted for derivative transactions and securities to repurchase | ( |
||||||||||
| Other financing activities, net | ( |
( |
|||||||||
| Net cash provided by financing activities | $ | $ | |||||||||
| Effect of exchange rate changes on cash and cash equivalents | ( |
||||||||||
| Net increase (decrease) in cash and cash equivalents, restricted cash and cash held at consolidated variable interest entities | ( |
||||||||||
| Cash and cash equivalents, restricted cash and cash equivalents, and cash and cash equivalents held at consolidated variable interest entities, beginning of period | |||||||||||
| Cash and cash equivalents, restricted cash and cash equivalents, and cash and cash equivalents held at consolidated variable interest entities, end of period | $ | $ | |||||||||
| (Continued) | |||||||||||
18
APOLLO GLOBAL MANAGEMENT, INC.
CONDENSED CONSOLIDATED STATEMENTS OF CASH FLOWS (UNAUDITED)
| Six months ended June 30, | |||||||||||
| (In millions) | 2025 | 2024 | |||||||||
| Supplemental Disclosure of Cash Flow Information | |||||||||||
| Cash paid for taxes | $ | $ | |||||||||
| Cash paid for interest | |||||||||||
| Non-cash transactions | |||||||||||
| Non-cash investing activities | |||||||||||
| Retirement Services | |||||||||||
| Investments received from settlements on reinsurance agreements | |||||||||||
| Investments received from pension group annuity premiums | |||||||||||
| Non-cash financing activities | |||||||||||
| Asset Management and Other | |||||||||||
| Capital increases related to equity-based compensation | |||||||||||
| Issuance of warrants | |||||||||||
| Issuance of restricted shares | |||||||||||
| Issuance of common stock related to equity transactions | |||||||||||
| Issuance of common stock to donor-advise fund | |||||||||||
| Retirement Services | |||||||||||
| Deposits on investment-type policies and contracts through reinsurance agreements, net assumed (ceded) | ( |
( |
|||||||||
| Withdrawals on investment-type policies and contracts through reinsurance agreements, net assumed (ceded) | |||||||||||
| Supplemental Disclosure of Cash Flow Information of Consolidated VIEs | |||||||||||
| Cash Flows from Operating Activities | |||||||||||
Purchases of investments - Asset Management
|
( |
( |
|||||||||
Proceeds from sale of investments - Asset Management
|
|||||||||||
| Cash Flows from Investing Activities | |||||||||||
Purchases of investments - Retirement Services
|
( |
( |
|||||||||
Proceeds from sale of investments - Retirement Services
|
|||||||||||
| Cash Flows from Financing Activities | |||||||||||
| Issuance of debt | |||||||||||
| Principal repayment of debt | ( |
( |
|||||||||
| Distributions paid to non-controlling interests | ( |
( |
|||||||||
| Contributions from non-controlling interests | |||||||||||
| Other financing activities, net | |||||||||||
| Changes in Consolidation | |||||||||||
| Investments, at fair value | ( |
( |
|||||||||
| Equity method investments | |||||||||||
| Other assets | ( |
( |
|||||||||
| Other liabilities | |||||||||||
| Non-controlling interest | |||||||||||
| Equity | |||||||||||
Reconciliation of cash and cash equivalents, restricted cash and cash equivalents, and cash and cash equivalents held at consolidated variable interest entities to the condensed consolidated Statements of Financial Condition: |
|||||||||||
| Cash and cash equivalents | $ | $ | |||||||||
| Restricted cash and cash equivalents | |||||||||||
| Cash and cash equivalents held at consolidated variable interest entities | |||||||||||
| Total cash and cash equivalents, restricted cash and cash equivalents, and cash and cash equivalents held at consolidated variable interest entities | $ | $ | |||||||||
| (Concluded) | |||||||||||
See accompanying notes to the unaudited condensed consolidated financial statements. | |||||||||||
19
APOLLO GLOBAL MANAGEMENT, INC.
NOTES TO CONDENSED CONSOLIDATED FINANCIAL STATEMENTS (UNAUDITED)
1. Organization
Apollo Global Management, Inc. together with its consolidated subsidiaries (collectively, “Apollo” or the “Company”) is a high-growth, global alternative asset manager and a retirement services provider. Its asset management business focuses on two investing strategies: credit and equity. Through its asset management business, Apollo raises, invests and manages funds, accounts and other vehicles, on behalf of some of the world’s most prominent pension, endowment and sovereign wealth funds and insurance companies, as well as other institutional and individual investors. Apollo’s retirement services business is conducted by Athene, a leading financial services company that specializes in issuing, reinsuring and acquiring retirement savings products for the increasing number of individuals and institutions seeking to fund retirement needs.
Bridge Acquisition
On February 23, 2025, the Company entered into a definitive agreement for Apollo to acquire Bridge Investment Group Holdings Inc. (“Bridge”) in an all-stock transaction. The transaction is expected to close in the third quarter of 2025, subject to customary closing conditions and the receipt of regulatory approvals.
2. Summary of Significant Accounting Policies
Basis of Presentation and Consolidation
The accompanying unaudited condensed consolidated financial statements are prepared in accordance with U.S. GAAP for interim financial information and the SEC’s rules and regulations for Form 10-Q and Article 10 of Regulation S-X. Certain disclosures included in the annual audited financial statements have been condensed or omitted as they are not required for interim financial statements under U.S. GAAP and the rules of the SEC. The operating results presented for interim periods are not necessarily indicative of the results that may be expected for any other interim period or for the entire year. These condensed consolidated financial statements should be read in conjunction with the annual audited financial statements included in the 2024 Annual Report.
The results of the Company and its subsidiaries are presented on a consolidated basis. Any ownership interest other than the Company’s interest in its subsidiaries is reflected as a non-controlling interest. Intercompany accounts and transactions have been eliminated. Management believes it has made all necessary adjustments (consisting only of normal recurring items) so that the condensed consolidated financial statements are presented fairly and that any estimates made are reasonable and prudent. Certain reclassifications have been made to previously reported amounts to conform to the current period’s presentation.
Deferred Revenue
Recently Issued Accounting Pronouncements
Income Taxes—Improvements to Income Tax Disclosures (ASU 2023-09)
In December 2023, the FASB made amendments to update disclosures on income taxes including rate reconciliation, income taxes paid, and certain amendments on disaggregation by federal, state, and foreign taxes, as relevant.
20
APOLLO GLOBAL MANAGEMENT, INC.
NOTES TO CONDENSED CONSOLIDATED FINANCIAL STATEMENTS (UNAUDITED)
The guidance is mandatorily effective for the Company for annual periods beginning in 2025. The Company is currently evaluating the impact of the new standard on its consolidated financial statements.
Income Statement - Reporting Comprehensive Income - Expense Disaggregation Disclosures (ASU 2024-03)
In November 2024, the FASB issued guidance that requires disaggregation of certain expense captions into specified categories in disclosures within the footnotes to the financial statements. The ASU requires tabular presentation of each relevant expense caption on the face of the income statement including employee compensation, depreciation, intangible asset amortization, and certain other expenses, when applicable.
The guidance is mandatorily effective for the Company in its 2027 annual report and in interim periods in 2028; early adoption is permitted. The Company is currently evaluating the impact of the new pronouncement on its consolidated financial statements.
Business Combinations and Consolidation (ASU 2025-03)
In May 2025, the FASB issued guidance clarifying how to identify the accounting acquirer in business combinations involving variable interest entities. The ASU requires an assessment of control and economic interests to determine the acquirer for consolidation purposes.
The guidance is mandatorily effective for the Company for fiscal years beginning after December 15, 2026, including interim periods therein; early adoption is permitted. The Company is currently evaluating the impact of the new pronouncement on its consolidated financial statements.
Compensation – Stock Compensation and Revenue from Contracts with Customers (ASU 2025-04)
In June 2025, the FASB issued guidance clarifying the accounting for share-based consideration payable to customers, specifically addressing when such payments should be classified as stock compensation expense versus a reduction of revenue.
The guidance is mandatorily effective for the Company for fiscal years beginning after December 15, 2026, including interim periods therein; early adoption is permitted. The Company is currently evaluating the impact of the new pronouncement on its consolidated financial statements.
Recently Adopted Accounting Pronouncements
Business Combinations – Joint Venture Formations (ASU 2023-05)
In August 2023, the FASB issued amendments to address how a joint venture initially recognizes and measures contributions received at its formation date. The amendments require a joint venture to apply a new basis of accounting upon formation and to initially recognize its assets and liabilities at fair value.
The Company adopted the guidance on January 1, 2025, and there was no impact on the condensed consolidated financial statements upon adoption.
Intangibles—Goodwill and Other—Crypto Assets: Accounting for and Disclosure of Crypto Assets (ASU 2023-08)
In December 2023, the FASB issued amendments on the accounting for and disclosure of crypto assets. The guidance requires assets that meet certain conditions be accounted for at fair value with changes in fair value recognized in net income. The ASU also requires disclosures about significant holdings, contractual sale restrictions, and changes during the reporting period.
The Company adopted the guidance on January 1, 2025, and there was no impact on the condensed consolidated financial statements upon adoption.
Compensation – Stock Compensation (ASU 2024-01)
In March 2024, the FASB issued guidance in ASU 2024-01 that clarifies how an entity determines whether it is required to account for profits interest awards (and similar awards) in accordance with ASC 718 or other guidance. The ASU provides
21
APOLLO GLOBAL MANAGEMENT, INC.
NOTES TO CONDENSED CONSOLIDATED FINANCIAL STATEMENTS (UNAUDITED)
specific examples on when a profits interest award should be accounted for as a share-based payment arrangement under ASC 718 or in a manner similar to a cash bonus or profit-sharing arrangement under ASC 710 or other ASC topics.
The Company adopted the guidance on January 1, 2025, and there was no impact on the condensed consolidated financial statements upon adoption.
Segment Reporting – Improvements to Reporting Segment Disclosures (ASU 2023-07)
In November 2023, the FASB issued guidance to incrementally add disclosures for public entities’ reporting segments including significant segment expenses and other segment items.
The Company adopted the guidance for the annual reporting period ended December 31, 2024, and in interim periods beginning January 1, 2025. Refer to Note 17, Segments, for the expanded disclosures.
3. Investments
The following table outlines the Company’s investments:
| (In millions) | June 30, 2025 | December 31, 2024 | |||||||||
| Asset Management | |||||||||||
| Investments, at fair value | $ | $ | |||||||||
| Equity method investments | |||||||||||
| Performance allocations | |||||||||||
| Other investments | |||||||||||
Total Investments – Asset Management |
|||||||||||
Retirement Services |
|||||||||||
| AFS securities, at fair value | $ | $ | |||||||||
| Trading securities, at fair value | |||||||||||
| Equity securities, at fair value | |||||||||||
| Mortgage loans, at fair value | |||||||||||
| Investment funds | |||||||||||
| Policy loans | |||||||||||
| Funds withheld at interest | |||||||||||
| Short-term investments | |||||||||||
| Other investments | |||||||||||
Total Investments, including related parties – Retirement Services |
|||||||||||
| Total Investments | $ | $ | |||||||||
Asset Management
Net Gains (Losses) from Investment Activities
The following outlines realized and net change in unrealized gains (losses) reported in net gains (losses) from investment activities:
| Three months ended June 30, | Six months ended June 30, | ||||||||||||||||||||||
| (In millions) | 2025 | 2024 | 2025 | 2024 | |||||||||||||||||||
| Realized gains (losses) on sales of investments, net | $ | $ | ( |
$ | ( |
$ | ( |
||||||||||||||||
| Net change in unrealized gains (losses) due to changes in fair value | ( |
( |
( |
||||||||||||||||||||
| Net gains (losses) from investment activities | $ | ( |
$ | ( |
$ | ( |
$ | ||||||||||||||||
22
APOLLO GLOBAL MANAGEMENT, INC.
NOTES TO CONDENSED CONSOLIDATED FINANCIAL STATEMENTS (UNAUDITED)
Performance Allocations
Performance allocations receivable is recorded within investments in the condensed consolidated statements of financial condition. The table below provides a roll forward of the performance allocations balance:
| (In millions) | Total | ||||
Performance allocations, January 1, 2025 |
$ | ||||
| Change in fair value of funds | |||||
| Fund distributions to the Company | ( |
||||
Performance allocations, June 30, 2025 |
$ | ||||
The change in fair value of funds excludes the general partner obligation to return previously distributed performance allocations, which is recorded in due to related parties in the condensed consolidated statements of financial condition.
The timing of the payment of performance allocations due to the general partner or investment manager varies depending on the terms of the applicable fund agreements. Generally, performance allocations with respect to the equity funds and certain credit funds we manage are payable and are distributed to the fund’s general partner upon realization of an investment if the fund’s cumulative returns are in excess of the preferred return.
Retirement Services
AFS Securities
The following table represents the amortized cost, allowance for credit losses, gross unrealized gains and losses and fair value of Athene’s AFS investments by asset type:
| June 30, 2025 | |||||||||||||||||||||||||||||
| (In millions) | Amortized Cost | Allowance for Credit Losses | Gross Unrealized Gains | Gross Unrealized Losses | Fair Value | ||||||||||||||||||||||||
| AFS securities | |||||||||||||||||||||||||||||
| U.S. government and agencies | $ | $ | $ | $ | ( |
$ | |||||||||||||||||||||||
| U.S. state, municipal and political subdivisions | ( |
||||||||||||||||||||||||||||
| Foreign governments | ( |
||||||||||||||||||||||||||||
| Corporate | ( |
( |
|||||||||||||||||||||||||||
| CLO | ( |
||||||||||||||||||||||||||||
| ABS | ( |
( |
|||||||||||||||||||||||||||
| CMBS | ( |
( |
|||||||||||||||||||||||||||
| RMBS | ( |
( |
|||||||||||||||||||||||||||
| Total AFS securities | ( |
( |
|||||||||||||||||||||||||||
| AFS securities – related parties | |||||||||||||||||||||||||||||
| Corporate | ( |
||||||||||||||||||||||||||||
| CLO | ( |
||||||||||||||||||||||||||||
| ABS | ( |
( |
|||||||||||||||||||||||||||
| Total AFS securities – related parties | ( |
( |
|||||||||||||||||||||||||||
| Total AFS securities, including related parties | $ | $ | ( |
$ | $ | ( |
$ | ||||||||||||||||||||||
23
APOLLO GLOBAL MANAGEMENT, INC.
NOTES TO CONDENSED CONSOLIDATED FINANCIAL STATEMENTS (UNAUDITED)
| December 31, 2024 | |||||||||||||||||||||||||||||
| (In millions) | Amortized Cost | Allowance for Credit Losses | Gross Unrealized Gains | Gross Unrealized Losses | Fair Value | ||||||||||||||||||||||||
| AFS securities | |||||||||||||||||||||||||||||
| U.S. government and agencies | $ | $ | $ | $ | ( |
$ | |||||||||||||||||||||||
| U.S. state, municipal and political subdivisions | ( |
||||||||||||||||||||||||||||
| Foreign governments | ( |
||||||||||||||||||||||||||||
| Corporate | ( |
( |
|||||||||||||||||||||||||||
| CLO | ( |
||||||||||||||||||||||||||||
| ABS | ( |
( |
|||||||||||||||||||||||||||
| CMBS | ( |
( |
|||||||||||||||||||||||||||
| RMBS | ( |
( |
|||||||||||||||||||||||||||
| Total AFS securities | ( |
( |
|||||||||||||||||||||||||||
| AFS securities – related parties | |||||||||||||||||||||||||||||
| Corporate | ( |
||||||||||||||||||||||||||||
| CLO | ( |
||||||||||||||||||||||||||||
| ABS | ( |
( |
|||||||||||||||||||||||||||
| Total AFS securities – related parties | ( |
( |
|||||||||||||||||||||||||||
| Total AFS securities, including related parties | $ | $ | ( |
$ | $ | ( |
$ | ||||||||||||||||||||||
The amortized cost and fair value of AFS securities, including related parties, are shown by contractual maturity below:
| June 30, 2025 | |||||||||||
| (In millions) | Amortized Cost | Fair Value | |||||||||
| AFS securities | |||||||||||
| Due in one year or less | $ | $ | |||||||||
| Due after one year through five years | |||||||||||
| Due after five years through ten years | |||||||||||
| Due after ten years | |||||||||||
| CLO, ABS, CMBS and RMBS | |||||||||||
| Total AFS securities | |||||||||||
| AFS securities – related parties | |||||||||||
| Due after one year through five years | |||||||||||
| Due after five years through ten years | |||||||||||
| Due after ten years | |||||||||||
| CLO and ABS | |||||||||||
| Total AFS securities – related parties | |||||||||||
| Total AFS securities, including related parties | $ | $ | |||||||||
Actual maturities can differ from contractual maturities as borrowers may have the right to call or prepay obligations with or without call or prepayment penalties.
24
APOLLO GLOBAL MANAGEMENT, INC.
NOTES TO CONDENSED CONSOLIDATED FINANCIAL STATEMENTS (UNAUDITED)
Unrealized Losses on AFS Securities
The following summarizes the fair value and gross unrealized losses for AFS securities, including related parties, for which an allowance for credit losses has not been recorded, aggregated by asset type and length of time the fair value has remained below amortized cost:
| June 30, 2025 | |||||||||||||||||||||||||||||||||||
| Less than 12 months | 12 months or more | Total | |||||||||||||||||||||||||||||||||
| (In millions) | Fair Value | Gross Unrealized Losses | Fair Value | Gross Unrealized Losses | Fair Value | Gross Unrealized Losses | |||||||||||||||||||||||||||||
| AFS securities | |||||||||||||||||||||||||||||||||||
| U.S. government and agencies | $ | $ | ( |
$ | $ | ( |
$ | $ | ( |
||||||||||||||||||||||||||
| U.S. state, municipal and political subdivisions | ( |
( |
( |
||||||||||||||||||||||||||||||||
| Foreign governments | ( |
( |
( |
||||||||||||||||||||||||||||||||
| Corporate | ( |
( |
( |
||||||||||||||||||||||||||||||||
| CLO | ( |
( |
( |
||||||||||||||||||||||||||||||||
| ABS | ( |
( |
( |
||||||||||||||||||||||||||||||||
| CMBS | ( |
( |
( |
||||||||||||||||||||||||||||||||
| RMBS | ( |
( |
( |
||||||||||||||||||||||||||||||||
| Total AFS securities | ( |
( |
( |
||||||||||||||||||||||||||||||||
| AFS securities – related parties | |||||||||||||||||||||||||||||||||||
| Corporate | ( |
( |
( |
||||||||||||||||||||||||||||||||
| CLO | ( |
( |
( |
||||||||||||||||||||||||||||||||
| ABS | ( |
( |
( |
||||||||||||||||||||||||||||||||
| Total AFS securities – related parties | ( |
( |
( |
||||||||||||||||||||||||||||||||
| Total AFS securities, including related parties | $ | $ | ( |
$ | $ | ( |
$ | $ | ( |
||||||||||||||||||||||||||
| December 31, 2024 | |||||||||||||||||||||||||||||||||||
| Less than 12 months | 12 months or more | Total | |||||||||||||||||||||||||||||||||
| (In millions) | Fair Value | Gross Unrealized Losses | Fair Value | Gross Unrealized Losses | Fair Value | Gross Unrealized Losses | |||||||||||||||||||||||||||||
| AFS securities | |||||||||||||||||||||||||||||||||||
| U.S. government and agencies | $ | $ | ( |
$ | $ | ( |
$ | $ | ( |
||||||||||||||||||||||||||
| U.S. state, municipal and political subdivisions | ( |
( |
( |
||||||||||||||||||||||||||||||||
| Foreign governments | ( |
( |
( |
||||||||||||||||||||||||||||||||
| Corporate | ( |
( |
( |
||||||||||||||||||||||||||||||||
| CLO | ( |
( |
( |
||||||||||||||||||||||||||||||||
| ABS | ( |
( |
( |
||||||||||||||||||||||||||||||||
| CMBS | ( |
( |
( |
||||||||||||||||||||||||||||||||
| RMBS | ( |
( |
( |
||||||||||||||||||||||||||||||||
| Total AFS securities | ( |
( |
( |
||||||||||||||||||||||||||||||||
| AFS securities – related parties | |||||||||||||||||||||||||||||||||||
| Corporate | ( |
( |
( |
||||||||||||||||||||||||||||||||
| CLO | ( |
( |
( |
||||||||||||||||||||||||||||||||
| ABS | ( |
( |
( |
||||||||||||||||||||||||||||||||
| Total AFS securities – related parties | ( |
( |
( |
||||||||||||||||||||||||||||||||
| Total AFS securities, including related parties | $ | $ | ( |
$ | $ | ( |
$ | $ | ( |
||||||||||||||||||||||||||
25
APOLLO GLOBAL MANAGEMENT, INC.
NOTES TO CONDENSED CONSOLIDATED FINANCIAL STATEMENTS (UNAUDITED)
The following summarizes the number of AFS securities that were in an unrealized loss position, including related parties, for which an allowance for credit losses has not been recorded:
| June 30, 2025 | |||||||||||
| Unrealized Loss Position | Unrealized Loss Position 12 Months or More | ||||||||||
| AFS securities | |||||||||||
| AFS securities – related parties | |||||||||||
The unrealized losses on AFS securities can primarily be attributed to changes in market interest rates since acquisition. Athene did not recognize the unrealized losses in income, unless as required for hedge accounting, as it intends to hold these securities and it is not more likely than not it will be required to sell a security before the recovery of its amortized cost.
Allowance for Credit Losses
The following table summarizes the activity in the allowance for credit losses for AFS securities by asset type:
| Three months ended June 30, 2025 | |||||||||||||||||||||||||||||
| Additions | Reductions | ||||||||||||||||||||||||||||
| (In millions) | Beginning balance | Initial credit losses | Securities sold during the period | Additions (reductions) to previously impaired securities | Ending balance | ||||||||||||||||||||||||
| AFS securities | |||||||||||||||||||||||||||||
| Corporate | $ | $ | $ | $ | $ | ||||||||||||||||||||||||
| ABS | ( |
||||||||||||||||||||||||||||
| CMBS | |||||||||||||||||||||||||||||
| RMBS | ( |
||||||||||||||||||||||||||||
| Total AFS securities | ( |
||||||||||||||||||||||||||||
| AFS securities – related parties, ABS | |||||||||||||||||||||||||||||
| Total AFS securities, including related parties | $ | $ | $ | ( |
$ | $ | |||||||||||||||||||||||
| Three months ended June 30, 2024 | |||||||||||||||||||||||||||||
| Additions | Reductions | ||||||||||||||||||||||||||||
| (In millions) | Beginning balance | Initial credit losses | Securities sold during the period | Additions (reductions) to previously impaired securities | Ending balance | ||||||||||||||||||||||||
| AFS securities | |||||||||||||||||||||||||||||
| Corporate | $ | $ | $ | $ | $ | ||||||||||||||||||||||||
| CLO | ( |
||||||||||||||||||||||||||||
| ABS | ( |
||||||||||||||||||||||||||||
| CMBS | |||||||||||||||||||||||||||||
| RMBS | ( |
( |
|||||||||||||||||||||||||||
| Total AFS securities | ( |
||||||||||||||||||||||||||||
| AFS securities – related parties, ABS | |||||||||||||||||||||||||||||
| Total AFS securities, including related parties | $ | $ | $ | ( |
$ | $ | |||||||||||||||||||||||
26
APOLLO GLOBAL MANAGEMENT, INC.
NOTES TO CONDENSED CONSOLIDATED FINANCIAL STATEMENTS (UNAUDITED)
| Six months ended June 30, 2025 | |||||||||||||||||||||||||||||
| Additions | Reductions | ||||||||||||||||||||||||||||
| (In millions) | Beginning balance | Initial credit losses | Securities sold during the period | Additions (reductions) to previously impaired securities | Ending balance | ||||||||||||||||||||||||
| AFS securities | |||||||||||||||||||||||||||||
| Corporate | $ | $ | $ | $ | ( |
$ | |||||||||||||||||||||||
| ABS | ( |
||||||||||||||||||||||||||||
| CMBS | |||||||||||||||||||||||||||||
| RMBS | ( |
||||||||||||||||||||||||||||
| Total AFS securities | ( |
||||||||||||||||||||||||||||
| AFS securities – related parties, ABS | |||||||||||||||||||||||||||||
| Total AFS securities, including related parties | $ | $ | $ | ( |
$ | $ | |||||||||||||||||||||||
| Six months ended June 30, 2024 | |||||||||||||||||||||||||||||
| Additions | Reductions | ||||||||||||||||||||||||||||
| (In millions) | Beginning balance | Initial credit losses | Securities sold during the period | Additions (reductions) to previously impaired securities | Ending balance | ||||||||||||||||||||||||
| AFS securities | |||||||||||||||||||||||||||||
| Corporate | $ | $ | $ | ( |
$ | ( |
$ | ||||||||||||||||||||||
| CLO | ( |
||||||||||||||||||||||||||||
| ABS | ( |
||||||||||||||||||||||||||||
| CMBS | |||||||||||||||||||||||||||||
| RMBS | ( |
||||||||||||||||||||||||||||
| Total AFS securities | ( |
||||||||||||||||||||||||||||
| AFS securities – related parties, ABS | |||||||||||||||||||||||||||||
| Total AFS securities, including related parties | $ | $ | $ | ( |
$ | $ | |||||||||||||||||||||||
Net Investment Income
Net investment income by asset class consists of the following:
| Three months ended June 30, | Six months ended June 30, | ||||||||||||||||||||||
| (In millions) | 2025 | 2024 | 2025 | 2024 | |||||||||||||||||||
| AFS securities | $ | $ | $ | $ | |||||||||||||||||||
| Trading securities | |||||||||||||||||||||||
| Equity securities | |||||||||||||||||||||||
| Mortgage loans | |||||||||||||||||||||||
| Investment funds | ( |
( |
|||||||||||||||||||||
| Funds withheld at interest | |||||||||||||||||||||||
| Other | |||||||||||||||||||||||
| Investment revenue | |||||||||||||||||||||||
| Investment expenses | ( |
( |
( |
( |
|||||||||||||||||||
| Net investment income | $ | $ | $ | $ | |||||||||||||||||||
27
APOLLO GLOBAL MANAGEMENT, INC.
NOTES TO CONDENSED CONSOLIDATED FINANCIAL STATEMENTS (UNAUDITED)
Investment Related Gains (Losses)
Investment related gains (losses) by asset class consists of the following:
| Three months ended June 30, | Six months ended June 30, | ||||||||||||||||||||||
| (In millions) | 2025 | 2024 | 2025 | 2024 | |||||||||||||||||||
AFS securities1
|
|||||||||||||||||||||||
| Gross realized gains on investment activity | $ | $ | $ | $ | |||||||||||||||||||
| Gross realized losses on investment activity | ( |
( |
( |
( |
|||||||||||||||||||
| Net realized investment gains (losses) on AFS securities | ( |
( |
|||||||||||||||||||||
| Net recognized investment gains (losses) on trading securities | ( |
( |
|||||||||||||||||||||
| Net recognized investment gains (losses) on equity securities | ( |
||||||||||||||||||||||
| Net recognized investment gains (losses) on mortgage loans | ( |
||||||||||||||||||||||
| ( |
( |
( |
|||||||||||||||||||||
| Provision for credit losses | ( |
( |
( |
( |
|||||||||||||||||||
| Other gains (losses) | ( |
( |
|||||||||||||||||||||
| Investment related gains (losses) | $ | ( |
$ | ( |
$ | ( |
$ | ||||||||||||||||
1 Includes the effects of recognized gains or losses on AFS securities associated with designated hedges.
|
|||||||||||||||||||||||
Proceeds from sales of AFS securities were $5,865 million and $7,048 million for the three months ended June 30, 2025 and 2024, respectively, and $14,810 million and $10,766 million for the six months ended June 30, 2025 and 2024, respectively.
The following table summarizes the change in unrealized gains (losses) on trading and equity securities held as of the respective period end:
| Three months ended June 30, | Six months ended June 30, | ||||||||||||||||||||||
| (In millions) | 2025 | 2024 | 2025 | 2024 | |||||||||||||||||||
| Trading securities | $ | $ | ( |
$ | $ | ( |
|||||||||||||||||
| Equity securities | ( |
||||||||||||||||||||||
Repurchase Agreements
The following table summarizes the remaining contractual maturities of repurchase agreements, which are included in payables for collateral on derivatives and securities to repurchase on the condensed consolidated statements of financial condition:
| (In millions) | June 30, 2025 | December 31, 2024 | |||||||||
| Less than 30 days | $ | $ | |||||||||
| 30 – 90 days | |||||||||||
| 91 days to 1 year | |||||||||||
| Greater than 1 year | |||||||||||
Payables for repurchase agreements |
$ | $ | |||||||||
28
APOLLO GLOBAL MANAGEMENT, INC.
NOTES TO CONDENSED CONSOLIDATED FINANCIAL STATEMENTS (UNAUDITED)
The following table summarizes the securities pledged as collateral for repurchase agreements:
| June 30, 2025 | December 31, 2024 | ||||||||||||||||||||||
| (In millions) | Amortized Cost | Fair Value | Amortized Cost | Fair Value | |||||||||||||||||||
| AFS securities | |||||||||||||||||||||||
| U.S. government and agencies | $ | $ | $ | $ | |||||||||||||||||||
| Foreign governments | |||||||||||||||||||||||
| Corporate | |||||||||||||||||||||||
| CLO | |||||||||||||||||||||||
| ABS | |||||||||||||||||||||||
| RMBS | |||||||||||||||||||||||
| Total securities pledged under repurchase agreements | $ | $ | $ | $ | |||||||||||||||||||
Reverse Repurchase Agreements
As of June 30, 2025 and December 31, 2024, amounts loaned under reverse repurchase agreements were $189 million and $935 million, respectively, and the fair value of the collateral, comprised primarily of asset-backed securities, was $1,034 million and $2,208 million, respectively.
Mortgage Loans, including related parties and consolidated VIEs
Mortgage loans include both commercial and residential loans. Athene has elected the fair value option on its mortgage loan portfolio. See note 6 for further fair value option information. The following represents the mortgage loan portfolio, with fair value option loans presented at unpaid principal balance:
| (In millions) | June 30, 2025 | December 31, 2024 | |||||||||
| Commercial mortgage loans | $ | $ | |||||||||
| Commercial mortgage loans under development | |||||||||||
| Total commercial mortgage loans | |||||||||||
| Mark to fair value | ( |
( |
|||||||||
| Commercial mortgage loans | |||||||||||
| Residential mortgage loans | |||||||||||
| Mark to fair value | ( |
||||||||||
| Residential mortgage loans | |||||||||||
| Mortgage loans | $ | $ | |||||||||
Athene invests in commercial mortgage loans, primarily on income-producing properties including office and retail buildings, apartments, hotels, and industrial properties. Athene diversifies the commercial mortgage loan portfolio by geographic region and property type to reduce concentration risk. Athene evaluates mortgage loans based on relevant current information to confirm whether properties are performing at a consistent and acceptable level to secure the related debt.
29
APOLLO GLOBAL MANAGEMENT, INC.
NOTES TO CONDENSED CONSOLIDATED FINANCIAL STATEMENTS (UNAUDITED)
The distribution of commercial mortgage loans, including those under development, by property type and geographic region is as follows:
| June 30, 2025 | December 31, 2024 | ||||||||||||||||||||||
| (In millions, except percentages) | Fair Value | Percentage of Total | Fair Value | Percentage of Total | |||||||||||||||||||
| Property type | |||||||||||||||||||||||
| Apartment | $ | % | $ | % | |||||||||||||||||||
| Industrial | % | % | |||||||||||||||||||||
| Office building | % | % | |||||||||||||||||||||
| Hotels | % | % | |||||||||||||||||||||
| Retail | % | % | |||||||||||||||||||||
| Other commercial | % | % | |||||||||||||||||||||
| Total commercial mortgage loans | $ | % | $ | % | |||||||||||||||||||
| U.S. region | |||||||||||||||||||||||
| East North Central | $ | % | $ | % | |||||||||||||||||||
| East South Central | % | % | |||||||||||||||||||||
| Middle Atlantic | % | % | |||||||||||||||||||||
| Mountain | % | % | |||||||||||||||||||||
| New England | % | % | |||||||||||||||||||||
| Pacific | % | % | |||||||||||||||||||||
| South Atlantic | % | % | |||||||||||||||||||||
| West North Central | % | % | |||||||||||||||||||||
| West South Central | % | % | |||||||||||||||||||||
| Total U.S. region | % | % | |||||||||||||||||||||
| International region | |||||||||||||||||||||||
| United Kingdom | % | % | |||||||||||||||||||||
Other international1
|
% | % | |||||||||||||||||||||
| Total international region | % | % | |||||||||||||||||||||
| Total commercial mortgage loans | $ | % | $ | % | |||||||||||||||||||
1 Represents all other countries, with each individual country comprising less than 5% of the portfolio.
| |||||||||||||||||||||||
Athene’s residential mortgage loan portfolio primarily consists of first lien residential mortgage loans collateralized by properties in various geographic locations and is summarized by proportion of the portfolio in the following table:
| June 30, 2025 | December 31, 2024 | ||||||||||
| U.S. States | |||||||||||
| California | % | % | |||||||||
| Florida | % | % | |||||||||
| Texas | % | % | |||||||||
Other1
|
% | % | |||||||||
| Total U.S. residential mortgage loan percentage | % | % | |||||||||
International1
|
% | % | |||||||||
| Total residential mortgage loan percentage | % | % | |||||||||
1 Represents all other states or countries, with each individual state or country comprising less than 5% of the portfolio.
| |||||||||||
30
APOLLO GLOBAL MANAGEMENT, INC.
NOTES TO CONDENSED CONSOLIDATED FINANCIAL STATEMENTS (UNAUDITED)
Investment Funds
Athene’s investment fund portfolio strategy primarily focuses on core holdings of origination and retirement services platforms, equity and credit, and other funds. Origination platforms include investments sourced by affiliated platforms that originate loans to third parties and in which Athene gains exposure directly to the loan or indirectly through its ownership of the origination platform and/or securitizations of assets originated by the origination platform. Retirement services platforms include investments in equity of financial services companies. The credit strategy is comprised of direct origination, asset-backed, multi-credit and opportunistic credit funds focused on generating excess returns through high-quality credit underwriting and origination. The equity strategy is comprised of private equity, hybrid value, secondaries equity, real estate equity, impact investing, infrastructure and clean transition equity funds that raise capital from investors to pursue control-oriented investments across the universe of private assets. Investment funds can meet the definition of VIEs. The investment funds do not specify timing of distributions on the funds’ underlying assets.
The following summarizes Athene’s investment funds, including related parties and consolidated VIEs:
| June 30, 2025 | December 31, 2024 | ||||||||||||||||||||||
| (In millions, except percentages) | Carrying Value | Percentage of Total | Carrying Value | Percentage of Total | |||||||||||||||||||
| Investment funds | |||||||||||||||||||||||
| Equity | $ | % | $ | % | |||||||||||||||||||
| Investment funds – related parties | |||||||||||||||||||||||
| Origination platforms | % | % | |||||||||||||||||||||
| Retirement services platforms | % | % | |||||||||||||||||||||
| Equity | % | % | |||||||||||||||||||||
| Credit | % | % | |||||||||||||||||||||
| Other | % | % | |||||||||||||||||||||
| Total investment funds – related parties | % | % | |||||||||||||||||||||
| Investment funds – consolidated VIEs | |||||||||||||||||||||||
| Origination platforms | % | % | |||||||||||||||||||||
| Equity | % | % | |||||||||||||||||||||
| Credit | % | % | |||||||||||||||||||||
| Other | % | % | |||||||||||||||||||||
| Total investment funds – consolidated VIEs | % | % | |||||||||||||||||||||
| Total investment funds, including related parties and consolidated VIEs | $ | % | $ | % | |||||||||||||||||||
Concentrations—The following table represents Athene’s investment concentrations in excess of 10% of stockholders’ equity:
| (In millions) | June 30, 2025 | ||||
AP Grange Holdings, LLC1
|
$ | ||||
Atlas Securitized Products Holdings LP2
|
|||||
Fox Hedge L.P.1
|
|||||
Investment-grade debt issued by Blackstone Private Credit Fund3
|
|||||
| December 31, 2024 | |||||
AP Grange Holdings, LLC1
|
$ | ||||
Atlas Securitized Products Holdings LP2
|
|||||
Fox Hedge L.P.1
|
|||||
1 Investment-grade ABS.
| |||||
2 See note 15 for additional details on Atlas. Amounts are representative of single issuer risk and may only include a portion of the total investments associated with a related party.
| |||||
3 Senior unsecured investment-grade debt issued by a non-exchange traded business development company.
| |||||
31
APOLLO GLOBAL MANAGEMENT, INC.
NOTES TO CONDENSED CONSOLIDATED FINANCIAL STATEMENTS (UNAUDITED)
4. Derivatives
Athene uses a variety of derivative instruments to manage risks, primarily equity, interest rate, foreign currency and market volatility. See note 6 for information about the fair value hierarchy for derivatives.
The following table presents the notional amount and fair value of derivative instruments:
| June 30, 2025 | December 31, 2024 | ||||||||||||||||||||||||||||||||||
| Notional Amount | Fair Value | Notional Amount | Fair Value | ||||||||||||||||||||||||||||||||
| (In millions) | Assets | Liabilities | Assets | Liabilities | |||||||||||||||||||||||||||||||
| Derivatives designated as hedges | |||||||||||||||||||||||||||||||||||
| Foreign currency hedges | |||||||||||||||||||||||||||||||||||
| Swaps | $ | $ | $ | $ | |||||||||||||||||||||||||||||||
| Forwards | |||||||||||||||||||||||||||||||||||
| Interest rate swaps | |||||||||||||||||||||||||||||||||||
| Forwards on net investments | |||||||||||||||||||||||||||||||||||
| Interest rate swaps | |||||||||||||||||||||||||||||||||||
| Total derivatives designated as hedges | |||||||||||||||||||||||||||||||||||
| Derivatives not designated as hedges | |||||||||||||||||||||||||||||||||||
| Equity options | |||||||||||||||||||||||||||||||||||
| Futures | |||||||||||||||||||||||||||||||||||
| Foreign currency swaps | |||||||||||||||||||||||||||||||||||
| Interest rate swaps and forwards | |||||||||||||||||||||||||||||||||||
| Other swaps | |||||||||||||||||||||||||||||||||||
| Foreign currency forwards | |||||||||||||||||||||||||||||||||||
| Embedded derivatives | |||||||||||||||||||||||||||||||||||
| Funds withheld, including related parties | ( |
( |
|||||||||||||||||||||||||||||||||
| Interest sensitive contract liabilities | |||||||||||||||||||||||||||||||||||
| Total derivatives not designated as hedges | |||||||||||||||||||||||||||||||||||
| $ | $ | $ | $ | ||||||||||||||||||||||||||||||||
Derivatives Designated as Hedges
Cash Flow Hedges
Athene uses interest rate swaps to convert floating-rate interest payments to fixed-rate interest payments to reduce exposure to interest rate changes. The interest rate swaps will expire by May 2035. During the three months ended June 30, 2025 and 2024, Athene recognized gains of $76 million and $18 million, respectively, in OCI associated with these hedges. During the six months ended June 30, 2025 and 2024, Athene recognized gains of $172 million and losses of $3 million, respectively, in OCI associated with these hedges. There were no amounts deemed ineffective during the three and six months ended June 30, 2025 and 2024. As of June 30, 2025, no amounts were expected to be reclassified to income within the next 12 months.
Fair Value Hedges – Athene uses foreign currency forward contracts, foreign currency swaps, foreign currency interest rate swaps and interest rate swaps that are designated and accounted for as fair value hedges to hedge certain exposures to foreign currency risk and interest rate risk. The foreign currency forward price is agreed upon at the time of the contract and payment is made at a specified future date. The amortized cost of AFS debt securities in qualifying fair value hedges of foreign currency risk was $17,818 million and $16,307 million as of June 30, 2025 and December 31, 2024, respectively. The carrying value of interest sensitive contract liabilities in qualifying fair value hedges of foreign currency swaps was $6,012 million and $2,426 million as of June 30, 2025 and December 31, 2024, respectively.
The following represents the carrying amount and the cumulative fair value of hedging adjustments of hedged liabilities, excluding those solely hedging foreign currency risk:
32
APOLLO GLOBAL MANAGEMENT, INC.
NOTES TO CONDENSED CONSOLIDATED FINANCIAL STATEMENTS (UNAUDITED)
| June 30, 2025 | December 31, 2024 | ||||||||||||||||||||||
| (In millions) | Carrying amount of the hedged liabilities |
Cumulative amount of fair value hedging gains (losses)1
|
Carrying amount of the hedged liabilities | Cumulative amount of fair value hedging gains (losses) | |||||||||||||||||||
| Interest sensitive contract liabilities | |||||||||||||||||||||||
| Foreign currency interest rate swaps | $ | $ | $ | $ | |||||||||||||||||||
| Interest rate swaps | ( |
||||||||||||||||||||||
1 Excludes gains (losses) related to foreign currency risk.
| |||||||||||||||||||||||
The following is a summary of the gains (losses) related to the derivatives and related hedged items in fair value hedge relationships:
| Amounts excluded | |||||||||||||||||||||||||||||
| (In millions) | Derivatives | Hedged items | Net | Recognized in income through amortization approach | Recognized in income through changes in fair value | ||||||||||||||||||||||||
| Three months ended June 30, 2025 | |||||||||||||||||||||||||||||
| Investment related gains (losses) | |||||||||||||||||||||||||||||
| Foreign currency forwards | $ | ( |
$ | $ | ( |
$ | $ | ||||||||||||||||||||||
| Foreign currency swaps | ( |
||||||||||||||||||||||||||||
| Foreign currency interest rate swaps | ( |
||||||||||||||||||||||||||||
| Interest rate swaps | ( |
||||||||||||||||||||||||||||
| Interest sensitive contract benefits | |||||||||||||||||||||||||||||
| Foreign currency interest rate swaps | ( |
||||||||||||||||||||||||||||
| Three months ended June 30, 2024 | |||||||||||||||||||||||||||||
| Investment related gains (losses) | |||||||||||||||||||||||||||||
| Foreign currency forwards | $ | $ | ( |
$ | ( |
$ | $ | ( |
|||||||||||||||||||||
| Foreign currency swaps | ( |
||||||||||||||||||||||||||||
| Foreign currency interest rate swaps | ( |
( |
|||||||||||||||||||||||||||
| Interest rate swaps | ( |
( |
|||||||||||||||||||||||||||
| Interest sensitive contract benefits | |||||||||||||||||||||||||||||
| Foreign currency interest rate swaps | ( |
||||||||||||||||||||||||||||
| Amounts excluded | |||||||||||||||||||||||||||||
| (In millions) | Derivatives | Hedged items | Net | Recognized in income through amortization approach | Recognized in income through changes in fair value | ||||||||||||||||||||||||
| Six months ended June 30, 2025 | |||||||||||||||||||||||||||||
| Investment related gains (losses) | |||||||||||||||||||||||||||||
| Foreign currency forwards | $ | ( |
$ | $ | ( |
$ | $ | ||||||||||||||||||||||
| Foreign currency swaps | ( |
||||||||||||||||||||||||||||
| Foreign currency interest rate swaps | ( |
||||||||||||||||||||||||||||
| Interest rate swaps | ( |
||||||||||||||||||||||||||||
| Interest sensitive contract benefits | |||||||||||||||||||||||||||||
| Foreign currency interest rate swaps | ( |
||||||||||||||||||||||||||||
| Six months ended June 30, 2024 | |||||||||||||||||||||||||||||
| Investment related gains (losses) | |||||||||||||||||||||||||||||
| Foreign currency forwards | ( |
( |
|||||||||||||||||||||||||||
| Foreign currency swaps | ( |
||||||||||||||||||||||||||||
| Foreign currency interest rate swaps | ( |
||||||||||||||||||||||||||||
| Interest rate swaps | ( |
( |
|||||||||||||||||||||||||||
| Interest sensitive contract benefits | |||||||||||||||||||||||||||||
| Foreign currency interest rate swaps | ( |
||||||||||||||||||||||||||||
33
APOLLO GLOBAL MANAGEMENT, INC.
NOTES TO CONDENSED CONSOLIDATED FINANCIAL STATEMENTS (UNAUDITED)
The following is a summary of the gains (losses) excluded from the assessment of hedge effectiveness that were recognized in OCI:
| Three months ended June 30, | Six months ended June 30, | ||||||||||||||||||||||
| (In millions) | 2025 | 2024 | 2025 | 2024 | |||||||||||||||||||
| Foreign currency forwards | $ | $ | $ | $ | ( |
||||||||||||||||||
| Foreign currency swaps | ( |
||||||||||||||||||||||
Net Investment Hedges
Athene uses foreign currency forwards to hedge the foreign currency exchange rate risk of its investments in subsidiaries that have a reporting currency other than the U.S. dollar. Hedge effectiveness is assessed based on the changes in forward rates. During the three months ended June 30, 2025 and 2024, these derivatives had losses of $14 million and $0 million, respectively. During the six months ended June 30, 2025 and 2024, these derivatives had losses of $22 million and gains of $3 million, respectively. These derivatives are included in foreign currency translation and other adjustments on the condensed consolidated statements of comprehensive income (loss). As of June 30, 2025 and December 31, 2024, the cumulative foreign currency translations recorded in AOCI related to these net investment hedges were gains of $7 million and $29 million, respectively. During the three and six months ended June 30, 2025 and 2024, there were no amounts deemed ineffective.
Derivatives Not Designated as Hedges
Equity options
Athene uses equity indexed options to economically hedge fixed indexed annuity products that guarantee the return of principal to the policyholder and credit interest based on a percentage of the gain in a specified market index, including the S&P 500 and other bespoke indices. To hedge against adverse changes in equity indices, Athene enters into contracts to buy equity indexed options. The contracts are net settled in cash based on differentials in the indices at the time of exercise and the strike price.
Futures
Athene purchases futures contracts to hedge the growth in interest credited to the customer as a direct result of increases in the related indices. Athene enters into exchange-traded futures with regulated futures commission clearing brokers who are members of a trading exchange. Under exchange-traded futures contracts, Athene agrees to purchase a specified number of contracts with other parties and to post variation margin on a daily basis in an amount equal to the difference in the daily fair values of those contracts.
Interest rate swaps and forwards
Athene uses interest rate swaps and forwards to reduce market risks from interest rate changes and to alter interest rate exposure arising from duration mismatches between assets and liabilities. With an interest rate swap, Athene agrees with another party to exchange the difference between fixed-rate and floating-rate interest amounts tied to an agreed-upon notional principal amount at specified intervals.
Other swaps
Other swaps include total return swaps, credit default swaps and swaptions. Athene purchases total rate of return swaps to gain exposure and benefit from a reference asset or index without ownership. Credit default swaps provide a measure of protection against the default of an issuer or allow Athene to gain credit exposure to an issuer or traded index. Athene uses credit default swaps coupled with a bond to synthetically create the characteristics of a reference bond. Swaptions provide an option to enter into an interest rate swap and are used by Athene to hedge against interest rate exposure.
Embedded derivatives
Athene has embedded derivatives which are required to be separated from their host contracts and reported as derivatives. Host contracts include reinsurance agreements structured on a modco or funds withheld basis and indexed annuity products.
34
APOLLO GLOBAL MANAGEMENT, INC.
NOTES TO CONDENSED CONSOLIDATED FINANCIAL STATEMENTS (UNAUDITED)
The following is a summary of the gains (losses) related to derivatives not designated as hedges:
| Three months ended June 30, | Six months ended June 30, | ||||||||||||||||||||||
| (In millions) | 2025 | 2024 | 2025 | 2024 | |||||||||||||||||||
| Equity options | $ | $ | $ | ( |
$ | ||||||||||||||||||
| Futures | ( |
( |
( |
||||||||||||||||||||
| Interest rate swaps and forwards and other swaps | ( |
( |
( |
( |
|||||||||||||||||||
| Foreign currency forwards | ( |
( |
( |
( |
|||||||||||||||||||
| Embedded derivatives on funds withheld | ( |
( |
|||||||||||||||||||||
| Amounts recognized in investment related gains (losses) | ( |
( |
( |
||||||||||||||||||||
Embedded derivatives in indexed annuity products1
|
( |
( |
|||||||||||||||||||||
| Total gains (losses) on derivatives not designated as hedges | $ | ( |
$ | ( |
$ | ( |
$ | ( |
|||||||||||||||
1 Included in interest sensitive contract benefits on the condensed consolidated statements of operations.
|
|||||||||||||||||||||||
Credit Risk
Athene may be exposed to credit-related losses in the event of counterparty nonperformance on derivative financial instruments. Generally, the current credit exposure of Athene’s derivative contracts is the fair value at the reporting date less any collateral received from the counterparty.
Athene manages credit risk related to over-the-counter derivatives by entering into transactions with creditworthy counterparties. Where possible, Athene maintains collateral arrangements and uses master netting agreements that provide for a single net payment from one counterparty to another at each due date and upon termination. Athene has also established counterparty exposure limits, where possible, in order to evaluate if there is sufficient collateral to support the net exposure.
Collateral arrangements typically require the posting of collateral in connection with its derivative instruments. Collateral agreements often contain posting thresholds, some of which may vary depending on the posting party’s financial strength ratings. Additionally, a decrease in Athene’s financial strength rating to a specified level can result in settlement of the derivative position.
The estimated fair value of Athene’s net derivative and other financial assets and liabilities after the application of master netting agreements and collateral were as follows:
Gross amounts not offset on the condensed consolidated statements of financial condition |
|||||||||||||||||||||||||||||||||||
| (In millions) |
Gross amount recognized1
|
Financial instruments2
|
Collateral (received)/pledged | Net amount |
Off-balance sheet securities collateral3
|
Net amount after securities collateral | |||||||||||||||||||||||||||||
| June 30, 2025 | |||||||||||||||||||||||||||||||||||
| Derivative assets | $ | $ | ( |
$ | ( |
$ | $ | ( |
$ | ||||||||||||||||||||||||||
| Derivative liabilities | ( |
( |
( |
||||||||||||||||||||||||||||||||
| December 31, 2024 | |||||||||||||||||||||||||||||||||||
| Derivative assets | $ | $ | ( |
$ | ( |
$ | $ | $ | |||||||||||||||||||||||||||
| Derivative liabilities | ( |
( |
( |
||||||||||||||||||||||||||||||||
1 The gross amounts of recognized derivative assets and derivative liabilities are reported on the condensed consolidated statements of financial condition. As of June 30, 2025 and December 31, 2024, amounts not subject to master netting or similar agreements were immaterial.
| |||||||||||||||||||||||||||||||||||
2 Represents amounts offsetting derivative assets and derivative liabilities that are subject to an enforceable master netting agreement or similar agreement that are not netted against the gross derivative assets or gross derivative liabilities for presentation on the condensed consolidated statements of financial condition.
| |||||||||||||||||||||||||||||||||||
3 For non-cash collateral received, Athene does not recognize the collateral on the condensed consolidated statements of financial condition unless the obligor (transferor) has defaulted under the terms of the secured contract and is no longer entitled to redeem the pledged asset. Amounts do not include any excess of collateral pledged or received.
| |||||||||||||||||||||||||||||||||||
35
APOLLO GLOBAL MANAGEMENT, INC.
NOTES TO CONDENSED CONSOLIDATED FINANCIAL STATEMENTS (UNAUDITED)
5. Variable Interest Entities
A variable interest in a VIE is an investment or other interest that will absorb portions of the VIE’s expected losses and/or receive expected residual returns. Variable interests in consolidated VIEs and unconsolidated VIEs are discussed separately below.
Consolidated VIEs
Consolidated VIEs include certain CLOs and funds managed by the Company and other entities where the Company is deemed the primary beneficiary.
The assets of consolidated VIEs are not available to creditors of the Company, and the investors in these consolidated VIEs have no recourse against the assets of the Company. Similarly, there is no recourse to the Company for the consolidated VIEs’ liabilities.
Other assets of the consolidated VIEs include short-term receivables due from investments sold, performance fee allocations, interest receivables and due from related parties. Other liabilities include debt and short-term payables.
Results from certain funds managed by Apollo are reported on a three-month lag based upon the availability of financial information.
Net Gains (Losses) from Investment Activities of Consolidated Variable Interest Entities—Asset Management
The following table presents net gains (losses) from investment activities of the consolidated VIEs:
| Three months ended June 30, | Six months ended June 30, | ||||||||||||||||||||||
| (In millions) |
20251
|
20241
|
20251
|
20241
|
|||||||||||||||||||
| Net gains (losses) from investment activities | $ | $ | ( |
$ | $ | ( |
|||||||||||||||||
| Interest and other income | |||||||||||||||||||||||
| Interest and other expenses | ( |
( |
( |
( |
|||||||||||||||||||
| Net gains (losses) from investment activities of consolidated variable interest entities | $ | $ | $ | $ | |||||||||||||||||||
1 Amounts reflect consolidation eliminations.
|
|||||||||||||||||||||||
In addition, we recognize revenues and expenses of certain consolidated VIEs within management fees, investment income (loss), compensation and benefits and general, administrative and other. For the three and six months ended June 30, 2025, the Company recorded $53 million and $85 million, respectively, of revenues, $7 million and $11 million, respectively, of expenses and $4 million and $18 million, respectively, of other losses related to the activities of these VIEs. For the three and six months ended June 30, 2024, the Company recorded $8 million and $18 million, respectively, of revenues and $0 million and $2 million, respectively, of expenses related to the activities of these VIEs.
36
APOLLO GLOBAL MANAGEMENT, INC.
NOTES TO CONDENSED CONSOLIDATED FINANCIAL STATEMENTS (UNAUDITED)
Subscription Lines
Included within other liabilities are amounts due to third-party institutions by the consolidated VIEs. The following table summarizes the principal provisions of those amounts:
| June 30, 2025 | December 31, 2024 | ||||||||||||||||||||||||||||||||||
| (In millions, except percentages) | Principal Outstanding | Weighted Average Interest Rate | Weighted Average Remaining Maturity in Years | Principal Outstanding | Weighted Average Interest Rate | Weighted Average Remaining Maturity in Years | |||||||||||||||||||||||||||||
| Asset Management | |||||||||||||||||||||||||||||||||||
Subscription lines1
|
$ | % | $ | % | |||||||||||||||||||||||||||||||
Total – Asset Management |
$ | $ | |||||||||||||||||||||||||||||||||
1 The subscription lines of the consolidated VIEs are collateralized by assets held by each respective vehicle and assets of one vehicle may not be used to satisfy the liabilities of another vehicle.
| |||||||||||||||||||||||||||||||||||
The consolidated VIEs’ debt obligations contain various customary loan covenants. As of June 30, 2025, the Company was not aware of any instances of non-compliance with any of these covenants.
Revenues of Consolidated Variable Interest Entities—Retirement Services
The following summarizes the statements of operations activity of the consolidated VIEs:
| Three months ended June 30, | Six months ended June 30, | ||||||||||||||||||||||
| (In millions) | 2025 | 2024 | 2025 | 2024 | |||||||||||||||||||
| Trading securities | $ | $ | $ | $ | |||||||||||||||||||
| Mortgage loans | |||||||||||||||||||||||
| Investment funds | |||||||||||||||||||||||
| Other | ( |
( |
( |
||||||||||||||||||||
| Net investment income | |||||||||||||||||||||||
Net recognized investment gains (losses) on trading securities |
( |
( |
|||||||||||||||||||||
Net recognized investment gains (losses) on mortgage loans |
( |
( |
( |
||||||||||||||||||||
Net recognized investment gains on investment funds |
|||||||||||||||||||||||
Other gains (losses) |
( |
( |
|||||||||||||||||||||
| Investment related gains (losses) | |||||||||||||||||||||||
| Revenues of consolidated variable interest entities | $ | $ | $ | $ | |||||||||||||||||||
Unconsolidated Variable Interest Entities—Asset Management
The following table presents the maximum exposure to losses relating to these VIEs for which Apollo has concluded that it holds a significant variable interest, but that it is not the primary beneficiary.
| (In millions) | June 30, 2025 | December 31, 2024 | |||||||||
Maximum Loss Exposure1,2
|
$ | $ | |||||||||
1 Represents Apollo’s direct investment in those entities in which it holds a significant variable interest and certain other investments. Additionally, cumulative performance allocations are subject to reversal in the event of future losses.
|
|||||||||||
2 Some amounts included are a quarter in arrears.
|
|||||||||||
37
APOLLO GLOBAL MANAGEMENT, INC.
NOTES TO CONDENSED CONSOLIDATED FINANCIAL STATEMENTS (UNAUDITED)
Unconsolidated Variable Interest Entities—Retirement Services
Athene has variable interests in certain unconsolidated VIEs in the form of securities and ownership stakes in investment funds.
Fixed maturity securities
Athene invests in securitization entities as a debt holder or an investor in the residual interest of the securitization vehicle. These entities are deemed VIEs due to insufficient equity within the structure and lack of control by the equity investors over the activities that significantly impact the economics of the entity. In general, Athene is a debt investor within these entities and, as such, holds a variable interest; however, due to the debt holders’ lack of ability to control the decisions within the structure that significantly impact the entity, and the fact the debt holders are protected from losses due to the subordination of the equity tranche, the debt holders are not deemed the primary beneficiary. Securitization vehicles in which Athene holds the residual tranche are not consolidated because Athene does not unilaterally have substantive rights to remove the general partner, or when assessing related party interests, Athene is not under common control, as defined by U.S. GAAP, with the related parties, nor are substantially all of the activities conducted on Athene’s behalf; therefore, Athene is not deemed the primary beneficiary. Debt investments and investments in the residual tranche of securitization entities are considered debt instruments, and are held at fair value.
Investment funds
Investment funds include non-fixed income, alternative investments in the form of limited partnerships or similar legal structures.
Equity securities
Athene invests in preferred equity securities issued by entities deemed to be VIEs due to insufficient equity within the structure.
Athene’s risk of loss associated with its non-consolidated investments depends on the investment. Investment funds, equity securities and trading securities are limited to the carrying value plus unfunded commitments. AFS securities are limited to amortized cost plus unfunded commitments.
The following summarizes the carrying value and maximum loss exposure of these non-consolidated investments:
| June 30, 2025 | December 31, 2024 | ||||||||||||||||||||||
| (In millions) | Carrying Value | Maximum Loss Exposure | Carrying Value | Maximum Loss Exposure | |||||||||||||||||||
| Investment funds | $ | $ | $ | $ | |||||||||||||||||||
| Investment in related parties – investment funds | |||||||||||||||||||||||
| Assets of consolidated VIEs – investment funds | |||||||||||||||||||||||
| Investment in fixed maturity securities | |||||||||||||||||||||||
| Investment in related parties – fixed maturity securities | |||||||||||||||||||||||
| Investment in related parties – equity securities | |||||||||||||||||||||||
| Total non-consolidated investments | $ | $ | $ | $ | |||||||||||||||||||
38
APOLLO GLOBAL MANAGEMENT, INC.
NOTES TO CONDENSED CONSOLIDATED FINANCIAL STATEMENTS (UNAUDITED)
6. Fair Value
Fair Value Measurements of Financial Instruments
The following summarize the Company’s financial assets and liabilities recorded at fair value hierarchy level:
| June 30, 2025 | |||||||||||||||||||||||||||||
| (In millions) | Level 1 | Level 2 | Level 3 | NAV | Total | ||||||||||||||||||||||||
| Assets | |||||||||||||||||||||||||||||
Asset Management |
|||||||||||||||||||||||||||||
| Cash and cash equivalents | $ | $ | $ | $ | — | $ | |||||||||||||||||||||||
| Restricted cash and cash equivalents | — | ||||||||||||||||||||||||||||
| Cash and cash equivalents of VIEs | — | ||||||||||||||||||||||||||||
| Investments, at fair value | 1 |
||||||||||||||||||||||||||||
| Investments of consolidated VIEs | |||||||||||||||||||||||||||||
Due from related parties2
|
— | ||||||||||||||||||||||||||||
Derivative assets3
|
— | ||||||||||||||||||||||||||||
Total Assets – Asset Management |
|||||||||||||||||||||||||||||
Retirement Services |
|||||||||||||||||||||||||||||
| AFS Securities | |||||||||||||||||||||||||||||
| U.S. government and agencies | — | ||||||||||||||||||||||||||||
| U.S. state, municipal and political subdivisions | — | ||||||||||||||||||||||||||||
| Foreign governments | — | ||||||||||||||||||||||||||||
| Corporate | — | ||||||||||||||||||||||||||||
| CLO | — | ||||||||||||||||||||||||||||
| ABS | — | ||||||||||||||||||||||||||||
| CMBS | — | ||||||||||||||||||||||||||||
| RMBS | — | ||||||||||||||||||||||||||||
| Total AFS securities | — | ||||||||||||||||||||||||||||
| Trading securities | — | ||||||||||||||||||||||||||||
| Equity securities | — | ||||||||||||||||||||||||||||
| Mortgage loans | — | ||||||||||||||||||||||||||||
| Funds withheld at interest – embedded derivative | ( |
— | ( |
||||||||||||||||||||||||||
| Derivative assets | — | ||||||||||||||||||||||||||||
| Short-term investments | — | ||||||||||||||||||||||||||||
| Other investments | — | ||||||||||||||||||||||||||||
| Cash and cash equivalents | — | ||||||||||||||||||||||||||||
| Restricted cash and cash equivalents | — | ||||||||||||||||||||||||||||
| Investments in related parties | |||||||||||||||||||||||||||||
| AFS securities | |||||||||||||||||||||||||||||
| Corporate | — | ||||||||||||||||||||||||||||
| CLO | — | ||||||||||||||||||||||||||||
| ABS | — | ||||||||||||||||||||||||||||
| Total AFS securities – related parties | — | ||||||||||||||||||||||||||||
| Trading securities | — | ||||||||||||||||||||||||||||
| Equity securities | — | ||||||||||||||||||||||||||||
| Mortgage loans | — | ||||||||||||||||||||||||||||
| Investment funds | — | ||||||||||||||||||||||||||||
| Funds withheld at interest – embedded derivative | ( |
— | ( |
||||||||||||||||||||||||||
| Other investments | — | ||||||||||||||||||||||||||||
| Reinsurance recoverable | — | ||||||||||||||||||||||||||||
Other assets5
|
— | ||||||||||||||||||||||||||||
| (Continued) | |||||||||||||||||||||||||||||
39
APOLLO GLOBAL MANAGEMENT, INC.
NOTES TO CONDENSED CONSOLIDATED FINANCIAL STATEMENTS (UNAUDITED)
| June 30, 2025 | |||||||||||||||||||||||||||||
| (In millions) | Level 1 | Level 2 | Level 3 | NAV | Total | ||||||||||||||||||||||||
| Assets of consolidated VIEs | |||||||||||||||||||||||||||||
| Trading securities | — | ||||||||||||||||||||||||||||
| Mortgage loans | — | ||||||||||||||||||||||||||||
| Investment funds | |||||||||||||||||||||||||||||
| Other investments | — | ||||||||||||||||||||||||||||
| Cash and cash equivalents | — | ||||||||||||||||||||||||||||
Total Assets – Retirement Services |
|||||||||||||||||||||||||||||
| Total Assets | $ | $ | $ | $ | $ | ||||||||||||||||||||||||
| Liabilities | |||||||||||||||||||||||||||||
Asset Management |
|||||||||||||||||||||||||||||
| Other liabilities of consolidated VIEs, at fair value | $ | $ | $ | $ | $ | ||||||||||||||||||||||||
Contingent consideration obligations4
|
— | ||||||||||||||||||||||||||||
Derivative liabilities3
|
— | ||||||||||||||||||||||||||||
Total Liabilities – Asset Management |
— | ||||||||||||||||||||||||||||
Retirement Services |
|||||||||||||||||||||||||||||
| Interest sensitive contract liabilities | |||||||||||||||||||||||||||||
| Embedded derivative | — | ||||||||||||||||||||||||||||
| Universal life benefits | — | ||||||||||||||||||||||||||||
| Future policy benefits | |||||||||||||||||||||||||||||
| AmerUs Life Insurance Company (“AmerUs”) Closed Block | — | ||||||||||||||||||||||||||||
| Indianapolis Life Insurance Company (“ILICO”) Closed Block and life benefits | — | ||||||||||||||||||||||||||||
Market risk benefits5
|
— | ||||||||||||||||||||||||||||
| Derivative liabilities | — | ||||||||||||||||||||||||||||
| Other liabilities | — | ||||||||||||||||||||||||||||
Total Liabilities – Retirement Services |
— | ||||||||||||||||||||||||||||
| Total Liabilities | $ | $ | $ | $ | — | $ | |||||||||||||||||||||||
| (Concluded) | |||||||||||||||||||||||||||||
40
APOLLO GLOBAL MANAGEMENT, INC.
NOTES TO CONDENSED CONSOLIDATED FINANCIAL STATEMENTS (UNAUDITED)
| December 31, 2024 | |||||||||||||||||||||||||||||
| (In millions) | Level 1 | Level 2 | Level 3 | NAV | Total | ||||||||||||||||||||||||
| Assets | |||||||||||||||||||||||||||||
Asset Management |
|||||||||||||||||||||||||||||
| Cash and cash equivalents | $ | $ | $ | $ | — | $ | |||||||||||||||||||||||
| Restricted cash and cash equivalents | — | ||||||||||||||||||||||||||||
| Cash and cash equivalents of VIEs | — | ||||||||||||||||||||||||||||
| Investments, at fair value | 1 |
||||||||||||||||||||||||||||
| Investments of consolidated VIEs | |||||||||||||||||||||||||||||
Due from related parties2
|
— | ||||||||||||||||||||||||||||
Derivative assets3
|
— | ||||||||||||||||||||||||||||
Total Assets – Asset Management |
|||||||||||||||||||||||||||||
Retirement Services |
|||||||||||||||||||||||||||||
| AFS Securities | |||||||||||||||||||||||||||||
| U.S. government and agencies | — | ||||||||||||||||||||||||||||
| U.S. state, municipal and political subdivisions | — | ||||||||||||||||||||||||||||
| Foreign governments | — | ||||||||||||||||||||||||||||
| Corporate | — | ||||||||||||||||||||||||||||
| CLO | — | ||||||||||||||||||||||||||||
| ABS | — | ||||||||||||||||||||||||||||
| CMBS | — | ||||||||||||||||||||||||||||
| RMBS | — | ||||||||||||||||||||||||||||
| Total AFS securities | — | ||||||||||||||||||||||||||||
| Trading securities | — | ||||||||||||||||||||||||||||
| Equity securities | — | ||||||||||||||||||||||||||||
| Mortgage loans | — | ||||||||||||||||||||||||||||
| Funds withheld at interest – embedded derivative | ( |
— | ( |
||||||||||||||||||||||||||
| Derivative assets | — | ||||||||||||||||||||||||||||
| Short-term investments | — | ||||||||||||||||||||||||||||
| Other investments | — | ||||||||||||||||||||||||||||
| Cash and cash equivalents | — | ||||||||||||||||||||||||||||
| Restricted cash and cash equivalents | — | ||||||||||||||||||||||||||||
| Investments in related parties | |||||||||||||||||||||||||||||
| AFS securities | |||||||||||||||||||||||||||||
| Corporate | — | ||||||||||||||||||||||||||||
| CLO | — | ||||||||||||||||||||||||||||
| ABS | — | ||||||||||||||||||||||||||||
| Total AFS securities – related parties | — | ||||||||||||||||||||||||||||
| Trading securities | — | ||||||||||||||||||||||||||||
| Equity securities | — | ||||||||||||||||||||||||||||
| Mortgage loans | — | ||||||||||||||||||||||||||||
| Investment funds | — | ||||||||||||||||||||||||||||
| Funds withheld at interest – embedded derivative | ( |
— | ( |
||||||||||||||||||||||||||
| Other investments | — | ||||||||||||||||||||||||||||
| Reinsurance recoverable | — | ||||||||||||||||||||||||||||
Other assets5
|
— | ||||||||||||||||||||||||||||
| Assets of consolidated VIEs | |||||||||||||||||||||||||||||
| Trading securities | — | ||||||||||||||||||||||||||||
| Mortgage loans | — | ||||||||||||||||||||||||||||
| Investment funds | |||||||||||||||||||||||||||||
| (Continued) | |||||||||||||||||||||||||||||
41
APOLLO GLOBAL MANAGEMENT, INC.
NOTES TO CONDENSED CONSOLIDATED FINANCIAL STATEMENTS (UNAUDITED)
| December 31, 2024 | |||||||||||||||||||||||||||||
| (In millions) | Level 1 | Level 2 | Level 3 | NAV | Total | ||||||||||||||||||||||||
| Other investments | — | ||||||||||||||||||||||||||||
| Cash and cash equivalents | — | ||||||||||||||||||||||||||||
Total Assets – Retirement Services |
|||||||||||||||||||||||||||||
| Total Assets | $ | $ | $ | $ | $ | ||||||||||||||||||||||||
| Liabilities | |||||||||||||||||||||||||||||
Asset Management |
|||||||||||||||||||||||||||||
Contingent consideration obligations4
|
$ | $ | $ | $ | — | $ | |||||||||||||||||||||||
Total Liabilities – Asset Management |
— | ||||||||||||||||||||||||||||
Retirement Services |
|||||||||||||||||||||||||||||
| Interest sensitive contract liabilities | |||||||||||||||||||||||||||||
| Embedded derivative | — | ||||||||||||||||||||||||||||
| Universal life benefits | — | ||||||||||||||||||||||||||||
| Future policy benefits | |||||||||||||||||||||||||||||
| AmerUs Closed Block | — | ||||||||||||||||||||||||||||
| ILICO Closed Block and life benefits | — | ||||||||||||||||||||||||||||
Market risk benefits5
|
— | ||||||||||||||||||||||||||||
| Derivative liabilities | — | ||||||||||||||||||||||||||||
| Other liabilities | — | ||||||||||||||||||||||||||||
Total Liabilities – Retirement Services |
— | ||||||||||||||||||||||||||||
| Total Liabilities | $ | $ | $ | $ | — | $ | |||||||||||||||||||||||
| (Concluded) | |||||||||||||||||||||||||||||
1 Investments as of June 30, 2025 and December 31, 2024 excludes $ | |||||||||||||||||||||||||||||
2 Due from related parties represents a receivable from a fund.
| |||||||||||||||||||||||||||||
3 Derivative assets and derivative liabilities are presented as a component of Other assets and Other liabilities, respectively, in the condensed consolidated statements of financial condition.
| |||||||||||||||||||||||||||||
4 Other liabilities as of June 30, 2025 and December 31, 2024 includes profit sharing payable of $ | |||||||||||||||||||||||||||||
5 Other assets consist of market risk benefits assets. See note 8 for additional information on market risk benefits assets and liabilities valuation methodology and additional fair value disclosures.
| |||||||||||||||||||||||||||||
Changes in fair value of contingent consideration obligations in connection with the acquisition of Stone Tower are recorded in compensation and benefits expense in the condensed consolidated statements of operations. For periods prior to December 31, 2024, changes in fair value of contingent consideration obligations in connection with the acquisition of Griffin Capital were recorded in other income (loss), net, in the condensed consolidated statements of operations. Refer to note 16 for further details.
42
APOLLO GLOBAL MANAGEMENT, INC.
NOTES TO CONDENSED CONSOLIDATED FINANCIAL STATEMENTS (UNAUDITED)
Level 3 Financial Instruments
The following tables summarize the valuation techniques and quantitative inputs and assumptions used for financial assets and liabilities categorized as Level 3:
| June 30, 2025 | ||||||||||||||||||||||||||||||||
|
Fair Value
(In millions)
|
Valuation Technique | Unobservable Inputs | Ranges | Weighted Average | ||||||||||||||||||||||||||||
| Financial Assets | ||||||||||||||||||||||||||||||||
| Asset Management | ||||||||||||||||||||||||||||||||
| Investments | $ | Discounted cash flow | Discount rate | 1 |
||||||||||||||||||||||||||||
| Direct capitalization | Capitalization rate | |||||||||||||||||||||||||||||||
| Adjusted transaction value | N/A | N/A | N/A | |||||||||||||||||||||||||||||
| Due from related parties | Discounted cash flow | Discount rate | ||||||||||||||||||||||||||||||
| Derivative assets | Option model | Volatility rate | ||||||||||||||||||||||||||||||
| Investments of consolidated VIEs | ||||||||||||||||||||||||||||||||
| Bank loans | Discounted cash flow | Discount rate | 1 |
|||||||||||||||||||||||||||||
| Adjusted transaction value | N/A | N/A | N/A | |||||||||||||||||||||||||||||
| Equity securities | Discounted cash flow | Discount rate | ||||||||||||||||||||||||||||||
| Adjusted transaction value | N/A | N/A | N/A | |||||||||||||||||||||||||||||
| Option model | Volatility rate | 1 |
||||||||||||||||||||||||||||||
| Bonds | Adjusted transaction value | N/A | N/A | N/A | ||||||||||||||||||||||||||||
| Retirement Services | ||||||||||||||||||||||||||||||||
| AFS, trading and equity securities | Discounted cash flow | Discount rate | 1 |
|||||||||||||||||||||||||||||
Mortgage loans2
|
Discounted cash flow | Discount rate | 1 |
|||||||||||||||||||||||||||||
Investment funds2
|
Discounted cash flow | Discount rate | 1 |
|||||||||||||||||||||||||||||
| Recoverability | Estimated proceeds | N/A | N/A | |||||||||||||||||||||||||||||
| Financial Liabilities | ||||||||||||||||||||||||||||||||
| Asset Management | ||||||||||||||||||||||||||||||||
| Contingent consideration obligations | Discounted cash flow | Discount rate | 1 |
|||||||||||||||||||||||||||||
| Retirement Services | ||||||||||||||||||||||||||||||||
| Interest sensitive contract liabilities – fixed indexed annuities embedded derivatives | Discounted cash flow | Nonperformance risk | 3 |
|||||||||||||||||||||||||||||
| Option budget | 4 |
|||||||||||||||||||||||||||||||
| Surrender rate | 4 |
|||||||||||||||||||||||||||||||
1 Unobservable inputs were weighted based on the fair value of the investments included in the range.
|
||||||||||||||||||||||||||||||||
2 Includes those of consolidated VIEs.
|
||||||||||||||||||||||||||||||||
3 The nonperformance risk weighted average is based on the projected cash flows attributable to the embedded derivative.
|
||||||||||||||||||||||||||||||||
4 The option budget and surrender rate weighted averages are calculated based on projected account values.
|
||||||||||||||||||||||||||||||||
43
APOLLO GLOBAL MANAGEMENT, INC.
NOTES TO CONDENSED CONSOLIDATED FINANCIAL STATEMENTS (UNAUDITED)
| December 31, 2024 | ||||||||||||||||||||||||||||||||
|
Fair Value
(In millions)
|
Valuation Techniques | Unobservable Inputs | Ranges | Weighted Average | ||||||||||||||||||||||||||||
| Financial Assets | ||||||||||||||||||||||||||||||||
| Asset Management | ||||||||||||||||||||||||||||||||
| Investments | $ | Discounted cash flow | Discount rate | 1 |
||||||||||||||||||||||||||||
| Direct capitalization | Capitalization rate | |||||||||||||||||||||||||||||||
| Adjusted transaction value | N/A | N/A | N/A | |||||||||||||||||||||||||||||
| Due from related parties | Discounted cash flow | Discount rate | ||||||||||||||||||||||||||||||
| Derivative assets | Option model | Volatility rate | ||||||||||||||||||||||||||||||
| Investments of consolidated VIEs | ||||||||||||||||||||||||||||||||
| Bank loans | Discounted cash flow | Discount rate | 1 |
|||||||||||||||||||||||||||||
| Adjusted transaction value | N/A | N/A | N/A | |||||||||||||||||||||||||||||
| Equity securities | Dividend discount model | Discount rate | ||||||||||||||||||||||||||||||
| Discounted cash flow | Discount rate | 1 |
||||||||||||||||||||||||||||||
| Adjusted transaction value | N/A | N/A | N/A | |||||||||||||||||||||||||||||
| Option model | Volatility rate | 1 |
||||||||||||||||||||||||||||||
| Bonds | Discounted cash flow | Discount rate | 1 |
|||||||||||||||||||||||||||||
| Adjusted transaction value | N/A | N/A | N/A | |||||||||||||||||||||||||||||
| Retirement Services | ||||||||||||||||||||||||||||||||
| AFS, trading and equity securities | Discounted cash flow | Discount rate | 1 |
|||||||||||||||||||||||||||||
Mortgage loans2
|
Discounted cash flow | Discount rate | 1 |
|||||||||||||||||||||||||||||
Investment funds2
|
Discounted cash flow | Discount rate | 1 |
|||||||||||||||||||||||||||||
| Financial Liabilities | ||||||||||||||||||||||||||||||||
| Asset Management | ||||||||||||||||||||||||||||||||
| Contingent consideration obligations | Discounted cash flow | Discount rate | 1 |
|||||||||||||||||||||||||||||
| Retirement Services | ||||||||||||||||||||||||||||||||
| Interest sensitive contract liabilities – fixed indexed annuities embedded derivatives | Discounted cash flow | Nonperformance risk | 3 |
|||||||||||||||||||||||||||||
| Option budget | 4 |
|||||||||||||||||||||||||||||||
| Surrender rate | 4 |
|||||||||||||||||||||||||||||||
1 Unobservable inputs were weighted based on the fair value of the investments included in the range.
|
||||||||||||||||||||||||||||||||
2 Includes those of consolidated VIEs.
| ||||||||||||||||||||||||||||||||
3 The nonperformance risk weighted average is based on the projected cash flows attributable to the embedded derivative.
| ||||||||||||||||||||||||||||||||
4 The option budget and surrender rate weighted averages are calculated based on projected account values.
| ||||||||||||||||||||||||||||||||
44
APOLLO GLOBAL MANAGEMENT, INC.
NOTES TO CONDENSED CONSOLIDATED FINANCIAL STATEMENTS (UNAUDITED)
The following are reconciliations for Level 3 assets and liabilities measured at fair value on a recurring basis:
| Three months ended June 30, 2025 | |||||||||||||||||||||||||||||||||||||||||||||||
| Total realized and unrealized gains (losses) | |||||||||||||||||||||||||||||||||||||||||||||||
| (In millions) | Beginning balance | Net purchases, issuances, sales and settlements | Net transfers in (out) | Ending balance |
Total gains (losses) included in OCI1
|
||||||||||||||||||||||||||||||||||||||||||
Assets – Asset Management |
|||||||||||||||||||||||||||||||||||||||||||||||
| Investments and derivative assets | $ | $ | $ | $ | $ | $ | $ | ( |
$ | ||||||||||||||||||||||||||||||||||||||
| Investments of Consolidated VIEs | ( |
( |
|||||||||||||||||||||||||||||||||||||||||||||
Total Level 3 assets – Asset Management |
$ | $ | $ | $ | $ | ( |
$ | $ | ( |
$ | |||||||||||||||||||||||||||||||||||||
Assets – Retirement Services |
|||||||||||||||||||||||||||||||||||||||||||||||
| AFS securities | |||||||||||||||||||||||||||||||||||||||||||||||
| Foreign governments | $ | $ | $ | $ | ( |
$ | $ | $ | $ | ||||||||||||||||||||||||||||||||||||||
| Corporate | |||||||||||||||||||||||||||||||||||||||||||||||
| ABS | ( |
( |
|||||||||||||||||||||||||||||||||||||||||||||
| CMBS | ( |
||||||||||||||||||||||||||||||||||||||||||||||
| RMBS | ( |
||||||||||||||||||||||||||||||||||||||||||||||
| Trading securities | ( |
||||||||||||||||||||||||||||||||||||||||||||||
| Equity securities | ( |
||||||||||||||||||||||||||||||||||||||||||||||
| Mortgage loans | |||||||||||||||||||||||||||||||||||||||||||||||
| Funds withheld at interest – embedded derivative | ( |
( |
|||||||||||||||||||||||||||||||||||||||||||||
| Derivative assets | |||||||||||||||||||||||||||||||||||||||||||||||
| Short-term investments | ( |
||||||||||||||||||||||||||||||||||||||||||||||
| Other investments | ( |
( |
|||||||||||||||||||||||||||||||||||||||||||||
| Investments in related parties | |||||||||||||||||||||||||||||||||||||||||||||||
| AFS securities | |||||||||||||||||||||||||||||||||||||||||||||||
| Corporate | ( |
( |
( |
||||||||||||||||||||||||||||||||||||||||||||
| CLO | |||||||||||||||||||||||||||||||||||||||||||||||
| ABS | ( |
||||||||||||||||||||||||||||||||||||||||||||||
| Trading securities | ( |
||||||||||||||||||||||||||||||||||||||||||||||
| Equity securities | |||||||||||||||||||||||||||||||||||||||||||||||
| Mortgage loans | ( |
||||||||||||||||||||||||||||||||||||||||||||||
| Investment funds | |||||||||||||||||||||||||||||||||||||||||||||||
| Funds withheld at interest – embedded derivative | ( |
( |
|||||||||||||||||||||||||||||||||||||||||||||
| Other investments | ( |
( |
|||||||||||||||||||||||||||||||||||||||||||||
| Reinsurance recoverable | |||||||||||||||||||||||||||||||||||||||||||||||
| Assets of consolidated VIEs | |||||||||||||||||||||||||||||||||||||||||||||||
| Trading securities | ( |
||||||||||||||||||||||||||||||||||||||||||||||
| Mortgage loans | ( |
||||||||||||||||||||||||||||||||||||||||||||||
| Investment funds | ( |
( |
( |
||||||||||||||||||||||||||||||||||||||||||||
| Other investments | ( |
||||||||||||||||||||||||||||||||||||||||||||||
Total Level 3 assets – Retirement Services |
$ | $ | $ | $ | $ | ( |
$ | $ | $ | ||||||||||||||||||||||||||||||||||||||
| (Continued) | |||||||||||||||||||||||||||||||||||||||||||||||
45
APOLLO GLOBAL MANAGEMENT, INC.
NOTES TO CONDENSED CONSOLIDATED FINANCIAL STATEMENTS (UNAUDITED)
| Three months ended June 30, 2025 | |||||||||||||||||||||||||||||||||||||||||||||||
| Total realized and unrealized gains (losses) | |||||||||||||||||||||||||||||||||||||||||||||||
| (In millions) | Beginning balance | Net purchases, issuances, sales and settlements | Net transfers in (out) | Ending balance |
Total gains (losses) included in OCI1
|
||||||||||||||||||||||||||||||||||||||||||
Liabilities – Asset Management |
|||||||||||||||||||||||||||||||||||||||||||||||
| Contingent consideration obligations | $ | $ | $ | $ | ( |
$ | $ | $ | |||||||||||||||||||||||||||||||||||||||
Total Level 3 liabilities – Asset Management |
$ | $ | $ | $ | ( |
$ | $ | $ | $ | ||||||||||||||||||||||||||||||||||||||
Liabilities – Retirement Services |
|||||||||||||||||||||||||||||||||||||||||||||||
| Interest sensitive contract liabilities | |||||||||||||||||||||||||||||||||||||||||||||||
| Embedded derivative | $ | ( |
$ | ( |
$ | $ | ( |
$ | ( |
$ | $ | ||||||||||||||||||||||||||||||||||||
| Universal life benefits | ( |
( |
|||||||||||||||||||||||||||||||||||||||||||||
| Future policy benefits | |||||||||||||||||||||||||||||||||||||||||||||||
| AmerUs Closed Block | ( |
( |
|||||||||||||||||||||||||||||||||||||||||||||
| ILICO Closed Block and life benefits | ( |
( |
|||||||||||||||||||||||||||||||||||||||||||||
| Other liabilities | ( |
( |
( |
||||||||||||||||||||||||||||||||||||||||||||
Total Level 3 liabilities – Retirement Services |
$ | ( |
$ | ( |
$ | $ | ( |
$ | $ | ( |
$ | $ | |||||||||||||||||||||||||||||||||||
| (Concluded) | |||||||||||||||||||||||||||||||||||||||||||||||
1 Related to instruments held at end of period.
| |||||||||||||||||||||||||||||||||||||||||||||||
| Three months ended June 30, 2024 | |||||||||||||||||||||||||||||||||||||||||||||||
| Total realized and unrealized gains (losses) | |||||||||||||||||||||||||||||||||||||||||||||||
| (In millions) | Beginning balance | Net purchases, issuances, sales and settlements | Net transfers in (out) | Ending balance |
Total gains (losses) included in OCI1
|
||||||||||||||||||||||||||||||||||||||||||
Assets – Asset Management |
|||||||||||||||||||||||||||||||||||||||||||||||
| Investments and derivative assets | $ | $ | ( |
$ | $ | $ | $ | $ | ( |
$ | |||||||||||||||||||||||||||||||||||||
| Investments of consolidated VIEs | ( |
( |
( |
( |
|||||||||||||||||||||||||||||||||||||||||||
Total Level 3 assets – Asset Management |
$ | $ | ( |
$ | $ | ( |
$ | ( |
$ | $ | ( |
$ | |||||||||||||||||||||||||||||||||||
Assets – Retirement Services |
|||||||||||||||||||||||||||||||||||||||||||||||
| AFS securities | |||||||||||||||||||||||||||||||||||||||||||||||
| Foreign governments | $ | $ | $ | $ | ( |
$ | $ | $ | $ | ||||||||||||||||||||||||||||||||||||||
| Corporate | ( |
( |
( |
||||||||||||||||||||||||||||||||||||||||||||
| ABS | ( |
( |
( |
( |
|||||||||||||||||||||||||||||||||||||||||||
| CMBS | ( |
( |
|||||||||||||||||||||||||||||||||||||||||||||
| RMBS | ( |
( |
( |
||||||||||||||||||||||||||||||||||||||||||||
| Trading securities | ( |
||||||||||||||||||||||||||||||||||||||||||||||
| Equity securities | |||||||||||||||||||||||||||||||||||||||||||||||
| Mortgage loans | |||||||||||||||||||||||||||||||||||||||||||||||
| Funds withheld at interest – embedded derivative | ( |
( |
|||||||||||||||||||||||||||||||||||||||||||||
| Derivative assets | |||||||||||||||||||||||||||||||||||||||||||||||
| Short-term investments | ( |
( |
|||||||||||||||||||||||||||||||||||||||||||||
| Other investments | ( |
( |
|||||||||||||||||||||||||||||||||||||||||||||
| (Continued) | |||||||||||||||||||||||||||||||||||||||||||||||
46
APOLLO GLOBAL MANAGEMENT, INC.
NOTES TO CONDENSED CONSOLIDATED FINANCIAL STATEMENTS (UNAUDITED)
| Three months ended June 30, 2024 | |||||||||||||||||||||||||||||||||||||||||||||||
| Total realized and unrealized gains (losses) | |||||||||||||||||||||||||||||||||||||||||||||||
| (In millions) | Beginning balance | Net purchases, issuances, sales and settlements | Net transfers in (out) | Ending balance |
Total gains (losses) included in OCI1
|
||||||||||||||||||||||||||||||||||||||||||
| Investments in related parties | |||||||||||||||||||||||||||||||||||||||||||||||
| AFS securities | |||||||||||||||||||||||||||||||||||||||||||||||
| Corporate | ( |
||||||||||||||||||||||||||||||||||||||||||||||
| CLO | |||||||||||||||||||||||||||||||||||||||||||||||
| ABS | ( |
( |
( |
||||||||||||||||||||||||||||||||||||||||||||
| Trading securities | ( |
( |
( |
||||||||||||||||||||||||||||||||||||||||||||
| Equity securities | ( |
( |
|||||||||||||||||||||||||||||||||||||||||||||
| Mortgage loans | |||||||||||||||||||||||||||||||||||||||||||||||
| Investment funds | ( |
( |
|||||||||||||||||||||||||||||||||||||||||||||
| Funds withheld at interest – embedded derivative | ( |
( |
|||||||||||||||||||||||||||||||||||||||||||||
| Other investments | ( |
( |
|||||||||||||||||||||||||||||||||||||||||||||
| Reinsurance recoverable | ( |
||||||||||||||||||||||||||||||||||||||||||||||
| Assets of consolidated VIEs | |||||||||||||||||||||||||||||||||||||||||||||||
| Trading securities | ( |
( |
|||||||||||||||||||||||||||||||||||||||||||||
| Mortgage loans | ( |
( |
( |
||||||||||||||||||||||||||||||||||||||||||||
| Investment funds | ( |
( |
|||||||||||||||||||||||||||||||||||||||||||||
| Other investments | ( |
( |
|||||||||||||||||||||||||||||||||||||||||||||
Total Level 3 assets – Retirement Services |
$ | $ | $ | ( |
$ | $ | ( |
$ | $ | $ | ( |
||||||||||||||||||||||||||||||||||||
Liabilities – Asset Management |
|||||||||||||||||||||||||||||||||||||||||||||||
| Contingent consideration obligations | $ | $ | $ | $ | ( |
$ | $ | $ | $ | ||||||||||||||||||||||||||||||||||||||
Total Level 3 liabilities – Asset Management |
$ | $ | $ | $ | ( |
$ | $ | $ | $ | ||||||||||||||||||||||||||||||||||||||
Liabilities – Retirement Services |
|||||||||||||||||||||||||||||||||||||||||||||||
| Interest sensitive contract liabilities | |||||||||||||||||||||||||||||||||||||||||||||||
| Embedded derivative | $ | ( |
$ | $ | $ | ( |
$ | $ | ( |
$ | $ | ||||||||||||||||||||||||||||||||||||
| Universal life benefits | ( |
( |
|||||||||||||||||||||||||||||||||||||||||||||
| Future policy benefits | |||||||||||||||||||||||||||||||||||||||||||||||
| AmerUs Closed Block | ( |
( |
|||||||||||||||||||||||||||||||||||||||||||||
| ILICO Closed Block and life benefits | ( |
( |
|||||||||||||||||||||||||||||||||||||||||||||
| Derivative liabilities | ( |
( |
|||||||||||||||||||||||||||||||||||||||||||||
| Other liabilities | ( |
( |
( |
||||||||||||||||||||||||||||||||||||||||||||
Total Level 3 liabilities – Retirement Services |
$ | ( |
$ | $ | $ | ( |
$ | $ | ( |
$ | $ | ||||||||||||||||||||||||||||||||||||
| (Concluded) | |||||||||||||||||||||||||||||||||||||||||||||||
1 Related to instruments held at end of period.
| |||||||||||||||||||||||||||||||||||||||||||||||
47
APOLLO GLOBAL MANAGEMENT, INC.
NOTES TO CONDENSED CONSOLIDATED FINANCIAL STATEMENTS (UNAUDITED)
| Six months ended June 30, 2025 | |||||||||||||||||||||||||||||||||||||||||||||||
| Total realized and unrealized gains (losses) | |||||||||||||||||||||||||||||||||||||||||||||||
| (In millions) | Beginning Balance | Net Purchases, Issuances, Sales and Settlements | Net Transfers In (Out) | Ending Balance |
Total Gains (Losses) Included in OCI1
|
||||||||||||||||||||||||||||||||||||||||||
Assets – Asset Management |
|||||||||||||||||||||||||||||||||||||||||||||||
| Investments and derivative assets | $ | $ | $ | $ | $ | $ | $ | ( |
$ | ||||||||||||||||||||||||||||||||||||||
| Investments of consolidated VIEs | ( |
( |
( |
||||||||||||||||||||||||||||||||||||||||||||
Total Level 3 assets – Asset Management |
$ | $ | $ | $ | $ | ( |
$ | $ | ( |
$ | |||||||||||||||||||||||||||||||||||||
Assets – Retirement Services |
|||||||||||||||||||||||||||||||||||||||||||||||
| AFS securities | |||||||||||||||||||||||||||||||||||||||||||||||
| Foreign governments | $ | $ | ( |
$ | $ | ( |
$ | $ | $ | $ | |||||||||||||||||||||||||||||||||||||
| Corporate | ( |
||||||||||||||||||||||||||||||||||||||||||||||
| ABS | ( |
||||||||||||||||||||||||||||||||||||||||||||||
| CMBS | ( |
( |
( |
||||||||||||||||||||||||||||||||||||||||||||
| RMBS | ( |
||||||||||||||||||||||||||||||||||||||||||||||
| Trading securities | ( |
( |
|||||||||||||||||||||||||||||||||||||||||||||
| Equity securities | ( |
( |
( |
||||||||||||||||||||||||||||||||||||||||||||
| Mortgage loans | |||||||||||||||||||||||||||||||||||||||||||||||
| Funds withheld at interest – embedded derivative | ( |
( |
|||||||||||||||||||||||||||||||||||||||||||||
| Derivative assets | |||||||||||||||||||||||||||||||||||||||||||||||
| Short-term investments | ( |
( |
|||||||||||||||||||||||||||||||||||||||||||||
| Other investments | ( |
( |
|||||||||||||||||||||||||||||||||||||||||||||
| Investments in related parties | |||||||||||||||||||||||||||||||||||||||||||||||
| AFS securities | |||||||||||||||||||||||||||||||||||||||||||||||
| Corporate | ( |
( |
( |
||||||||||||||||||||||||||||||||||||||||||||
| CLO | ( |
( |
|||||||||||||||||||||||||||||||||||||||||||||
| ABS | ( |
||||||||||||||||||||||||||||||||||||||||||||||
| Trading securities | ( |
||||||||||||||||||||||||||||||||||||||||||||||
| Equity securities | |||||||||||||||||||||||||||||||||||||||||||||||
| Mortgage loans | ( |
||||||||||||||||||||||||||||||||||||||||||||||
| Investment funds | |||||||||||||||||||||||||||||||||||||||||||||||
| Funds withheld at interest – embedded derivative | ( |
( |
|||||||||||||||||||||||||||||||||||||||||||||
| Other investments | |||||||||||||||||||||||||||||||||||||||||||||||
| Reinsurance recoverable | |||||||||||||||||||||||||||||||||||||||||||||||
| Assets of consolidated VIEs | |||||||||||||||||||||||||||||||||||||||||||||||
| Trading securities | |||||||||||||||||||||||||||||||||||||||||||||||
| Mortgage loans | ( |
||||||||||||||||||||||||||||||||||||||||||||||
| Investment funds | ( |
( |
( |
||||||||||||||||||||||||||||||||||||||||||||
| Other investments | |||||||||||||||||||||||||||||||||||||||||||||||
Total Level 3 assets – Retirement Services |
$ | $ | $ | $ | $ | ( |
$ | $ | $ | ||||||||||||||||||||||||||||||||||||||
| (Continued) | |||||||||||||||||||||||||||||||||||||||||||||||
48
APOLLO GLOBAL MANAGEMENT, INC.
NOTES TO CONDENSED CONSOLIDATED FINANCIAL STATEMENTS (UNAUDITED)
| Six months ended June 30, 2025 | |||||||||||||||||||||||||||||||||||||||||||||||
| Total realized and unrealized gains (losses) | |||||||||||||||||||||||||||||||||||||||||||||||
| (In millions) | Beginning Balance | Net Purchases, Issuances, Sales and Settlements | Net Transfers In (Out) | Ending Balance |
Total Gains (Losses) Included in OCI1
|
||||||||||||||||||||||||||||||||||||||||||
Liabilities – Asset Management |
|||||||||||||||||||||||||||||||||||||||||||||||
| Contingent consideration obligations | $ | $ | $ | $ | ( |
$ | $ | $ | $ | ||||||||||||||||||||||||||||||||||||||
Total Level 3 liabilities – Asset Management |
$ | $ | $ | $ | ( |
$ | $ | $ | $ | ||||||||||||||||||||||||||||||||||||||
Liabilities – Retirement Services |
|||||||||||||||||||||||||||||||||||||||||||||||
| Interest sensitive contract liabilities | |||||||||||||||||||||||||||||||||||||||||||||||
| Embedded derivative | $ | ( |
$ | $ | $ | ( |
$ | $ | ( |
$ | $ | ||||||||||||||||||||||||||||||||||||
| Universal life benefits | ( |
( |
( |
||||||||||||||||||||||||||||||||||||||||||||
| Future policy benefits | |||||||||||||||||||||||||||||||||||||||||||||||
| AmerUs Closed Block | ( |
( |
|||||||||||||||||||||||||||||||||||||||||||||
| ILICO Closed Block and life benefits | ( |
( |
( |
||||||||||||||||||||||||||||||||||||||||||||
| Derivative liabilities | ( |
||||||||||||||||||||||||||||||||||||||||||||||
| Other liabilities | ( |
( |
( |
||||||||||||||||||||||||||||||||||||||||||||
Total Level 3 liabilities – Retirement Services |
$ | ( |
$ | $ | $ | ( |
$ | $ | ( |
$ | $ | ||||||||||||||||||||||||||||||||||||
| (Concluded) | |||||||||||||||||||||||||||||||||||||||||||||||
1 Related to instruments held at end of period.
|
|||||||||||||||||||||||||||||||||||||||||||||||
| Six months ended June 30, 2024 | |||||||||||||||||||||||||||||||||||||||||||||||
| Total realized and unrealized gains (losses) | |||||||||||||||||||||||||||||||||||||||||||||||
| (In millions) | Beginning Balance | Net Purchases, Issuances, Sales and Settlements | Net Transfers In (Out) | Ending Balance |
Total Gains (Losses) Included in OCI1
|
||||||||||||||||||||||||||||||||||||||||||
Assets – Asset Management |
|||||||||||||||||||||||||||||||||||||||||||||||
| Investments and derivative assets | $ | $ | ( |
$ | $ | $ | $ | $ | $ | ||||||||||||||||||||||||||||||||||||||
| Investments of consolidated VIEs | ( |
( |
( |
||||||||||||||||||||||||||||||||||||||||||||
Total Level 3 assets – Asset Management |
$ | $ | ( |
$ | $ | $ | ( |
$ | $ | ( |
$ | ||||||||||||||||||||||||||||||||||||
Assets – Retirement Services |
|||||||||||||||||||||||||||||||||||||||||||||||
| AFS securities | |||||||||||||||||||||||||||||||||||||||||||||||
| Foreign governments | $ | $ | $ | $ | ( |
$ | $ | $ | $ | ||||||||||||||||||||||||||||||||||||||
| Corporate | ( |
( |
( |
||||||||||||||||||||||||||||||||||||||||||||
| ABS | ( |
||||||||||||||||||||||||||||||||||||||||||||||
| CMBS | ( |
||||||||||||||||||||||||||||||||||||||||||||||
| RMBS | ( |
( |
( |
||||||||||||||||||||||||||||||||||||||||||||
| Trading securities | ( |
( |
|||||||||||||||||||||||||||||||||||||||||||||
| Equity securities | |||||||||||||||||||||||||||||||||||||||||||||||
| Mortgage loans | ( |
( |
|||||||||||||||||||||||||||||||||||||||||||||
| Funds withheld at interest – embedded derivative | ( |
( |
|||||||||||||||||||||||||||||||||||||||||||||
| Derivative assets | |||||||||||||||||||||||||||||||||||||||||||||||
| Short-term investments | ( |
( |
|||||||||||||||||||||||||||||||||||||||||||||
| Other investments | ( |
( |
|||||||||||||||||||||||||||||||||||||||||||||
| (Continued) | |||||||||||||||||||||||||||||||||||||||||||||||
49
APOLLO GLOBAL MANAGEMENT, INC.
NOTES TO CONDENSED CONSOLIDATED FINANCIAL STATEMENTS (UNAUDITED)
| Six months ended June 30, 2024 | |||||||||||||||||||||||||||||||||||||||||||||||
| Total realized and unrealized gains (losses) | |||||||||||||||||||||||||||||||||||||||||||||||
| (In millions) | Beginning Balance | Net Purchases, Issuances, Sales and Settlements | Net Transfers In (Out) | Ending Balance |
Total Gains (Losses) Included in OCI1
|
||||||||||||||||||||||||||||||||||||||||||
| Investments in related parties | |||||||||||||||||||||||||||||||||||||||||||||||
| AFS securities | |||||||||||||||||||||||||||||||||||||||||||||||
| Corporate | |||||||||||||||||||||||||||||||||||||||||||||||
| CLO | |||||||||||||||||||||||||||||||||||||||||||||||
| ABS | ( |
( |
( |
||||||||||||||||||||||||||||||||||||||||||||
| Trading securities | ( |
( |
( |
||||||||||||||||||||||||||||||||||||||||||||
| Equity securities | ( |
( |
|||||||||||||||||||||||||||||||||||||||||||||
| Mortgage loans | |||||||||||||||||||||||||||||||||||||||||||||||
| Investment funds | ( |
( |
|||||||||||||||||||||||||||||||||||||||||||||
| Funds withheld at interest – embedded derivative | ( |
( |
|||||||||||||||||||||||||||||||||||||||||||||
| Other investments | ( |
( |
|||||||||||||||||||||||||||||||||||||||||||||
| Reinsurance recoverable | ( |
||||||||||||||||||||||||||||||||||||||||||||||
| Assets of consolidated VIEs | |||||||||||||||||||||||||||||||||||||||||||||||
| Trading securities | ( |
( |
|||||||||||||||||||||||||||||||||||||||||||||
| Mortgage loans | ( |
( |
( |
||||||||||||||||||||||||||||||||||||||||||||
| Investment funds | ( |
( |
|||||||||||||||||||||||||||||||||||||||||||||
| Other investments | ( |
( |
|||||||||||||||||||||||||||||||||||||||||||||
Total Level 3 assets – Retirement Services |
$ | $ | ( |
$ | ( |
$ | $ | ( |
$ | $ | ( |
$ | ( |
||||||||||||||||||||||||||||||||||
Liabilities – Asset Management |
|||||||||||||||||||||||||||||||||||||||||||||||
| Contingent consideration obligations | $ | $ | $ | $ | ( |
$ | $ | $ | $ | ||||||||||||||||||||||||||||||||||||||
Total Level 3 liabilities – Asset Management |
$ | $ | $ | $ | ( |
$ | $ | $ | $ | ||||||||||||||||||||||||||||||||||||||
Liabilities – Retirement Services |
|||||||||||||||||||||||||||||||||||||||||||||||
| Interest sensitive contract liabilities | |||||||||||||||||||||||||||||||||||||||||||||||
| Embedded derivative | $ | ( |
$ | ( |
$ | $ | ( |
$ | $ | ( |
$ | $ | |||||||||||||||||||||||||||||||||||
| Universal life benefits | ( |
( |
|||||||||||||||||||||||||||||||||||||||||||||
| Future policy benefits | |||||||||||||||||||||||||||||||||||||||||||||||
| AmerUs Closed Block | ( |
( |
|||||||||||||||||||||||||||||||||||||||||||||
| ILICO Closed Block and life benefits | ( |
( |
( |
||||||||||||||||||||||||||||||||||||||||||||
| Derivative liabilities | ( |
( |
|||||||||||||||||||||||||||||||||||||||||||||
| Other liabilities | ( |
( |
( |
||||||||||||||||||||||||||||||||||||||||||||
Total Level 3 liabilities – Retirement Services |
$ | ( |
$ | ( |
$ | $ | ( |
$ | $ | ( |
$ | $ | |||||||||||||||||||||||||||||||||||
| (Concluded) | |||||||||||||||||||||||||||||||||||||||||||||||
1 Related to instruments held at end of period.
| |||||||||||||||||||||||||||||||||||||||||||||||
50
APOLLO GLOBAL MANAGEMENT, INC.
NOTES TO CONDENSED CONSOLIDATED FINANCIAL STATEMENTS (UNAUDITED)
The following represents the gross components of purchases, issuances, sales and settlements, net, and net transfers in (out) shown above:
| Three months ended June 30, 2025 | |||||||||||||||||||||||||||||||||||||||||||||||
| (In millions) | Purchases | Issuances | Sales | Settlements | Net purchases, issuances, sales and settlements | Transfers In | Transfers Out | Net Transfers In (Out) | |||||||||||||||||||||||||||||||||||||||
Assets – Asset Management |
|||||||||||||||||||||||||||||||||||||||||||||||
| Investments and derivative assets | $ | $ | $ | ( |
$ | $ | $ | $ | $ | ||||||||||||||||||||||||||||||||||||||
| Investments of consolidated VIEs | ( |
( |
( |
||||||||||||||||||||||||||||||||||||||||||||
| Total Level 3 assets – Asset Management | $ | $ | $ | ( |
$ | $ | $ | $ | ( |
$ | ( |
||||||||||||||||||||||||||||||||||||
| Assets – Retirement Services | |||||||||||||||||||||||||||||||||||||||||||||||
| AFS securities | |||||||||||||||||||||||||||||||||||||||||||||||
| Foreign governments | $ | $ | $ | $ | ( |
( |
$ | $ | |||||||||||||||||||||||||||||||||||||||
| Corporate | ( |
||||||||||||||||||||||||||||||||||||||||||||||
| ABS | ( |
( |
( |
( |
|||||||||||||||||||||||||||||||||||||||||||
| RMBS | ( |
( |
( |
||||||||||||||||||||||||||||||||||||||||||||
| Trading securities | |||||||||||||||||||||||||||||||||||||||||||||||
| Equity securities | ( |
( |
|||||||||||||||||||||||||||||||||||||||||||||
| Mortgage loans | ( |
( |
|||||||||||||||||||||||||||||||||||||||||||||
| Short-term investments | ( |
( |
|||||||||||||||||||||||||||||||||||||||||||||
| Other investments | ( |
( |
|||||||||||||||||||||||||||||||||||||||||||||
| Investments in related parties | |||||||||||||||||||||||||||||||||||||||||||||||
| AFS securities | |||||||||||||||||||||||||||||||||||||||||||||||
| Corporate | ( |
( |
|||||||||||||||||||||||||||||||||||||||||||||
| ABS | ( |
( |
( |
||||||||||||||||||||||||||||||||||||||||||||
| Trading securities | ( |
( |
|||||||||||||||||||||||||||||||||||||||||||||
| Mortgage loans | ( |
( |
|||||||||||||||||||||||||||||||||||||||||||||
| Investment funds | |||||||||||||||||||||||||||||||||||||||||||||||
| Reinsurance recoverable | ( |
||||||||||||||||||||||||||||||||||||||||||||||
| Assets of consolidated VIEs | |||||||||||||||||||||||||||||||||||||||||||||||
| Trading securities | ( |
( |
( |
||||||||||||||||||||||||||||||||||||||||||||
| Mortgage loans | ( |
( |
( |
||||||||||||||||||||||||||||||||||||||||||||
| Investment funds | ( |
( |
|||||||||||||||||||||||||||||||||||||||||||||
| Other investments | |||||||||||||||||||||||||||||||||||||||||||||||
| Total Level 3 assets – Retirement Services | $ | $ | $ | ( |
$ | ( |
$ | $ | $ | ( |
$ | ( |
|||||||||||||||||||||||||||||||||||
| Liabilities - Asset Management | |||||||||||||||||||||||||||||||||||||||||||||||
| Contingent consideration obligations | $ | $ | $ | $ | ( |
$ | ( |
$ | $ | $ | |||||||||||||||||||||||||||||||||||||
Total Level 3 liabilities – Asset Management |
$ | $ | $ | $ | ( |
$ | ( |
$ | $ | $ | |||||||||||||||||||||||||||||||||||||
| Liabilities – Retirement Services | |||||||||||||||||||||||||||||||||||||||||||||||
| Interest sensitive contract liabilities – embedded derivative | $ | $ | ( |
$ | $ | $ | ( |
$ | $ | $ | |||||||||||||||||||||||||||||||||||||
| Total Level 3 liabilities – Retirement Services | $ | $ | ( |
$ | $ | $ | ( |
$ | $ | $ | |||||||||||||||||||||||||||||||||||||
1 Related to instruments held at end of period.
| |||||||||||||||||||||||||||||||||||||||||||||||
51
APOLLO GLOBAL MANAGEMENT, INC.
NOTES TO CONDENSED CONSOLIDATED FINANCIAL STATEMENTS (UNAUDITED)
| Three months ended June 30, 2024 | |||||||||||||||||||||||||||||||||||||||||||||||
| (In millions) | Purchases | Issuances | Sales | Settlements | Net purchases, issuances, sales and settlements | Transfers In | Transfers Out | Net Transfers In (Out) | |||||||||||||||||||||||||||||||||||||||
Assets – Asset Management |
|||||||||||||||||||||||||||||||||||||||||||||||
| Investments and derivative assets | $ | $ | $ | $ | $ | $ | $ | $ | |||||||||||||||||||||||||||||||||||||||
| Investments of consolidated VIEs | ( |
( |
( |
( |
|||||||||||||||||||||||||||||||||||||||||||
| Total Level 3 assets – Asset Management | $ | $ | $ | ( |
$ | $ | ( |
$ | $ | ( |
$ | ( |
|||||||||||||||||||||||||||||||||||
| Assets – Retirement Services | |||||||||||||||||||||||||||||||||||||||||||||||
| AFS securities | |||||||||||||||||||||||||||||||||||||||||||||||
| Foreign governments | $ | $ | $ | $ | ( |
$ | ( |
$ | $ | $ | |||||||||||||||||||||||||||||||||||||
| Corporate | ( |
( |
( |
( |
|||||||||||||||||||||||||||||||||||||||||||
| ABS | ( |
( |
( |
( |
|||||||||||||||||||||||||||||||||||||||||||
| RMBS | ( |
( |
( |
( |
|||||||||||||||||||||||||||||||||||||||||||
| Trading securities | ( |
( |
|||||||||||||||||||||||||||||||||||||||||||||
| Equity securities | |||||||||||||||||||||||||||||||||||||||||||||||
| Mortgage loans | ( |
||||||||||||||||||||||||||||||||||||||||||||||
| Short-term investments | ( |
( |
( |
( |
|||||||||||||||||||||||||||||||||||||||||||
| Other investments | |||||||||||||||||||||||||||||||||||||||||||||||
| Investments in related parties | |||||||||||||||||||||||||||||||||||||||||||||||
| AFS securities | |||||||||||||||||||||||||||||||||||||||||||||||
| Corporate | ( |
( |
( |
||||||||||||||||||||||||||||||||||||||||||||
| ABS | ( |
( |
|||||||||||||||||||||||||||||||||||||||||||||
| Trading securities | ( |
( |
|||||||||||||||||||||||||||||||||||||||||||||
| Mortgage loans | ( |
||||||||||||||||||||||||||||||||||||||||||||||
| Reinsurance recoverable | ( |
||||||||||||||||||||||||||||||||||||||||||||||
| Assets of consolidated VIEs | |||||||||||||||||||||||||||||||||||||||||||||||
| Trading securities | ( |
( |
|||||||||||||||||||||||||||||||||||||||||||||
| Mortgage loans | ( |
( |
|||||||||||||||||||||||||||||||||||||||||||||
| Total Level 3 assets – Retirement Services | $ | $ | $ | ( |
$ | ( |
$ | $ | $ | ( |
$ | ( |
|||||||||||||||||||||||||||||||||||
Liabilities - Asset Management |
|||||||||||||||||||||||||||||||||||||||||||||||
| Contingent consideration obligations | $ | $ | $ | $ | ( |
$ | ( |
$ | $ | $ | |||||||||||||||||||||||||||||||||||||
Total Level 3 liabilities – Asset Management |
$ | $ | $ | $ | ( |
$ | ( |
$ | $ | $ | |||||||||||||||||||||||||||||||||||||
Liabilities – Retirement Services |
|||||||||||||||||||||||||||||||||||||||||||||||
| Interest sensitive contract liabilities - embedded derivative | $ | $ | ( |
$ | $ | $ | ( |
$ | $ | $ | |||||||||||||||||||||||||||||||||||||
| Other liabilities | |||||||||||||||||||||||||||||||||||||||||||||||
Total Level 3 liabilities – Retirement Services |
$ | $ | ( |
$ | $ | $ | ( |
$ | $ | $ | |||||||||||||||||||||||||||||||||||||
52
APOLLO GLOBAL MANAGEMENT, INC.
NOTES TO CONDENSED CONSOLIDATED FINANCIAL STATEMENTS (UNAUDITED)
| Six months ended June 30, 2025 | |||||||||||||||||||||||||||||||||||||||||||||||
| (In millions) | Purchases | Issuances | Sales | Settlements | Net Purchases, Issuances, Sales and Settlements | Transfers In | Transfers Out | Net Transfers In (Out) | |||||||||||||||||||||||||||||||||||||||
Assets – Asset Management |
|||||||||||||||||||||||||||||||||||||||||||||||
| Investments and derivative assets | $ | $ | $ | ( |
$ | $ | $ | $ | $ | ||||||||||||||||||||||||||||||||||||||
| Investments of consolidated VIEs | ( |
( |
( |
( |
|||||||||||||||||||||||||||||||||||||||||||
Total Level 3 assets – Asset Management |
$ | $ | $ | ( |
$ | $ | $ | $ | ( |
$ | ( |
||||||||||||||||||||||||||||||||||||
Assets – Retirement Services |
|||||||||||||||||||||||||||||||||||||||||||||||
| AFS securities | |||||||||||||||||||||||||||||||||||||||||||||||
| Foreign governments | $ | $ | $ | $ | ( |
$ | ( |
$ | $ | $ | |||||||||||||||||||||||||||||||||||||
| Corporate | ( |
( |
( |
( |
|||||||||||||||||||||||||||||||||||||||||||
| ABS | ( |
( |
( |
( |
|||||||||||||||||||||||||||||||||||||||||||
| CMBS | ( |
( |
|||||||||||||||||||||||||||||||||||||||||||||
| RMBS | ( |
( |
( |
||||||||||||||||||||||||||||||||||||||||||||
| Trading securities | ( |
( |
( |
||||||||||||||||||||||||||||||||||||||||||||
| Equity securities | ( |
( |
|||||||||||||||||||||||||||||||||||||||||||||
| Mortgage loans | ( |
( |
|||||||||||||||||||||||||||||||||||||||||||||
| Short-term investments | ( |
( |
( |
( |
|||||||||||||||||||||||||||||||||||||||||||
| Other investments | ( |
( |
|||||||||||||||||||||||||||||||||||||||||||||
| Investments in related parties | |||||||||||||||||||||||||||||||||||||||||||||||
| AFS securities | |||||||||||||||||||||||||||||||||||||||||||||||
| Corporate | ( |
( |
|||||||||||||||||||||||||||||||||||||||||||||
| CLO | |||||||||||||||||||||||||||||||||||||||||||||||
| ABS | ( |
( |
( |
||||||||||||||||||||||||||||||||||||||||||||
| Trading securities | ( |
( |
( |
||||||||||||||||||||||||||||||||||||||||||||
| Mortgage loans | ( |
( |
( |
||||||||||||||||||||||||||||||||||||||||||||
| Investment funds | |||||||||||||||||||||||||||||||||||||||||||||||
| Reinsurance recoverable | ( |
||||||||||||||||||||||||||||||||||||||||||||||
| Assets of consolidated VIEs | |||||||||||||||||||||||||||||||||||||||||||||||
| Trading securities | ( |
( |
|||||||||||||||||||||||||||||||||||||||||||||
| Mortgage loans | ( |
( |
( |
||||||||||||||||||||||||||||||||||||||||||||
| Investment funds | ( |
( |
|||||||||||||||||||||||||||||||||||||||||||||
| Other investments | ( |
||||||||||||||||||||||||||||||||||||||||||||||
Total Level 3 assets – Retirement Services |
$ | $ | $ | ( |
$ | ( |
$ | $ | $ | ( |
$ | ( |
|||||||||||||||||||||||||||||||||||
Liabilities – Asset Management |
|||||||||||||||||||||||||||||||||||||||||||||||
| Contingent consideration obligations | $ | $ | $ | $ | ( |
$ | ( |
$ | $ | $ | |||||||||||||||||||||||||||||||||||||
Total Level 3 liabilities – Asset Management |
$ | $ | $ | $ | ( |
$ | ( |
$ | $ | $ | |||||||||||||||||||||||||||||||||||||
Liabilities – Retirement Services |
|||||||||||||||||||||||||||||||||||||||||||||||
| Interest sensitive contract liabilities – embedded derivative | $ | $ | ( |
$ | $ | $ | ( |
$ | $ | $ | |||||||||||||||||||||||||||||||||||||
| Other liabilities | |||||||||||||||||||||||||||||||||||||||||||||||
Total Level 3 liabilities – Retirement Services |
$ | $ | ( |
$ | $ | $ | ( |
$ | $ | $ | |||||||||||||||||||||||||||||||||||||
53
APOLLO GLOBAL MANAGEMENT, INC.
NOTES TO CONDENSED CONSOLIDATED FINANCIAL STATEMENTS (UNAUDITED)
| Six months ended June 30, 2024 | |||||||||||||||||||||||||||||||||||||||||||||||
| (In millions) | Purchases | Issuances | Sales | Settlements | Net Purchases, Issuances, Sales and Settlements | Transfers In | Transfers Out | Net Transfers In (Out) | |||||||||||||||||||||||||||||||||||||||
Assets – Asset Management |
|||||||||||||||||||||||||||||||||||||||||||||||
| Investments and derivative assets | $ | $ | $ | ( |
$ | $ | $ | $ | $ | ||||||||||||||||||||||||||||||||||||||
| Investments of consolidated VIEs | ( |
( |
( |
||||||||||||||||||||||||||||||||||||||||||||
Total Level 3 assets – Asset Management |
$ | $ | $ | ( |
$ | $ | $ | $ | ( |
$ | ( |
||||||||||||||||||||||||||||||||||||
Assets – Retirement Services |
|||||||||||||||||||||||||||||||||||||||||||||||
| AFS securities | |||||||||||||||||||||||||||||||||||||||||||||||
| Foreign governments | $ | $ | $ | $ | ( |
$ | ( |
$ | $ | $ | |||||||||||||||||||||||||||||||||||||
| Corporate | ( |
( |
( |
( |
|||||||||||||||||||||||||||||||||||||||||||
| ABS | ( |
( |
( |
||||||||||||||||||||||||||||||||||||||||||||
| RMBS | ( |
( |
( |
( |
|||||||||||||||||||||||||||||||||||||||||||
| Trading securities | ( |
( |
|||||||||||||||||||||||||||||||||||||||||||||
| Equity securities | ( |
||||||||||||||||||||||||||||||||||||||||||||||
| Mortgage loans | ( |
( |
|||||||||||||||||||||||||||||||||||||||||||||
| Derivative assets | |||||||||||||||||||||||||||||||||||||||||||||||
| Short-term investments | ( |
( |
( |
( |
( |
||||||||||||||||||||||||||||||||||||||||||
| Other investments | |||||||||||||||||||||||||||||||||||||||||||||||
| Investments in related parties | |||||||||||||||||||||||||||||||||||||||||||||||
| AFS securities | |||||||||||||||||||||||||||||||||||||||||||||||
| Corporate | ( |
( |
|||||||||||||||||||||||||||||||||||||||||||||
| ABS | ( |
( |
|||||||||||||||||||||||||||||||||||||||||||||
| Trading securities | ( |
( |
|||||||||||||||||||||||||||||||||||||||||||||
| Mortgage loans | ( |
||||||||||||||||||||||||||||||||||||||||||||||
| Reinsurance recoverable | ( |
||||||||||||||||||||||||||||||||||||||||||||||
| Assets of consolidated VIEs | |||||||||||||||||||||||||||||||||||||||||||||||
| Trading securities | ( |
( |
|||||||||||||||||||||||||||||||||||||||||||||
| Mortgage loans | ( |
( |
|||||||||||||||||||||||||||||||||||||||||||||
| Investment funds | |||||||||||||||||||||||||||||||||||||||||||||||
| Other investments | ( |
||||||||||||||||||||||||||||||||||||||||||||||
Total Level 3 assets – Retirement Services |
$ | $ | $ | ( |
$ | ( |
$ | $ | $ | ( |
$ | ( |
|||||||||||||||||||||||||||||||||||
Liabilities – Asset Management |
|||||||||||||||||||||||||||||||||||||||||||||||
| Contingent consideration obligations | $ | $ | $ | $ | ( |
$ | ( |
$ | $ | $ | |||||||||||||||||||||||||||||||||||||
Total Level 3 liabilities – Asset Management |
$ | $ | $ | $ | ( |
$ | ( |
$ | $ | $ | |||||||||||||||||||||||||||||||||||||
Liabilities – Retirement Services |
|||||||||||||||||||||||||||||||||||||||||||||||
| Interest sensitive contract liabilities – embedded derivative | $ | $ | ( |
$ | $ | $ | ( |
$ | $ | $ | |||||||||||||||||||||||||||||||||||||
| Other liabilities | |||||||||||||||||||||||||||||||||||||||||||||||
Total Level 3 liabilities – Retirement Services |
$ | $ | ( |
$ | $ | $ | ( |
$ | $ | $ | |||||||||||||||||||||||||||||||||||||
54
APOLLO GLOBAL MANAGEMENT, INC.
NOTES TO CONDENSED CONSOLIDATED FINANCIAL STATEMENTS (UNAUDITED)
Financial Instruments Without Readily Determinable Fair Values
Previously, the Company elected the measurement alternative under ASC 321 to account for an equity security that did not have a readily determinable fair value because of which the equity security was held at cost less any impairment. In connection with the initial public offering of the issuer of the equity security, the Company transitioned to measuring the investment at fair value using Level 1 inputs. This resulted in an observable transaction price below the Company’s carrying amount. Consequently, during the three months ended June 30, 2025, the Company recognized an impairment loss of $257 million and the carrying value of the investment was written down to its fair value of $101 million as of June 30, 2025.
The carrying amount of the equity security was $358 million, net of an impairment of $42 million, as of December 31, 2024.
Fair Value Option – Retirement Services
The following represents the gains (losses) recorded for instruments for which Athene has elected the fair value option, including related parties and VIEs:
| Three months ended June 30, | Six months ended June 30, | ||||||||||||||||||||||
| (In millions) | 2025 | 2024 | 2025 | 2024 | |||||||||||||||||||
| Trading securities | $ | $ | ( |
$ | $ | ( |
|||||||||||||||||
| Mortgage loans | ( |
||||||||||||||||||||||
| Investment funds | ( |
||||||||||||||||||||||
| Future policy benefits | |||||||||||||||||||||||
| Other | ( |
( |
( |
||||||||||||||||||||
| Total gains (losses) | $ | $ | $ | $ | ( |
||||||||||||||||||
Gains and losses on trading securities, mortgage loans, and other are recorded in investment related gains (losses) on the condensed consolidated statements of operations. Gains and losses related to investment funds are recorded in net investment income on the condensed consolidated statements of operations. Gains and losses related to investments of consolidated VIEs are recorded in revenues of consolidated VIEs on the condensed consolidated statements of operations. The change in fair value of future policy benefits is recorded in future policy and other policy benefits on the condensed consolidated statements of operations.
The following summarizes information for fair value option mortgage loans, including related parties and VIEs:
| (In millions) | June 30, 2025 | December 31, 2024 | |||||||||
| Unpaid principal balance | $ | $ | |||||||||
| Mark to fair value | ( |
( |
|||||||||
| Fair value | $ | $ | |||||||||
The following represents the commercial mortgage loan portfolio 90 days or more past due and/or in non-accrual status:
| (In millions) | June 30, 2025 | December 31, 2024 | |||||||||
| Unpaid principal balance of commercial mortgage loans 90 days or more past due and/or in non-accrual status | $ | $ | |||||||||
| Mark to fair value of commercial mortgage loans 90 days or more past due and/or in non-accrual status | ( |
( |
|||||||||
| Fair value of commercial mortgage loans 90 days or more past due and/or in non-accrual status | $ | $ | |||||||||
| Fair value of commercial mortgage loans 90 days or more past due | $ | $ | |||||||||
| Fair value of commercial mortgage loans in non-accrual status | |||||||||||
55
APOLLO GLOBAL MANAGEMENT, INC.
NOTES TO CONDENSED CONSOLIDATED FINANCIAL STATEMENTS (UNAUDITED)
The following represents the residential mortgage loan portfolio 90 days or more past due and/or in non-accrual status:
| (In millions) | June 30, 2025 | December 31, 2024 | |||||||||
| Unpaid principal balance of residential mortgage loans 90 days or more past due and/or in non-accrual status | $ | $ | |||||||||
| Mark to fair value of residential mortgage loans 90 days or more past due and/or in non-accrual status | ( |
( |
|||||||||
| Fair value of residential mortgage loans 90 days or more past due and/or in non-accrual status | $ | $ | |||||||||
Fair value of residential mortgage loans 90 days or more past due1
|
$ | $ | |||||||||
| Fair value of residential mortgage loans in non-accrual status | |||||||||||
1 As of June 30, 2025 and December 31, 2024, includes $ | |||||||||||
The following is the estimated amount of gains (losses) included in earnings during the period attributable to changes in instrument-specific credit risk on Athene’s mortgage loan portfolio:
| Three months ended June 30, | Six months ended June 30, | ||||||||||||||||||||||
| (In millions) | 2025 | 2024 | 2025 | 2024 | |||||||||||||||||||
| Mortgage loans | $ | ( |
$ | $ | ( |
$ | ( |
||||||||||||||||
The portion of gains and losses attributable to changes in instrument-specific credit risk is estimated by identifying commercial mortgage loans with loan-to-value ratios meeting credit quality criteria, and residential mortgage loans with delinquency status meeting credit quality criteria.
56
APOLLO GLOBAL MANAGEMENT, INC.
NOTES TO CONDENSED CONSOLIDATED FINANCIAL STATEMENTS (UNAUDITED)
Fair Value of Financial Instruments Not Carried at Fair Value – Retirement Services
The following represents Athene’s financial instruments not carried at fair value on the condensed consolidated statements of financial condition:
| June 30, 2025 | |||||||||||||||||||||||||||||||||||
| (In millions) | Carrying Value | Fair Value | NAV | Level 1 | Level 2 | Level 3 | |||||||||||||||||||||||||||||
| Financial assets | |||||||||||||||||||||||||||||||||||
| Investment funds | $ | $ | $ | $ | $ | $ | |||||||||||||||||||||||||||||
| Policy loans | |||||||||||||||||||||||||||||||||||
| Funds withheld at interest | |||||||||||||||||||||||||||||||||||
| Short-term investments | |||||||||||||||||||||||||||||||||||
| Other investments | |||||||||||||||||||||||||||||||||||
| Investments in related parties | |||||||||||||||||||||||||||||||||||
| Investment funds | |||||||||||||||||||||||||||||||||||
| Funds withheld at interest | |||||||||||||||||||||||||||||||||||
| Short-term investments | |||||||||||||||||||||||||||||||||||
| Total financial assets not carried at fair value | $ | $ | $ | $ | $ | $ | |||||||||||||||||||||||||||||
| Financial liabilities | |||||||||||||||||||||||||||||||||||
| Interest sensitive contract liabilities | $ | $ | $ | $ | $ | $ | |||||||||||||||||||||||||||||
| Debt | |||||||||||||||||||||||||||||||||||
| Securities to repurchase | |||||||||||||||||||||||||||||||||||
| Funds withheld liability | |||||||||||||||||||||||||||||||||||
| Total financial liabilities not carried at fair value | $ | $ | $ | $ | $ | $ | |||||||||||||||||||||||||||||
| December 31, 2024 | |||||||||||||||||||||||||||||||||||
| (In millions) | Carrying Value | Fair Value | NAV | Level 1 | Level 2 | Level 3 | |||||||||||||||||||||||||||||
| Financial assets | |||||||||||||||||||||||||||||||||||
| Investment funds | $ | $ | $ | $ | $ | $ | |||||||||||||||||||||||||||||
| Policy loans | |||||||||||||||||||||||||||||||||||
| Funds withheld at interest | |||||||||||||||||||||||||||||||||||
| Short-term investments | |||||||||||||||||||||||||||||||||||
| Other investments | |||||||||||||||||||||||||||||||||||
| Investments in related parties | |||||||||||||||||||||||||||||||||||
| Investment funds | |||||||||||||||||||||||||||||||||||
| Funds withheld at interest | |||||||||||||||||||||||||||||||||||
| Short-term investments | |||||||||||||||||||||||||||||||||||
| Total financial assets not carried at fair value | $ | $ | $ | $ | $ | $ | |||||||||||||||||||||||||||||
| Financial liabilities | |||||||||||||||||||||||||||||||||||
| Interest sensitive contract liabilities | $ | $ | $ | $ | $ | $ | |||||||||||||||||||||||||||||
| Debt | |||||||||||||||||||||||||||||||||||
| Securities to repurchase | |||||||||||||||||||||||||||||||||||
| Funds withheld liability | |||||||||||||||||||||||||||||||||||
| Total financial liabilities not carried at fair value | $ | $ | $ | $ | $ | $ | |||||||||||||||||||||||||||||
The fair value for financial instruments not carried at fair value are estimated using the same methods and assumptions as those carried at fair value. The financial instruments presented above are reported at carrying value on the condensed consolidated statements of financial condition; however, in the case of policy loans, funds withheld at interest and liability, short-term investments, and securities to repurchase, the carrying amount approximates fair value.
57
APOLLO GLOBAL MANAGEMENT, INC.
NOTES TO CONDENSED CONSOLIDATED FINANCIAL STATEMENTS (UNAUDITED)
Other investments – Other investments include investments in low-income housing and transferable energy tax credit structures. For those held using the proportional amortization method, the carrying value may include tax credits which have been received but not yet used, which are excluded from the measurement of the fair value estimate of the investment structures. Tax and other future benefits expected to be generated by these structures are valued using a discounted cash flow model. Received but unused tax credits included in the carrying value as of June 30, 2025 are expected to be used during the year ending December 31, 2025.
Interest sensitive contract liabilities – The carrying and fair value of interest sensitive contract liabilities above includes fixed indexed and traditional fixed annuities without mortality or morbidity risks, funding agreements, guaranteed investment contracts and payout annuities without life contingencies. The embedded derivatives within fixed indexed annuities without mortality or morbidity risks are excluded, as they are carried at fair value. The valuation of these investment contracts is based on discounted cash flow methodologies using significant unobservable inputs. The estimated fair value is determined using current market risk-free interest rates, adding a spread to reflect nonperformance risk and subtracting a risk margin to reflect uncertainty inherent in the projected cash flows.
Debt – The fair value of debt is obtained from commercial pricing services. See note 11 for further information on debt.
Significant Unobservable Inputs
Asset Management
Discounted Cash Flow and Direct Capitalization Model
When a discounted cash flow or direct capitalization model is used to determine fair value, the significant input used in the valuation model is the discount rate applied to present value the projected cash flows or the capitalization rate, respectively. Increases in the discount or capitalization rate can significantly lower the fair value of an investment and the contingent consideration obligations; conversely decreases in the discount or capitalization rate can significantly increase the fair value of an investment and the contingent consideration obligations. See note 16 for further discussion of the contingent consideration obligations.
Option Model
When an option model is used to determine fair value, the significant input used in the valuation model is the volatility rate applied to present value the projected cash flows. Increases in the volatility rate can significantly lower the fair value of an investment; conversely decreases in the discount or capitalization rate can significantly increase the fair value of an investment.
Consolidated VIEs’ Investments
The significant unobservable inputs used in the fair value measurement of the equity securities, bank loans and bonds are the discount rate and volatility rates applied in the valuation models. These inputs in isolation can cause significant increases or decreases in fair value, which would result in a significantly lower or higher fair value measurement. The discount and volatility rates are determined based on the market rates an investor would expect for a similar investment with similar risks.
NAV
Certain investments and investments of VIEs are valued using the NAV per share equivalent calculated by the investment manager as a practical expedient to determine an independent fair value.
Retirement Services
AFS, trading and equity securities
Athene uses discounted cash flow models to calculate the fair value for certain fixed maturity and equity securities. The discount rate is a significant unobservable input because the credit spread includes adjustments made to the base rate. The base rate represents a market comparable rate for securities with similar characteristics. This excludes assets for which fair value is provided by independent broker quotes.
58
APOLLO GLOBAL MANAGEMENT, INC.
NOTES TO CONDENSED CONSOLIDATED FINANCIAL STATEMENTS (UNAUDITED)
Mortgage loans
Athene uses discounted cash flow models from independent commercial pricing services to calculate the fair value of its mortgage loan portfolio. The discount rate is a significant unobservable input. This approach uses market transaction information and client portfolio-oriented information, such as prepayments or defaults, to support the valuations.
Interest sensitive contract liabilities – embedded derivative
Significant unobservable inputs used in the fixed indexed annuities embedded derivative of the interest sensitive contract liabilities valuation include:
1.Nonperformance risk – For contracts Athene issues, it uses the credit spread, relative to the U.S. Treasury curve based on Athene’s public credit rating as of the valuation date. This represents Athene’s credit risk used in the fair value estimate of embedded derivatives.
2.Option budget – Athene assumes future hedge costs in the derivative’s fair value estimate. The level of option budgets determines the future costs of the options and impacts future policyholder account value growth.
3.Policyholder behavior – Athene regularly reviews the full withdrawal (surrender rate) assumptions. These are based on initial pricing assumptions updated for actual experience. Actual experience may be limited for recently issued products.
Valuation of Underlying Investments
Asset Management
As previously noted, the underlying entities that Apollo manages and invests in are primarily investment companies that account for their investments at estimated fair value.
On a quarterly basis, valuation committees consisting of members from senior management review and approve the valuation results related to the investments of the funds Apollo manages. Apollo also retains external valuation firms to provide third-party valuation consulting services to Apollo, which consist of certain limited procedures that management identifies and requests them to perform. The limited procedures provided by the external valuation firms assist management with validating their valuation results or determining fair value. Apollo performs various back-testing procedures to validate their valuation approaches, including comparisons between expected and observed outcomes, forecast evaluations and variance analyses. However, because of the inherent uncertainty of valuation, those estimated values may differ significantly from the values that would have been used had a ready market for the investments existed, and the differences could be material.
Credit Investments
Credit investments are generally valued based on third-party vendor prices and/or quoted market prices and valuation models. Valuations using quoted market prices are based on the average of the “bid” and the “ask” quotes provided by multiple brokers wherever possible without any adjustments. Apollo will designate certain brokers to use to value specific securities. In determining the designated brokers, Apollo considers the following: (i) brokers with which Apollo has previously transacted, (ii) the underwriter of the security and (iii) active brokers indicating executable quotes. In addition, when valuing a security based on broker quotes wherever possible Apollo tests the standard deviation amongst the quotes received and the variance between the concluded fair value and the value provided by a pricing service. When relying on a third-party vendor as a primary source, Apollo (i) analyzes how the price has moved over the measurement period, (ii) reviews the number of brokers included in the pricing service’s population, if available, and (iii) validates the valuation levels with Apollo’s pricing team and traders.
Debt securities that are not publicly traded or whose market prices are not readily available are valued at fair value utilizing a model-based approach to determine fair value. Valuation approaches used to estimate the fair value of illiquid credit investments also may include the income approach, as described below. The valuation approaches used consider, as applicable, market risks, credit risks, counterparty risks and foreign currency risks.
59
APOLLO GLOBAL MANAGEMENT, INC.
NOTES TO CONDENSED CONSOLIDATED FINANCIAL STATEMENTS (UNAUDITED)
Equity Investments
The majority of illiquid equity investments are valued using the market approach and/or the income approach, as described below.
Market Approach
The market approach is driven by current market conditions, including actual trading levels of similar companies and, to the extent available, actual transaction data of similar companies. Judgment is required by management when assessing which companies are similar to the subject company being valued. Consideration may also be given to any of the following factors: (1) the subject company’s historical and projected financial data; (2) valuations given to comparable companies; (3) the size and scope of the subject company’s operations; (4) the subject company’s individual strengths and weaknesses; (5) expectations relating to the market’s receptivity to an offering of the subject company’s securities; (6) applicable restrictions on transfer; (7) industry and market information; (8) general economic and market conditions; and (9) other factors deemed relevant. Market approach valuation models typically employ a multiple that is based on one or more of the factors described above.
Enterprise value as a multiple of EBITDA is common and relevant for most companies and industries, however, other industry specific multiples are employed where available and appropriate. Sources for gaining additional knowledge related to comparable companies include public filings, annual reports, analyst research reports and press releases. Once a comparable company set is determined, Apollo reviews certain aspects of the subject company’s performance and determines how its performance compares to the group and to certain individuals in the group. Apollo compares certain measurements such as EBITDA margins, revenue growth over certain time periods, leverage ratios and growth opportunities. In addition, Apollo compares the entry multiple and its relation to the comparable set at the time of acquisition to understand its relation to the comparable set on each measurement date.
Income Approach
The income approach provides an indication of fair value based on the present value of cash flows that a business or security is expected to generate in the future. The most widely used methodology for the income approach is a discounted cash flow method. Inherent in the discounted cash flow method are significant assumptions related to the subject company’s expected results, the determination of a terminal value and a calculated discount rate, which is normally based on the subject company’s WACC. The WACC represents the required rate of return on total capitalization, which is comprised of a required rate of return on equity, plus the current tax-effected rate of return on debt, weighted by the relative percentages of equity and debt that are typical in the industry. The most critical step in determining the appropriate WACC for each subject company is to select companies that are comparable in nature to the subject company and the credit quality of the subject company. Sources for gaining additional knowledge about the comparable companies include public filings, annual reports, analyst research reports and press releases. The general formula then used for calculating the WACC considers the after-tax rate of return on debt capital and the rate of return on common equity capital, which further considers the risk-free rate of return, market beta, market risk premium and small stock premium, if applicable. The variables used in the WACC formula are inferred from the comparable market data obtained. The Company evaluates the comparable companies selected and concludes on WACC inputs based on the most comparable company or analyzes the range of data for the investment.
The value of liquid investments, where the primary market is an exchange (whether foreign or domestic), is determined using period end market prices. Such prices are generally based on the close price on the date of determination.
Certain of the funds Apollo manages may also enter into foreign currency exchange contracts, total return swap contracts, credit default swap contracts and other derivative contracts, which may include options, caps, collars and floors. Foreign currency exchange contracts are marked-to-market by recognizing the difference between the contract exchange rate and the current market rate as unrealized appreciation or depreciation. If securities are held at the end of the period, the changes in value are recorded in income as unrealized. Realized gains or losses are recognized when contracts are settled. Total return swap and credit default swap contracts are recorded at fair value as an asset or liability with changes in fair value recorded as unrealized appreciation or depreciation. Realized gains or losses are recognized at the termination of the contract based on the difference between the close-out price of the total return or credit default swap contract and the original contract price. Forward contracts are valued based on market rates obtained from counterparties or prices obtained from recognized financial data service providers.
60
APOLLO GLOBAL MANAGEMENT, INC.
NOTES TO CONDENSED CONSOLIDATED FINANCIAL STATEMENTS (UNAUDITED)
Retirement Services
AFS and trading securities
The fair values for most marketable securities without an active market are obtained from several commercial pricing services. These are classified as Level 2 assets. The pricing services incorporate a variety of market observable information in their valuation techniques, including benchmark yields, trading activity, credit quality, issuer spreads, bids, offers and other reference data. This category typically includes U.S. and non-U.S. corporate bonds, U.S. agency and government guaranteed securities, CLO, ABS, CMBS and RMBS.
Athene also has fixed maturity securities priced based on indicative broker quotes or by employing market accepted valuation models. For certain fixed maturity securities, the valuation model uses significant unobservable inputs and these are included in Level 3 in the fair value hierarchy. Significant unobservable inputs used include discount rates, issue-specific credit adjustments, material non-public financial information, estimation of future earnings and cash flows, default rate assumptions, liquidity assumptions and indicative quotes from market makers.
Privately placed fixed maturity securities are valued based on the credit quality and duration of comparable marketable securities, which may be securities of another issuer with similar characteristics. In some instances, a matrix-based pricing model is used. These models consider the current level of risk-free interest rates, corporate spreads, credit quality of the issuer and cash flow characteristics of the security. Additional factors such as net worth of the borrower, value of collateral, capital structure of the borrower, presence of guarantees and Athene’s evaluation of the borrower’s ability to compete in its relevant market are also considered. Privately placed fixed maturity securities are classified as Level 2 or 3.
Equity securities
Fair values of publicly traded equity securities are based on quoted market prices and classified as Level 1. Other equity securities, typically private equities or equity securities not traded on an exchange, are valued based on other sources, such as commercial pricing services or brokers, and are classified as Level 2 or 3.
Mortgage loans
Athene estimates fair value monthly using discounted cash flow analysis and rates being offered for similar loans to borrowers with similar credit ratings. Loans with similar characteristics are aggregated for purposes of the calculations. The discounted cash flow model uses unobservable inputs, including estimates of discount rates and loan prepayments. Mortgage loans are classified as Level 3.
Investment funds
Investment funds are typically measured using NAV as a practical expedient in determining fair value and are not classified in the fair value hierarchy. The carrying value reflects a pro rata ownership percentage as indicated by NAV in the investment fund financial statements, which may be adjusted if it is determined NAV is not calculated consistent with investment company fair value principles. The underlying investments of the investment funds may have significant unobservable inputs, which may include but are not limited to, comparable multiples and WACC rates applied in valuation models or a discounted cash flow model.
Certain investment funds for which Athene has elected the fair value option are included in Level 3 and are priced based on market accepted valuation models. The valuation models use significant unobservable inputs, which include material non-public financial information, estimation of future distributable earnings and demographic assumptions.
Other investments
The fair values of other investments are determined using a discounted cash flow model using discount rates for similar investments.
61
APOLLO GLOBAL MANAGEMENT, INC.
NOTES TO CONDENSED CONSOLIDATED FINANCIAL STATEMENTS (UNAUDITED)
Funds withheld at interest embedded derivatives
Funds withheld at interest embedded derivatives represent the right to receive or obligation to pay the total return on the assets supporting the funds withheld at interest or funds withheld liability, respectively, and are analogous to a total return swap with a floating rate leg. The fair value of embedded derivatives on funds withheld and modco agreements is measured as the unrealized gain (loss) on the underlying assets and classified as Level 3.
Derivatives
Derivative contracts can be exchange traded or over the counter. Exchange-traded derivatives typically fall within Level 1 of the fair value hierarchy depending on trading activity. Over-the-counter derivatives are valued using valuation models or an income approach using third-party broker valuations. Valuation models require a variety of inputs, including contractual terms, market prices, yield curves, credit curves, measures of volatility, prepayment rates and correlation of the inputs. Athene considers and incorporates counterparty credit risk in the valuation process through counterparty credit rating requirements and monitoring of overall exposure. Athene also evaluates and includes its own nonperformance risk in valuing derivatives. The majority of Athene’s derivatives trade in liquid markets; therefore, it can verify model inputs and model selection does not involve significant management judgment. These are typically classified within Level 2 of the fair value hierarchy.
Interest sensitive contract liabilities embedded derivatives
Embedded derivatives related to interest sensitive contract liabilities with fixed indexed annuity products are classified as Level 3. The valuations include significant unobservable inputs associated with economic assumptions and actuarial assumptions for policyholder behavior.
AmerUs Closed Block
Athene elected the fair value option for the future policy benefits liability in the AmerUs Closed Block. The valuation technique is to set the fair value of policyholder liabilities equal to the fair value of assets. There is an additional component which captures the fair value of the open block’s obligations to the closed block business. This component is the present value of the projected release of required capital and future earnings before income taxes on required capital supporting the AmerUs Closed Block, discounted at a rate which represents a market participant’s required rate of return, less the initial required capital. Unobservable inputs include estimates for these items. The AmerUs Closed Block policyholder liabilities and any corresponding reinsurance recoverable are classified as Level 3.
ILICO Closed Block
Athene elected the fair value option for the ILICO Closed Block. The valuation technique is to set the fair value of policyholder liabilities equal to the fair value of assets. There is an additional component which captures the fair value of the open block’s obligations to the closed block business. This component uses the present value of future cash flows which include commissions, administrative expenses, reinsurance premiums and benefits, and an explicit cost of capital. The discount rate includes a margin to reflect the business and nonperformance risk. Unobservable inputs include estimates for these items. The ILICO Closed Block policyholder liabilities and corresponding reinsurance recoverable are classified as Level 3.
Universal life liabilities and other life benefits
Athene elected the fair value option for certain blocks of universal and other life business ceded to Global Atlantic. Athene uses a present value of liability cash flows. Unobservable inputs include estimates of mortality, persistency, expenses, premium payments and a risk margin used in the discount rates that reflect the riskiness of the business. The universal life policyholder liabilities and corresponding reinsurance recoverable are classified as Level 3.
Other liabilities
Other liabilities include funds withheld liability embedded derivatives, as described above in funds withheld at interest embedded derivatives, and a ceded modco agreement of certain inforce funding agreement contracts for which Athene elected the fair value option. Athene estimates the fair value of the ceded modco agreement by discounting projected cash flows for net settlements and certain periodic and non-periodic payments. Unobservable inputs include estimates for asset portfolio returns
62
APOLLO GLOBAL MANAGEMENT, INC.
NOTES TO CONDENSED CONSOLIDATED FINANCIAL STATEMENTS (UNAUDITED)
and economic inputs used in the discount rate, including risk margin. Depending on the projected cash flows and other assumptions, the contract may be recorded as an asset or liability. The estimate is classified as Level 3.
7. Deferred Acquisition Costs, Deferred Sales Inducements and Value of Business Acquired
The following represents a rollforward of DAC and DSI by product, and a rollforward of VOBA. See note 8 for more information on Athene’s products.
| Six months ended June 30, 2025 | |||||||||||||||||||||||||||||||||||||||||
| DAC | DSI | VOBA | Total DAC, DSI and VOBA | ||||||||||||||||||||||||||||||||||||||
| (In millions) | Traditional Deferred Annuities | Indexed Annuities | Funding Agreements | Other Investment-type and other | Indexed Annuities | ||||||||||||||||||||||||||||||||||||
Balance at December 31, 2024 |
$ | $ | $ | $ | $ | $ | $ | ||||||||||||||||||||||||||||||||||
| Additions | |||||||||||||||||||||||||||||||||||||||||
| Amortization | ( |
( |
( |
( |
( |
( |
( |
||||||||||||||||||||||||||||||||||
| Other | |||||||||||||||||||||||||||||||||||||||||
Balance at June 30, 2025 |
$ | $ | $ | $ | $ | $ | $ | ||||||||||||||||||||||||||||||||||
| Six months ended June 30, 2024 | |||||||||||||||||||||||||||||||||||||||||
| DAC | DSI | VOBA | Total DAC, DSI and VOBA | ||||||||||||||||||||||||||||||||||||||
| (In millions) | Traditional Deferred Annuities | Indexed Annuities | Funding Agreements | Other Investment-type and other | Indexed Annuities | ||||||||||||||||||||||||||||||||||||
Balance at December 31, 2023 |
$ | $ | $ | $ | $ | $ | $ | ||||||||||||||||||||||||||||||||||
| Additions | |||||||||||||||||||||||||||||||||||||||||
| Amortization | ( |
( |
( |
( |
( |
( |
( |
||||||||||||||||||||||||||||||||||
| Other | ( |
( |
|||||||||||||||||||||||||||||||||||||||
Balance at June 30, 2024 |
$ | $ | $ | $ | $ | $ | $ | ||||||||||||||||||||||||||||||||||
Deferred costs related to universal life-type policies and investment contracts with significant revenue streams from sources other than investment of the policyholder funds, including traditional deferred annuities and indexed annuities, are amortized on a constant-level basis for a cohort of contracts using initial premium or deposit. Significant inputs and assumptions are required for determining the expected duration of the cohort and involves using accepted actuarial methods to determine decrement rates related to policyholder behavior for lapses, withdrawals (surrenders) and mortality. The assumptions used to determine the amortization of DAC and DSI are consistent with those used to estimate the related liability balance.
Deferred costs related to investment contracts without significant revenue streams from sources other than investment of policyholder funds are amortized using the effective interest method, which primarily includes funding agreements. The effective interest method requires inputs to project future cash flows, which for funding agreements includes contractual terms of notional value, periodic interest payments based on either fixed or floating interest rates, and duration. For other investment-type contracts which include immediate annuities and assumed endowments without significant mortality risks, assumptions are required related to policyholder behavior for lapses and withdrawals (surrenders).
8. Long-duration Contracts
Interest sensitive contract liabilities – Interest sensitive contract liabilities primarily include:
▪traditional deferred annuities,
▪indexed annuities consisting of fixed indexed, index-linked variable annuities, and assumed indexed universal life without significant mortality risk,
▪funding agreements, and
▪other investment-type contracts comprising of immediate annuities without significant mortality risk (which includes pension group annuities without life contingencies), guaranteed investment contracts, and assumed endowments without significant mortality risks.
63
APOLLO GLOBAL MANAGEMENT, INC.
NOTES TO CONDENSED CONSOLIDATED FINANCIAL STATEMENTS (UNAUDITED)
The following represents a rollforward of the policyholder account balance by product within interest sensitive contract liabilities. Where explicit policyholder account balances do not exist, the disaggregated rollforward represents the recorded reserve.
| Six months ended June 30, 2025 | |||||||||||||||||||||||||||||
| (In millions, except percentages) | Traditional Deferred Annuities | Indexed Annuities | Funding Agreements | Other Investment-type | Total | ||||||||||||||||||||||||
Balance at December 31, 2024 |
$ | $ | $ | $ | $ | ||||||||||||||||||||||||
| Deposits | |||||||||||||||||||||||||||||
| Policy charges | ( |
( |
( |
||||||||||||||||||||||||||
| Surrenders and withdrawals | ( |
( |
( |
( |
|||||||||||||||||||||||||
| Benefit payments | ( |
( |
( |
( |
( |
||||||||||||||||||||||||
| Interest credited | |||||||||||||||||||||||||||||
| Foreign exchange | |||||||||||||||||||||||||||||
| Other | ( |
||||||||||||||||||||||||||||
| Balance at June 30, 2025 | $ | $ | $ | $ | $ | ||||||||||||||||||||||||
| Weighted average crediting rate | % | % | % | % | |||||||||||||||||||||||||
| Net amount at risk | $ | $ | $ | $ | |||||||||||||||||||||||||
| Cash surrender value | |||||||||||||||||||||||||||||
| Six months ended June 30, 2024 | |||||||||||||||||||||||||||||
| (In millions, except percentages) | Traditional Deferred Annuities | Indexed Annuities | Funding Agreements | Other Investment-type | Total | ||||||||||||||||||||||||
Balance at December 31, 2023 |
$ | $ | $ | $ | $ | ||||||||||||||||||||||||
| Deposits | |||||||||||||||||||||||||||||
| Policy charges | ( |
( |
( |
||||||||||||||||||||||||||
| Surrenders and withdrawals | ( |
( |
( |
( |
|||||||||||||||||||||||||
| Benefit payments | ( |
( |
( |
( |
( |
||||||||||||||||||||||||
| Interest credited | |||||||||||||||||||||||||||||
| Foreign exchange | ( |
( |
( |
( |
( |
||||||||||||||||||||||||
| Other | ( |
( |
( |
||||||||||||||||||||||||||
| Balance at June 30, 2024 | $ | $ | $ | $ | $ | ||||||||||||||||||||||||
| Weighted average crediting rate | % | % | % | % | |||||||||||||||||||||||||
| Net amount at risk | $ | $ | $ | $ | |||||||||||||||||||||||||
| Cash surrender value | |||||||||||||||||||||||||||||
The following is a reconciliation of interest sensitive contract liabilities to the condensed consolidated statements of financial condition:
| June 30, | |||||||||||
| (In millions) | 2025 | 2024 | |||||||||
| Traditional deferred annuities | $ | $ | |||||||||
| Indexed annuities | |||||||||||
| Funding agreements | |||||||||||
| Other investment-type | |||||||||||
Reconciling items1
|
|||||||||||
| Interest sensitive contract liabilities | $ | $ | |||||||||
1 Reconciling items primarily include embedded derivatives in indexed annuities, unaccreted host contract adjustments on indexed annuities, negative VOBA, sales inducement liabilities, and wholly ceded universal life insurance contracts.
| |||||||||||
64
APOLLO GLOBAL MANAGEMENT, INC.
NOTES TO CONDENSED CONSOLIDATED FINANCIAL STATEMENTS (UNAUDITED)
The following represents policyholder account balances by range of guaranteed minimum crediting rates (“GMCR”), as well as the related range of the difference between rates being credited to policyholders and the respective guaranteed minimums. Athene’s funding agreements and other investment-type products provide Athene little to no discretionary ability to change the rates of interest payable to the respective policyholder or institution, and as a result, those policyholder account balances are excluded from the following tables.
| June 30, 2025 | |||||||||||||||||||||||
| (In millions) | At Guaranteed Minimum | Greater than |
Total | ||||||||||||||||||||
| Traditional deferred annuities | |||||||||||||||||||||||
< |
$ | $ | $ | $ | |||||||||||||||||||
| Total traditional deferred annuities | $ | $ | $ | $ | |||||||||||||||||||
| Indexed annuities | |||||||||||||||||||||||
< |
$ | $ | $ | $ | |||||||||||||||||||
| Total indexed annuities with GMCR | |||||||||||||||||||||||
Other1
|
|||||||||||||||||||||||
| Total indexed annuities | $ | ||||||||||||||||||||||
1 Includes account value allocated to an indexed strategy or other amounts without a GMCR.
| |||||||||||||||||||||||
| June 30, 2024 | |||||||||||||||||||||||
| (In millions) | At Guaranteed Minimum | Greater than |
Total | ||||||||||||||||||||
| Traditional deferred annuities | |||||||||||||||||||||||
< |
$ | $ | $ | $ | |||||||||||||||||||
| Total traditional deferred annuities | $ | $ | $ | $ | |||||||||||||||||||
| Indexed annuities | |||||||||||||||||||||||
< |
$ | $ | $ | $ | |||||||||||||||||||
| Total indexed annuities with GMCR | |||||||||||||||||||||||
Other1
|
|||||||||||||||||||||||
| Total indexed annuities | $ | ||||||||||||||||||||||
1 Includes account value allocated to an indexed strategy or other amounts without a GMCR.
| |||||||||||||||||||||||
Note: The amounts presented in this table have been revised to conform with the current year presentation to provide certain product-level detail and account value allocated to an indexed strategy or other amounts without a GMCR. | |||||||||||||||||||||||
65
APOLLO GLOBAL MANAGEMENT, INC.
NOTES TO CONDENSED CONSOLIDATED FINANCIAL STATEMENTS (UNAUDITED)
Future policy benefits – Future policy benefits consist primarily of payout annuities, including single premium immediate annuities with life contingencies (which include pension group annuities with life contingencies), and whole life insurance contracts.
The following is a rollforward by product within future policy benefits:
| Six months ended June 30, 2025 | |||||||||||||||||
| (In millions, except percentages and years) | Payout Annuities with Life Contingencies | Whole Life | Total | ||||||||||||||
| Present value of expected net premiums | |||||||||||||||||
| Beginning balance | $ | $ | $ | ||||||||||||||
| Effect of changes in discount rate assumptions | ( |
( |
|||||||||||||||
| Effect of foreign exchange on the change in discount rate assumptions | |||||||||||||||||
| Beginning balance at original discount rate | |||||||||||||||||
| Effect of actual to expected experience | ( |
( |
|||||||||||||||
| Adjusted balance | |||||||||||||||||
| Interest accrual | |||||||||||||||||
| Net premium collected | ( |
( |
|||||||||||||||
| Foreign exchange | |||||||||||||||||
| Ending balance at original discount rate | |||||||||||||||||
| Effect of changes in discount rate assumptions | |||||||||||||||||
| Ending balance, present value of expected net premiums | $ | $ | $ | ||||||||||||||
| Present value of expected future policy benefits | |||||||||||||||||
| Beginning balance | $ | $ | $ | ||||||||||||||
| Effect of changes in discount rate assumptions | |||||||||||||||||
| Effect of foreign exchange on the change in discount rate assumptions | ( |
( |
( |
||||||||||||||
| Beginning balance at original discount rate | |||||||||||||||||
| Effect of actual to expected experience | ( |
( |
|||||||||||||||
| Adjusted balance | |||||||||||||||||
| Issuances | |||||||||||||||||
| Interest accrual | |||||||||||||||||
| Benefit payments | ( |
( |
( |
||||||||||||||
| Foreign exchange | |||||||||||||||||
| Ending balance at original discount rate | |||||||||||||||||
| Effect of changes in discount rate assumptions | ( |
( |
( |
||||||||||||||
| Effect of foreign exchange on the change in discount rate assumptions | ( |
( |
( |
||||||||||||||
| Ending balance, present value of expected future policy benefits | |||||||||||||||||
| Less: Present value of expected net premiums | |||||||||||||||||
| Net future policy benefits | $ | $ | $ | ||||||||||||||
Weighted-average liability duration (in years)
|
|||||||||||||||||
| Weighted-average interest accretion rate | % | % | |||||||||||||||
| Weighted-average current discount rate | % | % | |||||||||||||||
| Expected future gross premiums, undiscounted | $ | $ | |||||||||||||||
Expected future gross premiums, discounted1
|
|||||||||||||||||
| Expected future benefit payments, undiscounted | |||||||||||||||||
1 Discounted at the original discount rate.
|
|||||||||||||||||
66
APOLLO GLOBAL MANAGEMENT, INC.
NOTES TO CONDENSED CONSOLIDATED FINANCIAL STATEMENTS (UNAUDITED)
| Six months ended June 30, 2024 | |||||||||||||||||
| (In millions, except percentages and years) | Payout Annuities with Life Contingencies | Whole Life | Total | ||||||||||||||
| Present value of expected net premiums | |||||||||||||||||
| Beginning balance | $ | $ | $ | ||||||||||||||
| Effect of changes in discount rate assumptions | ( |
( |
|||||||||||||||
| Effect of foreign exchange on the change in discount rate assumptions | ( |
( |
|||||||||||||||
| Beginning balance at original discount rate | |||||||||||||||||
| Effect of actual to expected experience | ( |
( |
|||||||||||||||
| Adjusted balance | |||||||||||||||||
| Interest accrual | |||||||||||||||||
| Net premium collected | ( |
( |
|||||||||||||||
| Foreign exchange | ( |
( |
|||||||||||||||
| Ending balance at original discount rate | |||||||||||||||||
| Effect of changes in discount rate assumptions | |||||||||||||||||
| Effect of foreign exchange on the change in discount rate assumptions | ( |
( |
|||||||||||||||
| Ending balance, present value of expected net premiums | $ | $ | $ | ||||||||||||||
| Present value of expected future policy benefits | |||||||||||||||||
| Beginning balance | $ | $ | $ | ||||||||||||||
| Effect of changes in discount rate assumptions | ( |
||||||||||||||||
| Effect of foreign exchange on the change in discount rate assumptions | ( |
( |
|||||||||||||||
| Beginning balance at original discount rate | |||||||||||||||||
| Effect of actual to expected experience | ( |
( |
( |
||||||||||||||
| Adjusted balance | |||||||||||||||||
| Issuances | |||||||||||||||||
| Interest accrual | |||||||||||||||||
| Benefit payments | ( |
( |
( |
||||||||||||||
| Foreign exchange | ( |
( |
( |
||||||||||||||
| Ending balance at original discount rate | |||||||||||||||||
| Effect of changes in discount rate assumptions | ( |
( |
( |
||||||||||||||
| Effect of foreign exchange on the change in discount rate assumptions | ( |
||||||||||||||||
| Ending balance, present value of expected future policy benefits | |||||||||||||||||
| Less: Present value of expected net premiums | |||||||||||||||||
| Net future policy benefits | $ | $ | $ | ||||||||||||||
Weighted-average liability duration (in years)
|
|||||||||||||||||
| Weighted-average interest accretion rate | % | % | |||||||||||||||
| Weighted-average current discount rate | % | % | |||||||||||||||
| Expected future gross premiums, undiscounted | $ | $ | |||||||||||||||
Expected future gross premiums, discounted1
|
|||||||||||||||||
| Expected future benefit payments, undiscounted | |||||||||||||||||
1 Discounted at the original discount rate.
| |||||||||||||||||
67
APOLLO GLOBAL MANAGEMENT, INC.
NOTES TO CONDENSED CONSOLIDATED FINANCIAL STATEMENTS (UNAUDITED)
The following is a reconciliation of future policy benefits to the condensed consolidated statements of financial condition:
| June 30, | |||||||||||
| (In millions) | 2025 | 2024 | |||||||||
| Payout annuities with life contingencies | $ | $ | |||||||||
| Whole life | |||||||||||
Reconciling items1
|
|||||||||||
| Future policy benefits | $ | $ | |||||||||
1 Reconciling items primarily include the deferred profit liability and negative VOBA associated with the liability for future policy benefits. Additionally, it includes term life reserves, fully ceded whole life reserves, and reserves for immaterial lines of business including accident and health and disability, as well as other insurance benefit reserves for no-lapse guarantees with universal life contracts, all of which are fully ceded.
| |||||||||||
The following is a reconciliation of premiums and interest expense relating to future policy benefits to the condensed consolidated statements of operations:
| Premiums | |||||||||||
| Six months ended June 30, | |||||||||||
| (In millions) | 2025 | 2024 | |||||||||
| Payout annuities with life contingencies | $ | $ | |||||||||
| Whole life | |||||||||||
Reconciling items1
|
|||||||||||
| Total premiums | $ | $ | |||||||||
| Interest expense | |||||||||||
| Six months ended June 30, | |||||||||||
| (In millions) | 2025 | 2024 | |||||||||
| Payout annuities with life contingencies | $ | $ | |||||||||
| Whole life | |||||||||||
Total interest expense |
$ | $ | |||||||||
1 Reconciling items primarily relate to immaterial lines of business including term life, fully ceded whole life, and accident and health and disability.
| |||||||||||
Significant assumptions and inputs to the calculation of future policy benefits for payout annuities with life contingencies include policyholder demographic data, assumptions for policyholder longevity and policyholder utilization for contracts with deferred lives, and discount rates. For whole life products, significant assumptions and inputs include policyholder demographic data, assumptions for mortality, morbidity, and lapse and discount rates.
Athene bases certain key assumptions related to policyholder behavior on industry standard data adjusted to align with actual company experience, if necessary. At least annually, Athene reviews all significant cash flow assumptions and updates as necessary, unless emerging experience indicates a more frequent review is necessary. The discount rate reflects market observable inputs from upper-medium grade fixed income instrument yields and is interpolated, where necessary, to conform to the duration of Athene’s liabilities.
During the six months ended June 30, 2025, the present value of expected future policy benefits decreased by $449 million, which was driven by $2,287 million of benefit payments, offset by $914 million of interest accruals, a $573 million change in discount rate assumptions related to a decrease in market observable rates, a $345 million change in foreign exchange and $133 million of issuances, primarily pension group annuities.
During the six months ended June 30, 2024, the present value of expected future policy benefits decreased by $2,572 million, which was driven by $2,287 million of benefit payments and a $1,431 million change in discount rate assumptions related to an increase in market observable rates, partially offset by $936 million of interest accrual.
68
APOLLO GLOBAL MANAGEMENT, INC.
NOTES TO CONDENSED CONSOLIDATED FINANCIAL STATEMENTS (UNAUDITED)
The following is a summary of remeasurement gains (losses) included within future policy and other policy benefits on the condensed consolidated statements of operations:
| Six months ended June 30, | |||||||||||
| (In millions) | 2025 | 2024 | |||||||||
| Reserves | $ | $ | |||||||||
| Deferred profit liability | ( |
||||||||||
| Negative VOBA | ( |
( |
|||||||||
| Total remeasurement gains (losses) | $ | $ | ( |
||||||||
During the six months ended June 30, 2025 and 2024, Athene recorded reserve increases of $8 million and $35 million, respectively, on the condensed consolidated statements of operations as a result of the present value of benefits and expenses exceeding the present value of gross premiums.
Market risk benefits – Athene issues and reinsures traditional deferred and indexed annuity products that contain GLWB and GMDB riders that meet the criteria to be classified as market risk benefits.
The following is a rollforward of net market risk benefit liabilities by product:
| Six months ended June 30, 2025 | |||||||||||||||||
| (In millions, except years) | Traditional Deferred Annuities | Indexed Annuities | Total | ||||||||||||||
Balance at December 31, 2024 |
$ | $ | $ | ||||||||||||||
| Effect of changes in instrument-specific credit risk | ( |
( |
( |
||||||||||||||
| Balance, beginning of period, before changes in instrument-specific credit risk | |||||||||||||||||
| Issuances | |||||||||||||||||
| Interest accrual | |||||||||||||||||
| Attributed fees collected | |||||||||||||||||
| Benefit payments | ( |
( |
( |
||||||||||||||
| Effect of changes in interest rates | ( |
( |
|||||||||||||||
| Effect of actual policyholder behavior compared to expected behavior | |||||||||||||||||
| Balance, end of period, before changes in instrument-specific credit risk | |||||||||||||||||
| Effect of changes in instrument-specific credit risk | |||||||||||||||||
Balance at June 30, 2025 |
|||||||||||||||||
| Less: Reinsurance recoverable | |||||||||||||||||
Balance at June 30, 2025, net of reinsurance |
$ | $ | $ | ||||||||||||||
| Net amount at risk | $ | $ | |||||||||||||||
Weighted-average attained age of contract holders (in years)
|
|||||||||||||||||
69
APOLLO GLOBAL MANAGEMENT, INC.
NOTES TO CONDENSED CONSOLIDATED FINANCIAL STATEMENTS (UNAUDITED)
| Six months ended June 30, 2024 | |||||||||||||||||
| (In millions, except years) | Traditional Deferred Annuities | Indexed Annuities | Total | ||||||||||||||
Balance at December 31, 2023 |
$ | $ | $ | ||||||||||||||
| Effect of changes in instrument-specific credit risk | ( |
( |
|||||||||||||||
| Balance, beginning of period, before changes in instrument-specific credit risk | |||||||||||||||||
| Issuances | |||||||||||||||||
| Interest accrual | |||||||||||||||||
| Attributed fees collected | |||||||||||||||||
| Benefit payments | ( |
( |
( |
||||||||||||||
| Effect of changes in interest rates | ( |
( |
( |
||||||||||||||
| Effect of changes in equity | ( |
( |
|||||||||||||||
| Effect of actual policyholder behavior compared to expected behavior | |||||||||||||||||
| Balance, end of period, before changes in instrument-specific credit risk | |||||||||||||||||
| Effect of changes in instrument-specific credit risk | ( |
||||||||||||||||
Balance at June 30, 2024 |
|||||||||||||||||
| Less: Reinsurance recoverable | |||||||||||||||||
Balance at June 30, 2024, net of reinsurance |
$ | $ | $ | ||||||||||||||
| Net amount at risk | $ | $ | |||||||||||||||
Weighted-average attained age of contract holders (in years)
|
|||||||||||||||||
The following is a reconciliation of market risk benefits to the condensed consolidated statements of financial condition. Market risk benefit assets are included in other assets on the condensed consolidated statements of financial condition.
| June 30, 2025 | |||||||||||||||||
| (In millions) | Asset | Liability | Net Liability | ||||||||||||||
| Traditional deferred annuities | $ | $ | $ | ||||||||||||||
| Indexed annuities | |||||||||||||||||
| Total | $ | $ | $ | ||||||||||||||
| June 30, 2024 | |||||||||||||||||
| (In millions) | Asset | Liability | Net Liability | ||||||||||||||
| Traditional deferred annuities | $ | $ | $ | ||||||||||||||
| Indexed annuities | |||||||||||||||||
| Total | $ | $ | $ | ||||||||||||||
During the six months ended June 30, 2025, net market risk benefit liabilities increased by $497 million, which was primarily driven by $201 million of issuances, $190 million in fees collected from policyholders, and $93 million of interest accruals.
During the six months ended June 30, 2024, net market risk benefit liabilities decreased by $17 million, which was primarily driven by a decrease of $383 million related to changes in the risk-free discount rate across the curve, offset by $175 million in fees collected from policyholders and $159 million of issuances.
The determination of the fair value of market risk benefits requires the use of inputs related to fees and assessments and assumptions in determining the projected benefits in excess of the projected account balance. Judgment is required for both economic and actuarial assumptions, which can be either observable or unobservable, that impact future policyholder account growth.
Economic assumptions include interest rates and implied volatilities throughout the duration of the liability. For indexed annuities, assumptions also include projected equity returns which impact cash flows attributable to indexed strategies, implied equity volatilities, expected index credits on the next policy anniversary date and future equity option costs. Assumptions related to the level of option budgets used for determining the future equity option costs and the impact on future policyholder account value growth are considered unobservable inputs.
70
APOLLO GLOBAL MANAGEMENT, INC.
NOTES TO CONDENSED CONSOLIDATED FINANCIAL STATEMENTS (UNAUDITED)
Policyholder behavior assumptions are unobservable inputs and are established using accepted actuarial valuation methods to estimate withdrawals (surrender rate) and income rider utilization. Assumptions are generally based on industry data and pricing assumptions which are updated for actual experience, if necessary. Actual experience may be limited for recently issued products.
All inputs are used to project excess benefits and fees over a range of risk-neutral, stochastic interest rate scenarios. For indexed annuities, stochastic equity return scenarios are also included within the range. A risk margin is incorporated within the discount rate to reflect uncertainty in the projected cash flows such as variations in policyholder behavior, as well as a credit spread to reflect nonperformance risk, which is considered an unobservable input. Athene uses its public credit rating relative to the U.S. Treasury curve as of the valuation date to reflect its nonperformance risk in the fair value estimate of market risk benefits.
The following summarizes the unobservable inputs for market risk benefits:
| June 30, 2025 | |||||||||||||||||||||||||||||||||||||||||||||||
| (In millions, except percentages) | Fair Value | Valuation Technique | Unobservable Inputs | Minimum | Maximum | Weighted Average | Impact of an Increase in the Input on Fair Value | ||||||||||||||||||||||||||||||||||||||||
| Market risk benefits, net | $ | Discounted cash flow | Nonperformance risk | % | % | % | 1 |
Decrease | |||||||||||||||||||||||||||||||||||||||
| Option budget | % | % | % | 2 |
Decrease | ||||||||||||||||||||||||||||||||||||||||||
| Surrender rate | % | % | % | 2 |
Decrease | ||||||||||||||||||||||||||||||||||||||||||
| Utilization rate | % | % | % | 3 |
Increase | ||||||||||||||||||||||||||||||||||||||||||
| June 30, 2024 | |||||||||||||||||||||||||||||||||||||||||||||||
| (In millions, except percentages) | Fair Value | Valuation Technique | Unobservable Inputs | Minimum | Maximum | Weighted Average | Impact of an Increase in the Input on Fair Value | ||||||||||||||||||||||||||||||||||||||||
| Market risk benefits, net | $ | Discounted cash flow | Nonperformance risk | % | % | % | 1 |
Decrease | |||||||||||||||||||||||||||||||||||||||
| Option budget | % | % | % | 2 |
Decrease | ||||||||||||||||||||||||||||||||||||||||||
| Surrender rate | % | % | % | 2 |
Decrease | ||||||||||||||||||||||||||||||||||||||||||
| Utilization rate | % | % | % | 3 |
Increase | ||||||||||||||||||||||||||||||||||||||||||
1 The nonperformance risk weighted average is based on the cash flows underlying the market risk benefit reserve.
| |||||||||||||||||||||||||||||||||||||||||||||||
2 The option budget and surrender rate weighted averages are calculated based on projected account values.
| |||||||||||||||||||||||||||||||||||||||||||||||
3 The utilization of GLWB withdrawals represents the estimated percentage of policyholders that are expected to use their income rider over the duration of the contract, with the weighted average based on current account values.
| |||||||||||||||||||||||||||||||||||||||||||||||
9. Profit Sharing Payable
Profit sharing payable was $1.9 billion and $1.9 billion as of June 30, 2025 and December 31, 2024, respectively. The below is a roll-forward of the profit-sharing payable balance:
| (In millions) | Total | ||||
Profit sharing payable, January 1, 2025 |
$ | ||||
| Profit sharing expense | |||||
| Payments/other | ( |
||||
Profit sharing payable, June 30, 2025 |
$ | ||||
Profit sharing expense includes (i) changes in amounts due to current and former employees entitled to a share of performance revenues in funds managed by Apollo and (ii) changes to the fair value of the contingent consideration obligations recognized in connection with certain of the Company’s acquisitions. Profit sharing payable excludes the potential return of profit-sharing distributions that would be due if certain funds were liquidated, which is recorded in due from related parties in the condensed consolidated statements of financial condition.
The Company requires that a portion of certain of the performance revenues distributed to the Company’s employees be used to purchase restricted shares of common stock issued under its Equity Plan. Prior to distribution of the performance revenues, the
71
APOLLO GLOBAL MANAGEMENT, INC.
NOTES TO CONDENSED CONSOLIDATED FINANCIAL STATEMENTS (UNAUDITED)
Company records the value of the equity-based awards expected to be granted in other assets and accounts payable, accrued expenses, and other liabilities.
10. Income Taxes
The Company’s income tax provision totaled $3 million and $261 million for the three months ended June 30, 2025 and 2024, respectively, and totaled $246 million and $683 million for the six months ended June 30, 2025 and 2024, respectively. The Company’s effective income tax rate was approximately 0.4 % and 18.2 % for the three months ended June 30, 2025 and 2024, respectively, and 12.1 % and 18.8 % for the six months ended June 30, 2025 and 2024, respectively.
Under U.S. GAAP, a tax benefit from an uncertain tax position may be recognized when it is more likely than not that the position will be sustained upon examination, including resolution of any related appeals or litigation, based on the technical merits of the position. As of June 30, 2025, the Company recorded $4 million of unrecognized tax benefits for uncertain tax positions. Approximately all of the unrecognized tax benefits, if recognized, would impact the effective tax rate. The Company does not believe that it has any tax positions for which it is reasonably possible that it will be required to record significant amounts of unrecognized tax benefits within the next twelve months.
The primary jurisdictions in which the Company operates and incurs income taxes are the United States, the United Kingdom, and Bermuda. There are no material unremitted earnings with respect to the United Kingdom or other foreign jurisdictions.
In the normal course of business, the Company is subject to examination by federal, state, local and foreign tax authorities. As of June 30, 2025, the Company’s U.S. federal, state, local and foreign income tax returns for the years 2021 through 2023 are open under the general statute of limitations provisions and therefore subject to examination. Currently, the Internal Revenue Service is examining the tax returns of the Company and certain subsidiaries for tax years 2019 to 2023. The State and City of New York are examining certain subsidiaries’ tax returns for tax years 2014 to 2023. The United Kingdom tax authorities are currently examining certain subsidiaries’ tax returns for tax years 2015 to 2022. There are other examinations ongoing in other state, local, and foreign jurisdictions in which the Company operates. No provisions with respect to these examinations have been recorded, other than the unrecognized tax benefits discussed above.
On June 28, 2025, the Group of Seven (“G7”)—comprising Canada, France, Germany, Italy, Japan, the United Kingdom, and the United States—released a joint statement supporting the exclusion of U.S. parented multinational groups from the Pillar Two Income Inclusion Rule (“IIR”) and Undertaxed Profits Rule (“UTPR”), with respect to both domestic and foreign profits. While such an exclusion would likely apply to the Company’s wholly-owned entities, its applicability to ACRA remains uncertain due to ACRA’s partial ownership by the Company. Additionally, it is unclear whether Bermuda will amend its corporate income tax (“CIT”) regime in response to the G7’s statement. The Company continues to monitor these developments closely. The Company’s financial results continue to reflect the impacts of both Pillar Two and the Bermuda CIT on U.S. and non-U.S. income. Any future changes to either regime could affect the Company’s financial statements.
On July 4, 2025, President Donald J. Trump signed into law H.R. 1, the One Big Beautiful Bill Act (the “OBBBA”). The OBBBA includes a broad range of tax reform provisions, including extending and modifying certain key provisions from the Tax Cuts and Jobs Act of 2017 and expanding certain incentives from the Inflation Reduction Act of 2022 while accelerating the phase-out of others. Certain provisions are effective starting in 2025, while others are not effective until 2026. The Company is currently evaluating the impact that the OBBBA will have on its consolidated financial statements.
72
APOLLO GLOBAL MANAGEMENT, INC.
NOTES TO CONDENSED CONSOLIDATED FINANCIAL STATEMENTS (UNAUDITED)
11. Debt
Company debt consisted of the following:
| June 30, 2025 | December 31, 2024 | |||||||||||||||||||||||||||||||
| (In millions, except percentages) | Maturity Date | Outstanding Balance | Fair Value | Outstanding Balance | Fair Value | |||||||||||||||||||||||||||
| Asset Management | ||||||||||||||||||||||||||||||||
| May 27, 2026 | $ | $ | 3 |
$ | $ | 3 |
||||||||||||||||||||||||||
| February 15, 2029 | 3 |
3 |
||||||||||||||||||||||||||||||
| June 5, 2030 | 3 |
3 |
||||||||||||||||||||||||||||||
| November 15, 2033 | 3 |
3 |
||||||||||||||||||||||||||||||
| March 15, 2048 | 3 |
3 |
||||||||||||||||||||||||||||||
| May 21, 2054 | 3 |
3 |
||||||||||||||||||||||||||||||
| September 15, 2053 | 4 |
4 |
||||||||||||||||||||||||||||||
December 15, 2054 |
3 |
3 |
||||||||||||||||||||||||||||||
| Retirement Services | ||||||||||||||||||||||||||||||||
| January 12, 2028 | 3 |
3 |
||||||||||||||||||||||||||||||
| April 3, 2030 | 3 |
3 |
||||||||||||||||||||||||||||||
| January 15, 2031 | 3 |
3 |
||||||||||||||||||||||||||||||
| February 1, 2033 | 3 |
3 |
||||||||||||||||||||||||||||||
| January 15, 2034 | 3 |
3 |
||||||||||||||||||||||||||||||
| May 25, 2051 | 3 |
3 |
||||||||||||||||||||||||||||||
| May 15, 2052 | 3 |
3 |
||||||||||||||||||||||||||||||
| April 1, 2054 | 3 |
3 |
||||||||||||||||||||||||||||||
| May 19, 2055 | 3 |
|||||||||||||||||||||||||||||||
| October 15, 2054 | 3 |
3 |
||||||||||||||||||||||||||||||
| June 28, 2055 | 3 |
|||||||||||||||||||||||||||||||
| March 30, 2064 | 4 |
4 |
||||||||||||||||||||||||||||||
| Total Debt | $ | $ | $ | $ | ||||||||||||||||||||||||||||
1 Interest rate is calculated as weighted average annualized.
| ||||||||||||||||||||||||||||||||
2 Includes amortization of note discount, as applicable, totaling $ | ||||||||||||||||||||||||||||||||
3 Fair value is based on broker quotes. These notes are valued using Level 2 inputs based on the number and quality of broker quotes obtained, the standard deviations of the observed broker quotes and the percentage deviation from external pricing services.
| ||||||||||||||||||||||||||||||||
4 Fair value is based on quoted market prices. These notes are classified as a Level 1 liability within the fair value hierarchy.
| ||||||||||||||||||||||||||||||||
Asset Management – Notes Issued
The indentures governing the 2026 Senior Notes, the 2029 Senior Notes, the 2030 Senior Notes, the 2033 Senior Notes, the 2048 Senior Notes, the 2054 Senior Notes, the 2053 Subordinated Notes and the 2054 Subordinated Notes restrict the ability of AGM, AMH and the guarantors of the notes to incur indebtedness secured by liens on voting stock or profit participating equity interests of their respective subsidiaries, or merge, consolidate or sell, transfer or lease assets. The indentures also provide for customary events of default.
Retirement Services – Notes Issued
AHL Senior Notes – AHL’s senior unsecured notes are callable by AHL at any time. If called prior to a defined period before the scheduled maturity date, typically three or six months, the price is equal to the greater of (1) 100 % of the principal and any accrued and unpaid interest and (2) an amount equal to the sum of the present values of remaining scheduled payments, discounted from the scheduled payment date to the redemption date at the treasury rate plus a spread (as defined in the applicable prospectus supplement) and any accrued and unpaid interest.
73
APOLLO GLOBAL MANAGEMENT, INC.
NOTES TO CONDENSED CONSOLIDATED FINANCIAL STATEMENTS (UNAUDITED)
During the second quarter of 2025, AHL issued $1.0 billion of 6.625 % Senior Notes due May 19, 2055 (the “2055 AHL Senior Notes”). AHL will accrue interest quarterly and pay interest on the 2055 AHL Senior Notes semi-annually, commencing on November 19, 2025.
AHL Subordinated Notes – AHL has fixed-rate reset subordinated notes outstanding, which pay interest at the initially stated fixed rate until the interest rate reset dates, at which point the interest rate resets to the Five-Year U.S. Treasury Rate plus a spread. Reset terms are as defined in the applicable prospectus supplement. AHL may defer interest payments on the subordinated notes for up to consecutive years.
During the second quarter of 2025, AHL issued $600 million of 6.875 % Fixed-Rate Reset Junior Subordinated Debentures due June 28, 2055 (the “2055 AHL Subordinated Notes”). Athene will accrue interest quarterly and pay interest semi-annually at an annual fixed rate of 6.875 % on the 2055 AHL Subordinated Notes, commencing on December 28, 2025 until June 28, 2035. On June 28, 2035, and every fifth annual anniversary thereafter, the interest rate will reset to the Five-Year U.S. Treasury Rate (as defined in the applicable prospectus supplement) plus 2.582 %. AHL may defer interest payments on the 2055 AHL Subordinated Notes for up to consecutive years.
Credit and Liquidity Facilities
The following table represents the Company’s credit and liquidity facilities as of June 30, 2025:
| Instrument/Facility | Borrowing Date | Maturity Date | Administrative Agent | Key terms | ||||||||||
|
Asset Management -
AGM credit facility
|
N/A | November 21, 2029 | Citibank | The borrowing capacity under the AGM credit facility is $ |
||||||||||
|
Retirement Services -
AHL credit facility
|
N/A | June 30, 2028 | Citibank | The borrowing capacity under the AHL credit facility is $ |
||||||||||
|
Retirement Services -
AHL liquidity facility
|
N/A | June 26, 2026 | Wells Fargo Bank | The borrowing capacity under the AHL liquidity facility is $ |
||||||||||
Asset Management – Credit Facility
On November 21, 2024, AGM and AMH, as parent borrower and subsidiary borrower, respectively, entered into a $1.25 billion revolving credit facility with Citibank, N.A., as administrative agent, which matures on November 21, 2029 (“AGM credit facility”). As of June 30, 2025, AGM and AMH, as borrowers under the facility, could incur incremental facilities in an aggregate amount not to exceed $250 million plus additional amounts so long as AGM and AMH were in compliance with a net leverage ratio not to exceed 4.00 to 1.00.
As of June 30, 2025 and December 31, 2024, there were no
Retirement Services – Credit and Liquidity Facilities
AHL Credit Facility—On June 30, 2023, AHL, ALRe, AUSA and AARe entered into a five-year revolving credit agreement with a syndicate of banks and Citibank, N.A. as administrative agent (“AHL credit facility”). The AHL credit facility is unsecured and has a commitment termination date of June 30, 2028, subject to up to two one-year extensions, in accordance with the terms of the AHL credit facility. In connection with the AHL credit facility, AHL and AUSA guaranteed all of the obligations of AHL, ALRe, AARe and AUSA under the AHL credit facility and the related loan documents, and ALRe and AARe guaranteed certain of the obligations of AHL, ALRe, AARe and AUSA under the AHL credit facility and the related loan documents. The borrowing capacity under the AHL credit facility is $1.25 billion, subject to being increased up to $1.75 billion in total on the terms described in the AHL credit facility.
The AHL credit facility contains various standard covenants with which Athene must comply, including the following:
1.Consolidated debt-to-capitalization ratio not to exceed 35 %;
2.Minimum consolidated net worth of no less than $14.8 billion; and
3.Restrictions on Athene’s ability to incur liens, with certain exceptions.
74
APOLLO GLOBAL MANAGEMENT, INC.
NOTES TO CONDENSED CONSOLIDATED FINANCIAL STATEMENTS (UNAUDITED)
Interest accrues on outstanding borrowings at either the adjusted term secured overnight financing rate plus a margin or the base rate plus a margin, with the applicable margin varying based on AHL’s debt rating. Rates and terms are as defined in the AHL credit facility. As of June 30, 2025 and December 31, 2024, there were no
AHL Liquidity Facility—On June 27, 2025, AHL, AARe, ALRe and AAIA entered into a revolving credit agreement with a syndicate of banks and Wells Fargo Bank, National Association, as administrative agent, (“AHL liquidity facility”), which replaced the previous credit agreement dated as of June 28, 2024 and the commitments under it, which expired on June 27, 2025. The AHL liquidity facility is unsecured and has a commitment termination date of June 26, 2026, subject to any extensions of additional 364 -day periods with consent of extending lenders and/or “term-out” of outstanding loans (by which, at Athene’s election, the outstanding loans may be converted to term loans which shall have a maturity of up to one year after the original maturity date), in each case in accordance with the terms of the AHL liquidity facility. In connection with the AHL liquidity facility, AARe guaranteed all of the obligations of each other borrower under the AHL liquidity facility and the related loan documents. The AHL liquidity facility will be used for liquidity and working capital needs to meet short-term cash flow and investment timing differences. The borrowing capacity under the AHL liquidity facility is $2.6 billion, subject to being increased up to $3.1 billion in total on the terms described in the AHL liquidity facility. The AHL liquidity facility contains various standard covenants with which Athene must comply, including the following:
1.AARe minimum consolidated net worth of no less than $23.2 billion; and
2.Restrictions on Athene’s ability to incur liens, with certain exceptions.
Interest accrues on outstanding borrowings at the adjusted term secured overnight financing rate plus a margin or the base rate plus a margin, with applicable margin varying based on AARe’s financial strength rating. Rates and terms are as defined in the AHL liquidity facility. As of June 30, 2025 and December 31, 2024, there were no
Interest Expense
The following table presents the interest expense incurred related to the Company’s debt:
| Three months ended June 30, | Six months ended June 30, | ||||||||||||||||||||||
| (In millions) | 2025 | 2024 | 2025 | 2024 | |||||||||||||||||||
| Asset Management | $ | $ | $ | $ | |||||||||||||||||||
Retirement Services1
|
|||||||||||||||||||||||
| Total Interest Expense | $ | $ | $ | $ | |||||||||||||||||||
Note: Debt issuance costs incurred are amortized into interest expense over the term of the debt arrangement, as applicable. | |||||||||||||||||||||||
1 Interest expense for Retirement Services is included in policy and other operating expenses on the condensed consolidated statements of operations.
| |||||||||||||||||||||||
12. Equity-Based Compensation
Under the Equity Plan, the Company grants equity-based awards to employees. Equity-based awards granted to employees and non-employees as compensation are measured based on the grant date fair value of the award, which considers the public share price of AGM’s common stock subject to certain discounts, as applicable.
The Company grants both service-based and performance-based awards. The estimated total grant date fair value for service-based awards is charged to compensation expense on a straight-line basis over the vesting period, which is generally to five years from the date of grant. Certain service-based awards are tied to profit sharing arrangements in which a portion of the performance fees distributed to the general partner are required to be used by employees to purchase restricted shares of common stock or are delivered in the form of RSUs, which are granted under the Company’s Equity Plan. Performance-based awards vest subject to continued employment and the Company’s achievement of specified performance goals. In accordance with U.S. GAAP, equity-based compensation expense for performance grants are typically recognized on an accelerated recognition method over the requisite service period to the extent the performance revenue metrics are met or deemed probable. Equity-based awards that do not require future service (i.e., vested awards) are expensed immediately.
75
APOLLO GLOBAL MANAGEMENT, INC.
NOTES TO CONDENSED CONSOLIDATED FINANCIAL STATEMENTS (UNAUDITED)
For the three months ended June 30, 2025 and 2024, the Company recorded equity-based compensation expense of $166 million and $153 million, respectively. For the six months ended June 30, 2025 and 2024, the Company recorded equity-based compensation expense of $315 million and $342 million, respectively. As of June 30, 2025, there was $840 million of estimated unrecognized compensation expense related to unvested RSU awards. This cost is expected to be recognized over a weighted-average period of 2.1 years.
Service-Based Awards
During the six months ended June 30, 2025 and 2024, the Company awarded 3.4 million and 3.4 million of service-based RSUs, with a grant date fair value of $527 million and $366 million, respectively.
During the three months ended June 30, 2025 and 2024, the Company recorded equity-based compensation expense on service-based RSUs of $126 million and $109 million, respectively. During the six months ended June 30, 2025 and 2024, the Company recorded equity-based compensation expense on service-based RSUs of $243 million and $201 million, respectively.
Performance-Based Awards
During the six months ended June 30, 2025, there were no performance-based RSUs awarded. During the six months ended June 30, 2024, the Company awarded 0.9 million of performance-based RSUs, with a grant date fair value of $87 million, which primarily vest subject to continued employment and the Company’s receipt of performance revenues, within prescribed periods, sufficient to cover the associated equity-based compensation expense.
During the three months ended June 30, 2025 and 2024, the Company recorded equity-based compensation expense on performance-based awards of $21 million and $33 million, respectively. During the six months ended June 30, 2025 and 2024, the Company recorded equity-based compensation expense on performance-based awards of $37 million and $107 million, respectively.
In December 2021, the Company awarded one-time grants to the Co-Presidents of AAM of 6.0 million RSUs which vest on a cliff basis subject to continued employment over five years , with 2.0 million of those RSUs also subject to the Company’s achievement of certain fee related earnings and spread related earnings per share metrics.
During the three months ended June 30, 2025 and 2024, the Company recorded equity-based compensation expense for service-based awards related to these one-time grants of $14 million and $14 million, respectively. During the six months ended June 30, 2025 and 2024, the Company recorded equity-based compensation expense for service-based awards related to these one-time grants of $28 million and $28 million, respectively.
During the three months ended June 30, 2025 and 2024, the Company recorded equity-based compensation expense for performance-based awards related to these one-time grants of $6 million and $6 million, respectively. During the six months ended June 30, 2025 and 2024, the Company recorded equity-based compensation expense for performance-based awards related to these one-time grants of $12 million and $12 million, respectively.
The following table summarizes all RSU activity for the current period:
| Unvested | Weighted Average Grant Date Fair Value | Vested | Total Number of RSUs Outstanding | ||||||||||||||||||||
| Balance at January 1, 2025 | $ | ||||||||||||||||||||||
| Granted | |||||||||||||||||||||||
| Forfeited | ( |
( |
( |
||||||||||||||||||||
| Vested | ( |
||||||||||||||||||||||
| Issued | — | — | ( |
( |
|||||||||||||||||||
| Balance at June 30, 2025 | $ | ||||||||||||||||||||||
76
APOLLO GLOBAL MANAGEMENT, INC.
NOTES TO CONDENSED CONSOLIDATED FINANCIAL STATEMENTS (UNAUDITED)
Restricted Stock Awards
During the six months ended June 30, 2025 and 2024, the Company awarded 0.1 million and 0.1 million restricted stock awards, respectively, from profit sharing arrangements with a grant date fair value of $18 million and $11 million, respectively.
During the three months ended June 30, 2025 and 2024, the Company recorded equity-based compensation expense related to restricted stock awards from profit sharing arrangements of $10 million and $10 million, respectively. During the six months ended June 30, 2025 and 2024, the Company recorded equity-based compensation expense related to restricted stock awards from profit sharing arrangements of $18 million and $22 million, respectively.
13. Equity
Common Stock
Holders of common stock are entitled to participate in dividends from the Company on a pro rata basis.
During the three and six months ended June 30, 2025 and 2024, the Company issued shares of common stock in settlement of vested RSUs. The Company has generally allowed holders of vested RSUs and exercised share options to settle their tax liabilities by reducing the number of shares of common stock issued to them, which the Company refers to as “net share settlement.” Additionally, the Company has generally allowed holders of share options to settle their exercise price by reducing the number of shares of common stock issued to them at the time of exercise by an amount sufficient to cover the exercise price. The net share settlement results in a liability for the Company and a corresponding adjustment to retained earnings (accumulated deficit).
On January 3, 2022, the Company announced a share repurchase program, pursuant to which, the Company was authorized to repurchase (i) up to an aggregate of $1.5 billion of shares of its common stock in order to opportunistically reduce its share count and (ii) up to an aggregate of $1.0 billion of shares of its common stock in order to offset the dilutive impact of share issuances under its equity incentive plans. On February 21, 2023, the AGM board of directors approved a reallocation of the Company’s share repurchase program, pursuant to which, the Company was authorized to repurchase (i) up to an aggregate of $1.0 billion of shares of its common stock in order to opportunistically reduce its share count, a decrease of $0.5 billion of shares from the previously authorized amount and (ii) up to an aggregate of $1.5 billion of shares of its common stock in order to offset the dilutive impact of share issuances under its equity incentive plans, an increase of $0.5 billion of shares from the previously authorized amount.
On February 8, 2024, the AGM board of directors terminated the Company’s prior share repurchase program and approved a new share repurchase program, pursuant to which, the Company is authorized to repurchase up to $3.0 billion of shares of its common stock to opportunistically reduce the Company’s share count or offset the dilutive impact of share issuances under the Company’s equity incentive plans. Shares of common stock may be repurchased from time to time in open market transactions, in privately negotiated transactions, pursuant to a trading plan adopted in accordance with Rule 10b5-1 of the Exchange Act, or otherwise, as well as through reductions of shares that otherwise would have been issued to participants under the Company’s Equity Plan in order to satisfy associated tax obligations. The repurchase program does not obligate the Company to make any repurchases at any specific time. The program is effective until the aggregate repurchase amount that has been approved by the AGM board of directors has been expended and may be suspended, extended, modified or discontinued at any time.
77
APOLLO GLOBAL MANAGEMENT, INC.
NOTES TO CONDENSED CONSOLIDATED FINANCIAL STATEMENTS (UNAUDITED)
The table below outlines the share activity for the six months ended June 30, 2025 and 2024:
| Six months ended June 30, | |||||||||||
| 2025 | 2024 | ||||||||||
Shares of common stock issued in settlement of vested RSUs and options exercised1
|
|||||||||||
Reduction of shares of common stock issued2
|
( |
( |
|||||||||
Shares of common stock purchased related to share issuances and forfeitures3
|
( |
||||||||||
| Issuance of shares of common stock for equity-based awards | |||||||||||
1 The gross value of shares issued was $ | |||||||||||
2 Cash paid for tax liabilities associated with net share settlement was $ | |||||||||||
3 Certain Apollo employees receive a portion of the profit sharing proceeds of certain funds in the form of (a) restricted shares of common stock that they are required to purchase with such proceeds or (b) RSUs, in each case which equity-based awards generally vest over | |||||||||||
During the six months ended June 30, 2025 and 2024, 1,392,000 and 2,987,000 shares of common stock, respectively, were repurchased in open market transactions as part of the publicly announced share repurchase programs discussed above, and such shares were subsequently canceled by the Company. The Company paid $193 million and $335 million for these open market share repurchases during the six months ended June 30, 2025 and 2024, respectively.
During the six months ended June 30, 2025, the Company issued 540,177 shares of common stock in settlement of a deferred consideration obligation. During the three months ended June 30, 2024, the Company issued 742,742 shares of common stock in settlement of a share-based contingent consideration.
Mandatory Convertible Preferred Stock
On August 11, 2023, the Company issued 28,750,000 shares, or $1.4 billion aggregate liquidation preference, of its 6.75 % Series A Mandatory Convertible Preferred Stock (the “Mandatory Convertible Preferred Stock”).
Dividends on the Mandatory Convertible Preferred Stock will be payable on a cumulative basis when, as and if declared by the AGM board of directors, or an authorized committee thereof, at an annual rate of 6.75 % on the liquidation preference of $50.00 per share, and may be paid in cash or, subject to certain limitations, in shares of common stock or, subject to certain limitations, any combination of cash and shares of common stock. If declared, dividends on the Mandatory Convertible Preferred Stock will be payable quarterly on January 31, April 30, July 31 and October 31 of each year, commencing on October 31, 2023, and ending on, and including, July 31, 2026. The first dividend payment on October 31, 2023 was $0.7500 per share of Mandatory Convertible Preferred Stock, with subsequent quarterly cash dividends expected to be $0.8438 per share of Mandatory Convertible Preferred Stock.
Unless converted earlier in accordance with its terms, each share of Mandatory Convertible Preferred Stock will automatically convert on the mandatory conversion date, which is expected to be July 31, 2026, into between 0.5060 shares and 0.6072 shares of common stock, in each case, subject to customary anti-dilution adjustments described in the certificate of designations related to the Mandatory Convertible Preferred Stock (the “Certificate of Designations”). The number of shares of common stock issuable upon conversion will be determined based on the average volume weighted average price per share of common stock over the 20 consecutive trading day period beginning on, and including, the 21st scheduled trading day immediately prior to July 31, 2026.
Holders of shares of Mandatory Convertible Preferred Stock have the option to convert all or any portion of their shares of Mandatory Convertible Preferred Stock at any time. The conversion rate applicable to any early conversion may in certain circumstances be increased to compensate holders of the Mandatory Convertible Preferred Stock for certain unpaid accumulated dividends as described in the Certificate of Designations.
If a Fundamental Change, as defined in the Certificate of Designations, occurs on or prior to July 31, 2026, then holders of the Mandatory Convertible Preferred Stock will be entitled to convert all or any portion of their Mandatory Convertible Preferred
78
APOLLO GLOBAL MANAGEMENT, INC.
NOTES TO CONDENSED CONSOLIDATED FINANCIAL STATEMENTS (UNAUDITED)
Stock at the Fundamental Change Conversion Rate for a specified period of time and to also receive an amount to compensate them for certain unpaid accumulated dividends and any remaining future scheduled dividend payments.
The Mandatory Convertible Preferred Stock is not subject to redemption at the Company’s option.
During the six months ended June 30, 2024, 235 shares of the Mandatory Convertible Preferred Stock were converted at the option of the respective holders. As of June 30, 2025 and December 31, 2024, there were 28,749,765 28,749,765
Warrants
In 2022, the Company issued warrants in a private placement exercisable for up to 12.5 million shares of common stock at an exercise price of $82.80 per share. As of June 30, 2025, warrants exercisable for 7.4 million shares of common stock were vested and exercisable. In April 2025, the Company issued 1,080,041 shares of common stock in relation to a cashless exercise of 2.6 million vested warrants issued in 2022. The remaining warrants exercisable for 2.5 million shares of common stock will become exercisable in the first quarter of 2026. As of June 30, 2025, pursuant to certain anti-dilution provisions, the exercise price for the warrants was adjusted to $82.73 .
In November 2024, the Company issued warrants in a private placement exercisable for up to 2.9 million shares of common stock at an exercise price of $173.51 per share. The warrants are exercisable on the issuance date and each of the first, second, third, fourth, fifth and sixth anniversaries thereof. As of June 30, 2025, warrants exercisable for 0.4 million shares of common stock were vested and exercisable. Each warrant, to the extent exercised, will be settled on a “cashless net exercise basis.” The warrants will expire on the seventh anniversary of the issuance date, with any vested but unexercised warrants being automatically exercised at such time if the trading price of common stock is above the exercise price.
Donor-Advised Fund
In February 2025, the Company established a donor-advised fund (the “Apollo DAF”) as part of its ongoing commitment to philanthropy. The Company issued 1,213,003 shares of common stock in February 2025 to fund the Apollo DAF.
Dividends and Distributions
Outlined below is information regarding quarterly dividends and distributions (in millions, except per share data).
| Dividend Declaration Date | Dividend per Share of Common Stock | Payment Date | Dividend to Common Stockholders | Distribution Equivalents on Participating Securities | |||||||||||||||||||
| February 8, 2024 | $ | February 29, 2024 | $ | $ | |||||||||||||||||||
| May 2, 2024 | May 31, 2024 | ||||||||||||||||||||||
| August 1, 2024 | August 30, 2024 | ||||||||||||||||||||||
| November 5, 2024 | November 29, 2024 | ||||||||||||||||||||||
| Year ended December 31, 2024 | $ | $ | $ | ||||||||||||||||||||
| February 4, 2025 | $ | February 28, 2025 | $ | $ | |||||||||||||||||||
| May 2, 2025 | $ | May 30, 2025 | $ | $ | |||||||||||||||||||
| Six months ended June 30, 2025 | $ | $ | $ | ||||||||||||||||||||
79
APOLLO GLOBAL MANAGEMENT, INC.
NOTES TO CONDENSED CONSOLIDATED FINANCIAL STATEMENTS (UNAUDITED)
Accumulated Other Comprehensive Income (Loss)
| (In millions) | Unrealized investment gains (losses) on AFS securities without a credit allowance | Unrealized investment gains (losses) on AFS securities with a credit allowance | Unrealized gains (losses) on hedging instruments | Remeasurement gains (losses) on future policy benefits related to discount rate | Remeasurement gains (losses) on market risk benefits related to credit risk | Foreign currency translation and other adjustments | Accumulated other comprehensive income (loss) | ||||||||||||||||||||||||||||||||||
| Balance at March 31, 2025 | $ | ( |
$ | ( |
$ | $ | $ | ( |
$ | ( |
$ | ( |
|||||||||||||||||||||||||||||
| Other comprehensive income (loss) before reclassifications | ( |
( |
|||||||||||||||||||||||||||||||||||||||
Less: Reclassification adjustments for gains (losses) realized1
|
( |
( |
( |
||||||||||||||||||||||||||||||||||||||
| Less: Income tax expense (benefit) | ( |
( |
( |
||||||||||||||||||||||||||||||||||||||
| Less: Other comprehensive income (loss) attributable to non-controlling interests, net of tax | ( |
( |
|||||||||||||||||||||||||||||||||||||||
| Balance at June 30, 2025 | $ | ( |
$ | ( |
$ | ( |
$ | $ | ( |
$ | $ | ( |
|||||||||||||||||||||||||||||
1 Recognized in investment related gains (losses) on the condensed consolidated statements of operations.
| |||||||||||||||||||||||||||||||||||||||||
| (In millions) | Unrealized investment gains (losses) on AFS securities without a credit allowance | Unrealized investment gains (losses) on AFS securities with a credit allowance | Unrealized gains (losses) on hedging instruments | Remeasurement gains (losses) on future policy benefits related to discount rate | Remeasurement gains (losses) on market risk benefits related to credit risk | Foreign currency translation and other adjustments | Accumulated other comprehensive income (loss) | ||||||||||||||||||||||||||||||||||
| Balance at March 31, 2024 | $ | ( |
$ | ( |
$ | ( |
$ | $ | ( |
$ | ( |
$ | ( |
||||||||||||||||||||||||||||
| Other comprehensive income (loss) before reclassifications | ( |
( |
( |
||||||||||||||||||||||||||||||||||||||
Less: Reclassification adjustments for gains (losses) realized1
|
( |
||||||||||||||||||||||||||||||||||||||||
| Less: Income tax expense (benefit) | ( |
( |
( |
||||||||||||||||||||||||||||||||||||||
| Less: Other comprehensive income (loss) attributable to non-controlling interests, net of tax | ( |
( |
( |
( |
|||||||||||||||||||||||||||||||||||||
| Balance at June 30, 2024 | $ | ( |
$ | ( |
$ | ( |
$ | $ | $ | ( |
$ | ( |
|||||||||||||||||||||||||||||
1 Recognized in investment related gains (losses) on the condensed consolidated statements of operations.
| |||||||||||||||||||||||||||||||||||||||||
80
APOLLO GLOBAL MANAGEMENT, INC.
NOTES TO CONDENSED CONSOLIDATED FINANCIAL STATEMENTS (UNAUDITED)
| (In millions) | Unrealized investment gains (losses) on AFS securities without a credit allowance | Unrealized investment gains (losses) on AFS securities with a credit allowance | Unrealized gains (losses) on hedging instruments | Remeasurement gains (losses) on future policy benefits related to discount rate | Remeasurement gains (losses) on market risk benefits related to credit risk | Foreign currency translation and other adjustments | Accumulated other comprehensive income (loss) | ||||||||||||||||||||||||||||||||||
| Balance at December 31, 2024 | $ | ( |
$ | ( |
$ | ( |
$ | $ | ( |
$ | ( |
$ | ( |
||||||||||||||||||||||||||||
| Other comprehensive income (loss) before reclassifications | ( |
( |
|||||||||||||||||||||||||||||||||||||||
Less: Reclassification adjustments for gains (losses) realized1
|
( |
( |
( |
||||||||||||||||||||||||||||||||||||||
| Less: Income tax expense (benefit) | ( |
( |
|||||||||||||||||||||||||||||||||||||||
| Less: Other comprehensive income (loss) attributable to non-controlling interests, net of tax | ( |
( |
|||||||||||||||||||||||||||||||||||||||
| Balance at June 30, 2025 | $ | ( |
$ | ( |
$ | ( |
$ | $ | ( |
$ | $ | ( |
|||||||||||||||||||||||||||||
1 Recognized in investment related gains (losses) on the condensed consolidated statements of operations.
|
|||||||||||||||||||||||||||||||||||||||||
| (In millions) | Unrealized investment gains (losses) on AFS securities without a credit allowance | Unrealized investment gains (losses) on AFS securities with a credit allowance | Unrealized gains (losses) on hedging instruments | Remeasurement gains (losses) on future policy benefits related to discount rate | Remeasurement gains (losses) on market risk benefits related to credit risk | Foreign currency translation and other adjustments | Accumulated other comprehensive income (loss) | ||||||||||||||||||||||||||||||||||
| Balance at December 31, 2023 | $ | ( |
$ | ( |
$ | ( |
$ | $ | $ | $ | ( |
||||||||||||||||||||||||||||||
| Other comprehensive income (loss) before reclassifications | ( |
( |
( |
||||||||||||||||||||||||||||||||||||||
Less: Reclassification adjustments for gains (losses) realized1
|
( |
||||||||||||||||||||||||||||||||||||||||
| Less: Income tax expense (benefit) | ( |
( |
( |
||||||||||||||||||||||||||||||||||||||
| Less: Other comprehensive income (loss) attributable to non-controlling interests, net of tax | ( |
( |
( |
( |
|||||||||||||||||||||||||||||||||||||
| Balance at June 30, 2024 | $ | ( |
$ | ( |
$ | ( |
$ | $ | $ | ( |
$ | ( |
|||||||||||||||||||||||||||||
1 Recognized in investment related gains (losses) on the condensed consolidated statements of operations.
| |||||||||||||||||||||||||||||||||||||||||
81
APOLLO GLOBAL MANAGEMENT, INC.
NOTES TO CONDENSED CONSOLIDATED FINANCIAL STATEMENTS (UNAUDITED)
14. Earnings per Share
The following presents basic and diluted net income (loss) per share of common stock computed using the two-class method:
| Basic and Diluted | |||||||||||||||||||||||
| Three months ended June 30, | Six months ended June 30, | ||||||||||||||||||||||
| (In millions, except share and per share amounts) | 2025 | 2024 | 2025 | 2024 | |||||||||||||||||||
| Numerator: | |||||||||||||||||||||||
| Net income (loss) attributable to common stockholders | $ | $ | $ | $ | |||||||||||||||||||
Dividends declared on common stock1
|
( |
( |
( |
( |
|||||||||||||||||||
Dividends on participating securities2
|
( |
( |
( |
( |
|||||||||||||||||||
| Earnings allocable to participating securities | ( |
( |
( |
( |
|||||||||||||||||||
| Undistributed income (loss) attributable to common stockholders: Basic | |||||||||||||||||||||||
| Dilution effect on distributable income attributable to Mandatory Convertible Preferred Stock | |||||||||||||||||||||||
| Undistributed income (loss) attributable to common stockholders: Diluted | $ | $ | $ | $ | |||||||||||||||||||
| Denominator: | |||||||||||||||||||||||
| Weighted average number of shares of common stock outstanding: Basic | |||||||||||||||||||||||
| Dilution effect of Mandatory Convertible Preferred Stock | |||||||||||||||||||||||
| Dilution effect of options | |||||||||||||||||||||||
| Dilution effect of warrants | |||||||||||||||||||||||
| Weighted average number of shares of common stock outstanding: Diluted | |||||||||||||||||||||||
| Net income (loss) per share of common stock: Basic | |||||||||||||||||||||||
| Distributed income | $ | $ | $ | $ | |||||||||||||||||||
| Undistributed income (loss) | |||||||||||||||||||||||
| Net income (loss) per share of common stock: Basic | $ | $ | $ | $ | |||||||||||||||||||
| Net income (loss) per share of common stock: Diluted | |||||||||||||||||||||||
| Distributed income | $ | $ | $ | $ | |||||||||||||||||||
| Undistributed income (loss) | |||||||||||||||||||||||
| Net income (loss) per share of common stock: Diluted | $ | $ | $ | $ | |||||||||||||||||||
1 See note 13 for information regarding quarterly dividends.
| |||||||||||||||||||||||
2 Participating securities consist of vested and unvested RSUs that have rights to dividends and unvested restricted shares.
| |||||||||||||||||||||||
The Company has granted RSUs that provide the right to receive, subject to vesting during continued employment, shares of common stock pursuant to the Equity Plan.
Any dividend equivalent paid to an employee on RSUs will not be returned to the Company upon forfeiture of the award by the employee. Vested and unvested RSUs that are entitled to non-forfeitable dividend equivalents qualify as participating securities and are included in the Company’s basic and diluted earnings per share computations using the two-class method. The holder of an RSU participating security would have a contractual obligation to share in the losses of the entity if the holder is obligated to fund the losses of the issuing entity or if the contractual principal or mandatory redemption amount of the participating security is reduced as a result of losses incurred by the issuing entity. The RSU participating securities do not have a mandatory redemption amount and the holders of the participating securities are not obligated to fund losses; therefore, neither the vested RSUs nor the unvested RSUs are subject to any contractual obligation to share in losses of the Company.
82
APOLLO GLOBAL MANAGEMENT, INC.
NOTES TO CONDENSED CONSOLIDATED FINANCIAL STATEMENTS (UNAUDITED)
The following table summarizes the anti-dilutive securities:
| Three months ended June 30, | Six months ended June 30, | ||||||||||||||||||||||
| 2025 | 2024 | 2025 | 2024 | ||||||||||||||||||||
| Weighted average unvested RSUs | |||||||||||||||||||||||
| Weighted average unexercised warrants | |||||||||||||||||||||||
| Weighted average Mandatory Convertible Preferred Stock | |||||||||||||||||||||||
| Weighted average unvested restricted shares | |||||||||||||||||||||||
15. Related Parties
Asset Management
Due from/ to related parties
Due from/ to related parties includes:
•unpaid management fees, transaction and advisory fees and reimbursable expenses from the funds Apollo manages and their portfolio companies;
•reimbursable payments for certain operating costs incurred by these funds as well as their related parties; and
•other related party amounts arising from transactions, including loans to employees and periodic sales of ownership interests in funds managed by Apollo.
Due from related parties and Due to related parties consisted of the following as of June 30, 2025 and December 31, 2024:
| (In millions) | June 30, 2025 | December 31, 2024 | |||||||||
| Due from Related Parties: | |||||||||||
Due from funds1
|
$ | $ | |||||||||
| Due from portfolio companies | |||||||||||
| Due from employees and former employees | |||||||||||
| Total Due from Related Parties | $ | $ | |||||||||
| Due to Related Parties: | |||||||||||
| Due to Former Managing Partners and Contributing Partners | $ | $ | |||||||||
| Due to funds | |||||||||||
| Due to portfolio companies | |||||||||||
| Total Due to Related Parties | $ | $ | |||||||||
1 Includes $ | |||||||||||
Tax Receivable Agreement
All Apollo Operating Group entities have made, or will make, an election under Section 754 of the U.S. Internal Revenue Code (“IRC”). The election results in an increase to the tax basis of underlying assets which will reduce the amount of gain and associated tax that AGM and its subsidiaries will otherwise be required to pay in the future.
The tax receivable agreement (“TRA”) provides for payment to the Former Managing Partners and Contributing Partners of 85 % of the amount of cash tax savings, if any, in U.S. federal, state, local and foreign income taxes the Company realizes as a result of the increases in tax basis of assets resulting from exchanges of AOG Units for Class A shares that have occurred in prior years. AGM and its subsidiaries retain the benefit of the remaining 15 % of actual cash tax savings. If the Company does not make the required annual payment on a timely basis as outlined in the tax receivable agreement, interest is accrued on the balance until the payment date.
Following the closing of the Mergers, as the Former Managing Partners and Contributing Partners no longer own AOG Units, there were no new exchanges subject to the TRA.
83
APOLLO GLOBAL MANAGEMENT, INC.
NOTES TO CONDENSED CONSOLIDATED FINANCIAL STATEMENTS (UNAUDITED)
Due from Employees and Former Employees
As of June 30, 2025 and December 31, 2024, due from related parties includes various amounts due to Apollo, including employee loans and return of profit-sharing distributions. As of June 30, 2025 and December 31, 2024, the balance includes interest-bearing employee loans receivable of $10 million and $4 million, respectively. The outstanding principal amount of the loans as well as all accrued and unpaid interest is required to be repaid on a specified date, either during the relevant employee’s tenure or at the date of the relevant employee’s resignation, in accordance with the contractual terms of each respective loan arrangement.
The receivable from certain employees and former employees includes an amount for the potential return of profit-sharing distributions that would be due if certain funds were liquidated of $96 million and $94 million at June 30, 2025 and December 31, 2024, respectively.
Indemnity
Certain of the performance revenues Apollo earns from funds may be subject to repayment by its subsidiaries that are general partners of the funds in the event that certain specified return thresholds are not ultimately achieved. The Former Managing Partners, Contributing Partners and certain other investment professionals have personally guaranteed, subject to certain limitations, the obligations of these subsidiaries in respect of this obligation. Such guarantees are several and not joint and are limited to a particular individual’s distributions. Apollo has agreed to indemnify each of the Former Managing Partners and certain Contributing Partners against all amounts that they pay pursuant to any of these personal guarantees in favor of certain funds that it manages (including costs and expenses related to investigating the basis for or objecting to any claims made in respect of the guarantees) for all interests that the Former Managing Partners and Contributing Partners contributed or sold to the Apollo Operating Group.
Apollo recorded an indemnification liability of $0.4 million and $0.4 million as of June 30, 2025 and December 31, 2024, respectively.
Due to Related Parties
Based upon an assumed liquidation of certain of the funds Apollo manages, it has recorded a general partner obligation to return previously distributed performance allocations, which represents amounts due to certain funds. The obligation is recognized based upon an assumed liquidation of a fund’s net assets as of the reporting date. The actual determination and any required payment would not take place until the final disposition of a fund’s investments based on the contractual termination of the fund or as otherwise set forth in the respective governing document of the fund.
Apollo recorded general partner obligations to return previously distributed performance allocations related to certain funds of $201 million and $213 million as of June 30, 2025 and December 31, 2024, respectively.
Athora
Apollo, through ISGI, provides investment advisory services to certain portfolio companies of funds managed by Apollo and Athora, a strategic liabilities platform that acquires or reinsures blocks of insurance business in the German and broader European life insurance market (collectively, the “Athora Accounts”). AAM and its subsidiaries had equity commitments outstanding to Athora of up to $83 million as of June 30, 2025, subject to certain conditions. On July 3, 2025, AAM made a conditional commitment to invest, or cause one or more of its affiliates to invest, in Athora for up to an additional $2.0 billion, in connection with Athora’s agreement to acquire a UK insurer (the “Athora transaction”). The Athora transaction remains subject to closing conditions, including receipt of regulatory approvals. The amount ultimately funded pursuant to the conditional commitment, and sources of funding, are subject to change as a result of an anticipated capital raise by Athora between signing and closing of the Athora transaction. See “—Athora” in the Retirement Services section below for details on Athene’s conditional commitments to Athora.
Athora Sub-Advised
Apollo provides sub-advisory services with respect to a portion of the assets in certain portfolio companies of funds managed by Apollo and the Athora Accounts. Apollo broadly refers to “Athora Sub-Advised” assets as those assets in the Athora
84
APOLLO GLOBAL MANAGEMENT, INC.
NOTES TO CONDENSED CONSOLIDATED FINANCIAL STATEMENTS (UNAUDITED)
Accounts which Apollo explicitly sub-advises as well as those assets in the Athora Accounts which are invested directly in funds and investment vehicles Apollo manages.
Apollo earns a base management fee on the aggregate market value of substantially all of the investment accounts of or relating to Athora and also a sub-advisory fee on the Athora Sub-Advised assets, which varies depending on the specific asset class.
See “—Athora” in the Retirement Services section below for further details on Athene’s relationship with Athora.
Regulated Entities and Affiliated Service Providers
Apollo Global Securities, LLC (“AGS”) is a registered broker-dealer with the SEC and is a member of the Financial Industry Regulatory Authority, subject to the minimum net capital requirements of the SEC. AGS was in compliance with these requirements as of June 30, 2025. From time to time AGS, as well as other Apollo affiliates, provide services to related parties of Apollo, including Apollo funds and their portfolio companies, whereby the Company or its affiliates earn fees for providing such services.
Griffin Capital Securities, LLC (“GCS”) is a registered broker-dealer with the SEC and is a member of the Financial Industry Regulatory Authority, subject to the minimum net capital requirements of the SEC. GCS was in compliance with these requirements as of June 30, 2025.
Retirement Services
AAA
Athene consolidates AAA as a VIE and AAA holds the majority of Athene’s alternative investment portfolio. Apollo established AAA to provide a single vehicle through which investors may participate in a portfolio of alternative investments, including those managed by Apollo. Additionally, the Company believes AAA enhances its ability to increase alternative assets under management by raising capital from third parties, which allows it to achieve greater scale and diversification for alternatives.
Athora
Athene had an amended and restated cooperation agreement with Athora, which was terminated effective August 5, 2025. Pursuant to this agreement, among other things, (1) for a period of 30 days from the receipt of notice of a cession, Athene had the right of first refusal to reinsure (i) up to 50 % of the liabilities ceded from Athora’s reinsurance subsidiaries to Athora Life Re Ltd. and (ii) up to 20 % of the liabilities ceded from a third party to any of Athora’s insurance subsidiaries, subject to a limitation in the aggregate of 20 % of Athora’s liabilities, and (2) Athora agreed to cause its insurance subsidiaries to consider the purchase of certain funding agreements and/or other spread instruments issued by Athene’s insurance subsidiaries, subject to a limitation that the fair market value of such funding agreements purchased by any of Athora’s insurance subsidiaries may generally not exceed 3 % of the fair market value of such subsidiary’s total assets. As of June 30, 2025, Athene had not exercised its right of first refusal to reinsure liabilities ceded to Athora’s insurance or reinsurance subsidiaries.
The following table summarizes Athene’s investments in Athora:
| (In millions) | June 30, 2025 | December 31, 2024 | |||||||||
| Investment fund | $ | $ | |||||||||
| Non-redeemable preferred equity and corporate debt securities | |||||||||||
| Total investment in Athora | $ | $ | |||||||||
Additionally, as of June 30, 2025 and December 31, 2024, Athene had $65 million and $57 million, respectively, of funding agreements outstanding to Athora. Athene also had commitments to make additional investments in Athora of $277 million as of June 30, 2025. On July 3, 2025, Athene made a conditional commitment to invest, or cause one or more of its affiliates to invest, in Athora for up to an additional $2.5 billion, in connection with the Athora transaction. See “—Athora” in the Asset Management section above for further details on the Athora transaction.
85
APOLLO GLOBAL MANAGEMENT, INC.
NOTES TO CONDENSED CONSOLIDATED FINANCIAL STATEMENTS (UNAUDITED)
Atlas
Athene has an equity investment in Atlas, an asset-backed specialty lender, through its investment in AAA and, as of June 30, 2025 and December 31, 2024, Athene held $4.6 billion and $3.2 billion, respectively, of AFS securities issued by Atlas or its affiliates. Athene also held $724 million of reverse repurchase agreements issued by Atlas as of December 31, 2024, which were settled during the six months ended June 30, 2025. As of June 30, 2025, Athene had commitments to make additional investments in Atlas of $1.4 billion. Additionally, see note 16 for further information on assurance letters issued in support of Atlas.
Catalina
Athene has a strategic modco reinsurance agreement with certain affiliates of Catalina Holdings (Bermuda) Ltd. (together with its subsidiaries, “Catalina”) to cede certain inforce funding agreements. Athene elected the fair value option on this agreement and had a liability of $235 million and $221 million as of June 30, 2025 and December 31, 2024, respectively, which is included in other liabilities on the condensed consolidated statements of financial condition. Athene also has a modco reinsurance agreement with Catalina to cede a quota share of retail deferred annuity products. As of June 30, 2025 and December 31, 2024, Athene had a reinsurance recoverable balance of $5.3 billion and $4.3 billion, respectively, related to this agreement.
Skylign
Athene has investments in Skylign Aviation Holdings, LP (“Skylign”), a leading aviation finance group focused on aviation lending and leasing, both directly through notes issued by PK AirFinance, a subsidiary of Skylign, and indirectly through AAA. As of June 30, 2025 and December 31, 2024, Athene directly held $1.5 billion and $1.6 billion, respectively, of Skylign senior notes, which are included in investments in related parties on the condensed consolidated statements of financial condition. Athene had commitments to make additional investments in Skylign of $41 million as of June 30, 2025.
Venerable
VA Capital Company LLC (“VA Capital”) is owned by a consortium of investors, led by affiliates of Apollo, Crestview Partners III Management, LLC and Reverence Capital Partners L.P., and is the parent of Venerable. Athene has a minority equity investment in VA Capital, which was $198 million and $178 million as of June 30, 2025 and December 31, 2024, respectively, that is included in investments in related parties on the condensed consolidated statements of financial condition and accounted for as an equity method investment. Athene had commitments to make additional investments in Venerable of $169 million as of June 30, 2025.
Additionally, Athene consolidates AP Violet ATH Holdings, L.P. and its investment primarily represents an interest in VA Capital, which was $123 million and $106 million as of June 30, 2025 and December 31, 2024, respectively.
Athene also has coinsurance and modco agreements with VIAC, which is a subsidiary of Venerable. VIAC is a related party due to Athene’s investment in VA Capital. Athene also has term loans receivable from Venerable due in 2033, which are included in investments in related parties on the condensed consolidated statements of financial condition. The loans are held at fair value and were $339 million and $331 million as of June 30, 2025 and December 31, 2024, respectively. While management viewed the overall transactions with Venerable as favorable to Athene, the stated interest rate of 6.257 % on the initial term loan to Venerable represented a below-market interest rate, and management considered such rate as part of its evaluation and pricing of the reinsurance transactions.
Wheels
Athene invests in Wheels Inc. (“Wheels”) indirectly through its investment in AAA. As of June 30, 2025 and December 31, 2024, Athene also directly holds $1.0 billion and $1.0 billion, respectively, of AFS securities issued by Wheels, which are included in investments in related parties on the condensed consolidated statements of financial condition. Athene also had commitments to make additional investments in Wheels of $32 million as of June 30, 2025.
86
APOLLO GLOBAL MANAGEMENT, INC.
NOTES TO CONDENSED CONSOLIDATED FINANCIAL STATEMENTS (UNAUDITED)
Apollo/Athene Dedicated Investment Programs
Athene’s subsidiary, ACRA 1 is partially owned by ADIP I, a series of funds managed by Apollo. Athene’s subsidiary, ALRe, currently directly holds 37 % of the economic interests in ACRA 1 and all of ACRA 1’s voting interests, with ADIP I holding the remaining 63 % of the economic interests. Athene’s subsidiary, ACRA 2, is partially owned by ADIP II, a fund managed by Apollo. ADIP II owns 63 % of the economic interests in ACRA 2, with ALRe directly owning the remaining 37 % of the economic interests. ALRe holds all of ACRA 2’s voting interests.
Athene received capital contributions and paid distributions relating to ACRA of the following:
| Three months ended June 30, | Six months ended June 30, | ||||||||||||||||||||||
| (In millions) | 2025 | 2024 | 2025 | 2024 | |||||||||||||||||||
| Contributions from ADIP | $ | $ | $ | $ | |||||||||||||||||||
| Distributions to ADIP | ( |
( |
( |
( |
|||||||||||||||||||
As of June 30, 2025 and December 31, 2024, Athene held investments in ADIP of $236 million and $238 million, respectively, which are accounted for as equity method investments and included in investments in related parties on the condensed consolidated statements of financial condition. As of June 30, 2025, Athene had commitments to make additional investments in ADIP of $328 million.
16. Commitments and Contingencies
Investment Commitments
The Company has unfunded capital commitments of $511 million as of June 30, 2025 related to the funds it manages. Separately, Athene had commitments to make investments, inclusive of related party commitments discussed previously and those of its consolidated VIEs, of $33.3 billion as of June 30, 2025. Athene’s commitments primarily include capital contributions to investment funds and mortgage loan commitments. The Company expects most of the current commitments will be invested over the next five years; however, these commitments could become due any time upon counterparty request.
Contingent Obligations
Performance allocations with respect to certain funds are subject to reversal in the event of future losses to the extent of the cumulative revenues recognized in income to date. If all of the existing investments became worthless, the amount of cumulative revenues that have been recognized by Apollo through June 30, 2025 and that could be reversed approximates $5.6 billion. Performance allocations are affected by changes in the fair values of the underlying investments in the funds that Apollo manages. Valuations, on an unrealized basis, can be significantly affected by a variety of external factors including, but not limited to, bond yields and industry trading multiples. Movements in these items can affect valuations quarter to quarter even if the underlying business fundamentals remain stable. Management views the possibility of all of the investments becoming worthless as remote.
Additionally, at the end of the life of certain funds, Apollo may be obligated as general partner, to repay the funds’ performance allocations received in excess of what was ultimately earned. This obligation amount, if any, will depend on final realized values of investments at the end of the life of each fund or as otherwise set forth in the partnership agreement of the fund.
Certain funds may not generate performance allocations as a result of unrealized and realized losses that are recognized in the current and prior reporting periods. In certain cases, performance allocations will not be generated until additional unrealized and realized gains occur. Any appreciation would first cover the deductions for invested capital, unreturned organizational expenses, operating expenses, management fees and priority returns based on the terms of the respective fund agreements.
One of Apollo’s subsidiaries, AGS, provides underwriting commitments in connection with securities offerings of related parties of Apollo, including portfolio companies of the funds Apollo manages, as well as third parties. As of June 30, 2025, there were no open underwriting commitments.
AGS has entered into an arrangement with certain funds managed by State Street Global Advisors (“SSG”) to provide firm bids for certain securities sold to SSG managed funds. These firm bids are at market prices determined by AGS on an intra-daily
87
APOLLO GLOBAL MANAGEMENT, INC.
NOTES TO CONDENSED CONSOLIDATED FINANCIAL STATEMENTS (UNAUDITED)
basis, which if accepted by SSG, would obligate AGS to purchase the securities at such prices. The total obligation of AGS to provide these firm bids is limited to 25 % of the prior day's end-of-day net asset value of the securities held by SSG that were originated from AGS, with an additional weekly cap set at 50 % of the net asset value from five trading days prior.
The Company, along with a third-party institutional investor, has committed to provide financing to a consolidated VIE that invests across Apollo’s capital markets platform (such VIE, the “Apollo Capital Markets Partnership”). Pursuant to these arrangements, the Company has committed equity financing to the Apollo Capital Markets Partnership. The Apollo Capital Markets Partnership also has a revolving credit facility with Sumitomo Mitsui Banking Corporation, as lead arranger, administrative agent and letter of credit issuer, Mizuho Bank Ltd., and other lenders party thereto, pursuant to which it may borrow up to $2.5 billion. The revolving credit facility, which has a final maturity date of October 16, 2026, is non-recourse to the Company, except that the Company provided customary comfort letters with respect to its capital contributions to the Apollo Capital Markets Partnership. As of June 30, 2025, the Apollo Capital Markets Partnership had funded commitments of $621 million, on a net basis, to transactions across Apollo’s capital markets platform, all of which were funded through the revolving credit facility and other asset-based financing. No capital had been funded by the Company to the Apollo Capital Markets Partnership pursuant to its commitment.
Whether the commitments of the Apollo Capital Markets Partnership are actually funded, in whole or in part, depends on the contractual terms of such commitments, including the satisfaction or waiver of any conditions to closing or funding. It is expected that between the time the Apollo Capital Markets Partnership makes a commitment and funding of such commitment, efforts will be made to syndicate such commitment to, among others, third parties, which should reduce its risk when committing to certain transactions. The Apollo Capital Markets Partnership may also, with respect to a particular transaction, enter into other arrangements with third parties which reduce its commitment risk.
In connection with the acquisition of Stone Tower in 2012, Apollo agreed to pay its former owners a specified percentage of future performance revenues earned from certain of its funds, CLOs, and strategic investment accounts. This obligation was determined based on the present value of estimated future performance revenue payments and is recorded in other liabilities. The fair value of the remaining contingent obligation was $61 million and $67 million as of June 30, 2025 and December 31, 2024, respectively. This contingent consideration obligation is remeasured to fair value at each reporting period until the obligations are satisfied. The changes in the fair value of the Stone Tower contingent consideration obligation is reflected in profit sharing expense within compensation and benefits in the condensed consolidated statements of operations.
Funding Agreements
Athene is a member of the Federal Home Loan Bank of Des Moines (“FHLB”) and, through its membership, has issued funding agreements to the FHLB in exchange for cash advances. As of June 30, 2025 and December 31, 2024, Athene had $21.0 billion and $15.6 billion, respectively, of FHLB funding agreements outstanding. Athene is required to provide collateral in excess of the funding agreement amounts outstanding, considering any discounts to the securities posted and prepayment penalties.
Athene has a FABN program, which allows Athene Global Funding, a special purpose, unaffiliated statutory trust, to offer its senior secured medium-term notes. Athene Global Funding uses the net proceeds from each sale to purchase one or more funding agreements from Athene. As of June 30, 2025 and December 31, 2024, Athene had $30.4 billion and $24.1 billion, respectively, of FABN funding agreements outstanding. Athene had $5.0 billion of board-authorized FABN capacity remaining as of June 30, 2025.
Athene also issues secured and other funding agreements. Secured funding agreements issued under Athene’s funding agreement backed repurchase agreement (“FABR”) programs involve special-purpose, unaffiliated entities entering into repurchase agreements with a third party, the proceeds of which are used by the special-purpose entities to purchase funding agreements from Athene. As of June 30, 2025 and December 31, 2024, Athene had $23.2 billion and $14.8 billion, respectively, of secured and other funding agreements outstanding, of which $18.0 billion and $12.0 billion were issued under the FABR program, respectively, and $5.2 billion and $2.8 billion were direct funding agreements, respectively.
88
APOLLO GLOBAL MANAGEMENT, INC.
NOTES TO CONDENSED CONSOLIDATED FINANCIAL STATEMENTS (UNAUDITED)
Pledged Assets and Funds in Trust (Restricted Assets)
Athene’s restricted investments and cash balances included on the condensed consolidated statements of financial condition are as follows:
| (In millions) | June 30, 2025 | December 31, 2024 | |||||||||
| AFS securities | $ | $ | |||||||||
| Trading securities | |||||||||||
| Equity securities | |||||||||||
| Mortgage loans | |||||||||||
| Investment funds | |||||||||||
| Derivative assets | |||||||||||
| Short-term investments | |||||||||||
| Other investments | |||||||||||
| Restricted cash and cash equivalents | |||||||||||
| Total restricted assets | $ | $ | |||||||||
The restricted assets are primarily related to reinsurance trusts established in accordance with coinsurance agreements and the FHLB and secured funding agreements described above.
Letters of Credit
Athene has undrawn letters of credit totaling $1.1 billion as of June 30, 2025. These letters of credit were issued for Athene’s reinsurance program and have expirations through June 19, 2028.
Atlas
In connection with the Company and CS’s previously announced transaction, whereby Atlas acquired certain assets of the CS Securitized Products Group, two subsidiaries of the Company have each issued an assurance letter to CS to guarantee the full five year deferred purchase obligation of Atlas in the amount of $3.3 billion. In March 2024, in connection with Atlas concluding its investment management agreement with CS, the deferred purchase obligation amount was reduced to $2.5 billion. In addition, certain strategic investors have made equity commitments to Atlas which therefore obligates these investors for a portion of the deferred purchase obligation. The Company’s guarantee is not probable of payment, therefore, there is no liability on the Company’s condensed consolidated financial statements.
Litigation and Regulatory Matters
The Company is party to various legal actions arising from time to time in the ordinary course of business, including claims and lawsuits, arbitrations, reviews, investigations or proceedings by governmental and self-regulatory agencies regarding the Company’s business.
On December 21, 2017, several entities referred to collectively as “Harbinger” commenced an action in New York Supreme Court captioned Harbinger Capital Partners II LP et al. v. Apollo Global Management LLC, et al. (No. 657515/2017). The complaint named as defendants AAM, and funds managed by Apollo that invested in SkyTerra Communications, Inc. (“SkyTerra”), among others. The complaint alleged that during the period of Harbinger’s various equity and debt investments in SkyTerra from 2004 to 2010, the defendants concealed from Harbinger material defects in SkyTerra technology. The complaint further alleged that Harbinger would not have made investments in SkyTerra totaling approximately $1.9 billion had it known of the defects, and that the public disclosure of these defects ultimately led to SkyTerra filing for bankruptcy in 2012 (after it had been renamed LightSquared). The complaint sought $1.9 billion in damages, as well as punitive damages, interest, costs, and fees. On June 12, 2019, Harbinger voluntarily discontinued the state action without prejudice. On June 8, 2020, Harbinger refiled its litigation in New York Supreme Court, captioned Harbinger Capital Partners II, LP et al. v. Apollo Global Management, LLC et al. (No. 652342/2020). The complaint added eight new defendants and three new claims relating to Harbinger’s contention that the new defendants induced Harbinger to buy CCTV One Four Holdings, LLC (“CCTV”) to support SkyTerra’s network even though they allegedly knew that the network had material defects. On November 23, 2020, Defendants filed in bankruptcy court a motion to reopen LightSquared’s bankruptcy proceedings, and on November 24, 2020, filed in the state court a motion to stay the state court proceedings pending a ruling by the bankruptcy court on the bankruptcy
89
APOLLO GLOBAL MANAGEMENT, INC.
NOTES TO CONDENSED CONSOLIDATED FINANCIAL STATEMENTS (UNAUDITED)
motion. On February 1, 2021, the bankruptcy court denied the bankruptcy motion. Defendants filed their motions to dismiss the New York Supreme Court action on March 31, 2021, which were granted in part and denied in part on May 23, 2023. The court granted in full the Defendants’ motions to dismiss Harbinger’s complaint as time-barred and denied as moot the Defendants’ motion to dismiss the complaint for failure to state a claim. On March 18, 2025, the New York Supreme Court Appellate Division, First Department affirmed the court’s ruling. On April 17, 2025, plaintiffs filed a motion for re-argument or, in the alternative, leave to appeal to the Court of Appeals. On July 24, 2025, the First Department denied Harbinger’s motion for re-argument or, in the alternative, leave to appeal to the Court of Appeals. Apollo believes the claims in this action are without merit. No reasonable estimate of possible loss, if any, can be made at this time.
On August 4, 2020, a putative class action complaint was filed in the United States District Court for the District of Nevada against PlayAGS Inc. (“PlayAGS”), all of the members of PlayAGS’s board of directors (including three directors who are affiliated with Apollo), certain underwriters of PlayAGS (including Apollo Global Securities, LLC), as well as AAM, Apollo Investment Fund VIII, L.P., Apollo Gaming Holdings, L.P., and Apollo Gaming Voteco, LLC (these last four parties, together, the “Apollo Defendants”). The complaint asserted claims against all defendants arising under the Securities Act of 1933 in connection with certain secondary offerings of PlayAGS stock conducted in August 2018 and March 2019, alleging that the registration statements issued in connection with those offerings did not fully disclose certain business challenges facing PlayAGS. The complaint further asserted a control person claim under Section 20(a) of the Exchange Act against the Apollo Defendants and the director defendants (including the directors affiliated with Apollo), alleging such defendants were responsible for certain misstatements and omissions by PlayAGS about its business. On December 2, 2022, the Court dismissed all claims against the underwriters (including Apollo Global Securities, LLC) and the Apollo Defendants, but allowed a claim against PlayAGS and two of PlayAGS’s executives to proceed. On February 13, 2024, the Court dismissed the entire case against all defendants, with prejudice, and instructed the clerk of the court to close the case. On March 27, 2025, the U.S. Court of Appeals for the Ninth Circuit affirmed, in full, the District Court’s dismissal of claims against all defendants. On May 9, 2025, plaintiffs filed a petition for rehearing en banc. On June 6, 2025, the panel unanimously voted to deny the petition for rehearing en banc. Apollo believes the claims in this action are without merit. No reasonable estimate of possible loss, if any, can be made at this time.
On August 17, 2023, a purported stockholder of AGM filed a shareholder derivative complaint (the “Original Complaint”) in the Court of Chancery of the State of Delaware against current AGM directors Marc Rowan, Scott Kleinman, James Zelter, Alvin Krongard, Michael Ducey, and Pauline Richards, Apollo Former Managing Partners Leon Black and Joshua Harris, and, as a nominal defendant, AGM. The action is captioned Anguilla Social Security Board vs. Black et al., C.A. No. 2023-0846-JTL and challenges the $570 million payments being made to the Former Managing Partners and Contributing Partners in connection with the elimination of the Up-C structure that was in place prior to Apollo’s merger with Athene. As previously disclosed in Apollo’s SEC filings, this purported stockholder previously had sought and received documents relating to the transaction pursuant to Section 220 of the Delaware General Corporation Law. The Original Complaint alleged that the challenged payments amount to corporate waste, that the Former Managing Partners and Contributing Partners received payments in connection with the Corporate Recapitalization that exceed fair value and therefore breached their fiduciary duties, and that the independent conflicts committee of the AAM board of directors (which then consisted of Mr. Krongard, Mr. Ducey, and Ms. Richards) that negotiated the elimination of the TRA breached their fiduciary duties. The Original Complaint alleged that pre-suit demand was futile because a majority of AGM’s board is either not independent from the Former Managing Partners or face a substantial likelihood of liability in light of the challenges to the transaction. The Original Complaint sought, among other things, declaratory relief, unspecified monetary damages, interest, restitution, disgorgement, injunctive relief, costs, and attorneys’ fees. On November 16, 2023, the defendants moved to dismiss the Original Complaint on the basis that, among other things, the plaintiff failed to make a pre-suit demand on the Apollo board of directors. On February 9, 2024, the plaintiff filed an amended complaint (the “Amended Complaint”) that adds new factual allegations but names the same defendants, asserts the same causes of action, and seeks the same relief as the Original Complaint. The Amended Complaint alleges that pre-suit demand was futile for the same reasons alleged in the Original Complaint. On April 25, 2024, the defendants moved to dismiss the Amended Complaint. On September 20, 2024, the Court of Chancery denied the defendants’ motion to dismiss. AGM and the defendants filed answers to the Amended Complaint on November 25, 2024. On October 28, 2024, the AGM board of directors adopted resolutions forming a Special Litigation Committee (the “SLC”) comprising directors whom the board determined to be independent and disinterested. The AGM board of directors delegated to the SLC, among other things, the full and exclusive power and authority of the board to investigate, review and evaluate the facts and circumstances asserted in the litigation and determine whether pursuing the litigation is in the best interests of AGM and its stockholders. Pursuant to an order of the court, all proceedings in the litigation are stayed until October 7, 2025, to allow the SLC to complete its investigation. No reasonable estimate of possible loss, if any, can be made at this time.
90
APOLLO GLOBAL MANAGEMENT, INC.
NOTES TO CONDENSED CONSOLIDATED FINANCIAL STATEMENTS (UNAUDITED)
17. Segments
The Company conducts its business through three reportable segments: (i) Asset Management, (ii) Retirement Services and (iii) Principal Investing. Segment information is utilized by the Company’s chief operating decision maker (“CODM”) to assess performance and to allocate resources. AGM’s CEO is the CODM, who is also solely responsible for decisions related to the allocation of resources on a company-wide basis.
For each segment, the CODM uses the key measure of Segment Income to allocate resources (including employees, financial or capital resources) to that segment in the annual budget and forecasting process. The performance is measured by the Company’s chief operating decision maker on an unconsolidated basis because the chief operating decision maker makes operating decisions and assesses the performance of each of the Company’s business segments based on financial and operating metrics and data that exclude the effects of consolidation of any of the affiliated funds.
Segment Income
Segment Income is the key performance measure used by management in evaluating the performance of the asset management, retirement services, and principal investing segments. Management uses Segment Income to make key operating decisions such as the following:
•decisions related to the allocation of resources such as staffing decisions, including hiring and locations for deployment of the new hires;
•decisions related to capital deployment such as providing capital to facilitate growth for the business and/or to facilitate expansion into new businesses;
•decisions related to expenses, such as determining annual discretionary bonuses and equity-based compensation awards to its employees. With respect to compensation, management seeks to align the interests of certain professionals and selected other individuals with those of the investors in the funds and those of Apollo’s stockholders by providing such individuals a profit sharing interest in the performance fees earned in relation to the funds. To achieve that objective, a certain amount of compensation is based on Apollo’s performance and growth for the year; and
•decisions related to the amount of earnings available for dividends to common stockholders and holders of equity-based awards that participate in dividends.
Segment Income is a measure of profitability and has certain limitations in that it does not take into account certain items included under U.S. GAAP. Segment Income is the sum of (i) Fee Related Earnings, (ii) Spread Related Earnings and (iii) Principal Investing Income. Segment Income excludes the effects of the consolidation of any of the related funds, interest and other financing costs related to AGM not attributable to any specific segment, taxes and related payables, transaction-related charges and other non-operating expenses. Transaction-related charges includes equity-based compensation charges, the amortization of intangible assets, contingent consideration, and certain other charges associated with acquisitions, and restructuring charges. Non-operating expenses includes certain charitable contributions and other non-operating expenses. In addition, Segment Income excludes non-cash revenue and expense related to equity awards granted by unconsolidated related parties to employees of the Company, compensation and administrative related expense reimbursements, as well as the assets, liabilities and operating results of the funds and VIEs that are included in the condensed consolidated financial statements.
Segment Income may not be comparable to similarly titled measures used by other companies and is not a measure of performance calculated in accordance with U.S. GAAP. We use Segment Income as a measure of operating performance, not as a measure of liquidity. Segment Income should not be considered in isolation or as a substitute for net income or other income data prepared in accordance with U.S. GAAP. The use of Segment Income without consideration of related U.S. GAAP
91
APOLLO GLOBAL MANAGEMENT, INC.
NOTES TO CONDENSED CONSOLIDATED FINANCIAL STATEMENTS (UNAUDITED)
measures is not adequate due to the adjustments described above. Management compensates for these limitations by using Segment Income as a supplemental measure to U.S. GAAP results, to provide a more complete understanding of our performance as management measures it. A reconciliation of Segment Income to its most directly comparable U.S. GAAP measure of income (loss) before income tax provision can be found in this footnote.
Fee Related Earnings
Fee Related Earnings (“FRE”) is a component of Segment Income that is used to assess the performance of the Asset Management segment. FRE is the sum of (i) management fees, (ii) capital solutions and other related fees, (iii) fee-related performance fees from indefinite term vehicles, that are measured and received on a recurring basis and not dependent on realization events of the underlying investments, excluding performance fees from Athene and performance fees from origination platforms dependent on capital appreciation, and (iv) other income, net, less (a) fee-related compensation, excluding equity-based compensation, (b) non-compensation expenses incurred in the normal course of business, (c) placement fees and (d) non-controlling interests in the management companies of certain funds the Company manages.
Spread Related Earnings
Spread Related Earnings (“SRE”) is a component of Segment Income that is used to assess the performance of the Retirement Services segment, excluding certain market volatility, which consists of investment gains (losses), net of offsets, and non-operating change in insurance liabilities and related derivatives, and certain expenses related to integration, restructuring, equity-based compensation, and other expenses. For the Retirement Services segment, SRE equals the sum of (i) the net investment earnings on Athene’s net invested assets and (ii) management fees received on business managed for others, less (x) cost of funds, (y) operating expenses excluding equity-based compensation and (z) financing costs, including interest expense and preferred dividends, if any, paid to Athene preferred stockholders.
Principal Investing Income
Principal Investing Income (“PII”) is a component of Segment Income that is used to assess the performance of the Principal Investing segment. For the Principal Investing segment, PII is the sum of (i) realized performance fees, including certain realizations received in the form of equity, and (ii) realized investment income, less (x) realized principal investing compensation expense, excluding expense related to equity-based compensation, and (y) certain corporate compensation and non-compensation expenses.
92
APOLLO GLOBAL MANAGEMENT, INC.
NOTES TO CONDENSED CONSOLIDATED FINANCIAL STATEMENTS (UNAUDITED)
The following presents financial data for the Company’s reportable segments.
| Three months ended June 30, | Six months ended June 30, | ||||||||||||||||||||||
| (In millions) | 2025 | 2024 | 2025 | 2024 | |||||||||||||||||||
Asset Management |
|||||||||||||||||||||||
Management fees1
|
$ | $ | $ | $ | |||||||||||||||||||
| Capital solutions fees and other, net | |||||||||||||||||||||||
| Fee-related performance fee | |||||||||||||||||||||||
| Fee-related compensation | ( |
( |
( |
( |
|||||||||||||||||||
| Other operating expenses | ( |
( |
( |
( |
|||||||||||||||||||
| Fee Related Earnings | |||||||||||||||||||||||
| Retirement Services | |||||||||||||||||||||||
| Fixed income and other net investment income | |||||||||||||||||||||||
| Alternative net investment income | |||||||||||||||||||||||
| Strategic capital management fees | |||||||||||||||||||||||
| Cost of funds | ( |
( |
( |
( |
|||||||||||||||||||
| Other operating expenses | ( |
( |
( |
( |
|||||||||||||||||||
| Interest and other financing costs | ( |
( |
( |
( |
|||||||||||||||||||
| Spread Related Earnings | |||||||||||||||||||||||
| Principal Investing | |||||||||||||||||||||||
| Realized performance fees | |||||||||||||||||||||||
| Realized investment income | |||||||||||||||||||||||
| Principal investing compensation | ( |
( |
( |
( |
|||||||||||||||||||
| Other operating expenses | ( |
( |
( |
( |
|||||||||||||||||||
| Principal Investing Income | |||||||||||||||||||||||
| Segment Income | $ | $ | $ | $ | |||||||||||||||||||
| Three months ended June 30, | Six months ended June 30, | ||||||||||||||||||||||
| (In millions) | 2025 | 2024 | 2025 | 2024 | |||||||||||||||||||
| Segment Revenue | |||||||||||||||||||||||
Asset Management1
|
$ | $ | $ | $ | |||||||||||||||||||
| Retirement Services | |||||||||||||||||||||||
| Principal Investing | |||||||||||||||||||||||
| Total Segment Revenue | $ | $ | $ | $ | |||||||||||||||||||
| (In millions) | June 30, 2025 | December 31, 2024 | |||||||||
| Segment Assets | |||||||||||
| Asset Management | $ | $ | |||||||||
| Retirement Services | |||||||||||
| Principal Investing | |||||||||||
| Total Assets | $ | $ | |||||||||
1 Includes intersegment management fees from Retirement Services of $ |
|||||||||||
The following presents the reconciliation of Segment Income and Segment Revenue to income (loss) before income tax (provision) benefit and total revenues reported in the condensed consolidated statements of operations:
93
APOLLO GLOBAL MANAGEMENT, INC.
NOTES TO CONDENSED CONSOLIDATED FINANCIAL STATEMENTS (UNAUDITED)
| Three months ended June 30, | Six months ended June 30, | ||||||||||||||||||||||
| (In millions) | 2025 | 2024 | 2025 | 2024 | |||||||||||||||||||
| Segment Income | $ | $ | $ | $ | |||||||||||||||||||
Asset Management Adjustments: |
|||||||||||||||||||||||
Equity-based profit sharing expense1,5
|
( |
( |
( |
( |
|||||||||||||||||||
| Equity-based compensation | ( |
( |
( |
( |
|||||||||||||||||||
| Net (income) loss attributable to non-controlling interests in consolidated entities | |||||||||||||||||||||||
Unrealized performance fees5
|
( |
||||||||||||||||||||||
Unrealized profit sharing expense5
|
( |
( |
( |
||||||||||||||||||||
HoldCo interest and other financing costs2
|
( |
( |
( |
( |
|||||||||||||||||||
Unrealized principal investment (income) loss5
|
( |
||||||||||||||||||||||
Unrealized net (gains) losses from investment activities5
|
( |
( |
( |
( |
|||||||||||||||||||
Transaction-related costs, restructuring and other non-operating expenses3
|
( |
( |
( |
( |
|||||||||||||||||||
| Retirement Services Adjustments: | |||||||||||||||||||||||
| Investment gains (losses), net of offsets | ( |
( |
( |
( |
|||||||||||||||||||
Non-operating change in insurance liabilities and related derivatives4
|
( |
||||||||||||||||||||||
| Integration, restructuring and other non-operating expenses | ( |
( |
( |
( |
|||||||||||||||||||
| Equity-based compensation | ( |
( |
( |
( |
|||||||||||||||||||
| Income (loss) before income tax (provision) benefit | $ | $ | $ | $ | |||||||||||||||||||
1 Equity-based profit sharing expense includes certain profit sharing arrangements in which a portion of performance fees distributed to the general partner are required to be used by employees of Apollo to purchase restricted shares of common stock or is delivered in the form of RSUs, which are granted under the Equity Plan. Equity-based profit sharing expense and other also includes performance grants which are tied to the Company’s receipt of performance fees, within prescribed periods, sufficient to cover the associated equity-based compensation expense.
| |||||||||||||||||||||||
2 Represents interest and other financing costs related to AGM not attributable to any specific segment.
| |||||||||||||||||||||||
3 Transaction-related costs, restructuring and other non-operating expenses includes: (a) contingent consideration, certain equity-based charges, amortization of intangible assets and certain other expenses associated with acquisitions; (b) gains (losses) from changes in the tax receivable agreement liability; (c) merger-related transaction and integration costs associated with Company’s merger with Athene and (d) other non-operating expenses, including the issuance of shares of AGM common stock for charitable contributions. In the six months ended June 30, 2025, other non-operating expenses includes $ | |||||||||||||||||||||||
4 Includes change in fair values of derivatives and embedded derivatives, non-operating change in funding agreements, change in fair value of market risk benefits, and non-operating change in liability for future policy benefits.
| |||||||||||||||||||||||
5 Represents adjustments that primarily impact the Principal Investing segment.
| |||||||||||||||||||||||
94
APOLLO GLOBAL MANAGEMENT, INC.
NOTES TO CONDENSED CONSOLIDATED FINANCIAL STATEMENTS (UNAUDITED)
| Three months ended June 30, | Six months ended June 30, | ||||||||||||||||||||||
| (In millions) | 2025 | 2024 | 2025 | 2024 | |||||||||||||||||||
| Segment Revenues | $ | $ | $ | $ | |||||||||||||||||||
Asset Management Adjustments: |
|||||||||||||||||||||||
Adjustments related to consolidated funds and VIEs1
|
|||||||||||||||||||||||
Performance fees2
|
( |
||||||||||||||||||||||
Principal investment income (loss)2
|
|||||||||||||||||||||||
Equity awards granted by unconsolidated related parties, reimbursable expenses and other1
|
|||||||||||||||||||||||
| Retirement Services Adjustments: | |||||||||||||||||||||||
Premiums, product charges, investment related gains (losses) and other retirement services revenue3
|
( |
||||||||||||||||||||||
| Change in fair value of reinsurance assets | |||||||||||||||||||||||
| Forward points adjustment on FX derivative hedges | ( |
( |
( |
( |
|||||||||||||||||||
| Held-for-trading amortization | |||||||||||||||||||||||
| Reinsurance impacts | |||||||||||||||||||||||
| ACRA non-controlling interests on net investment earnings | |||||||||||||||||||||||
| Other retirement services adjustments | ( |
( |
( |
||||||||||||||||||||
| Total Revenues | $ | $ | $ | $ | |||||||||||||||||||
|
1 Represents advisory fees, management fees and performance fees earned from consolidated VIEs which are eliminated in consolidation. Includes non-cash
revenues related to equity awards granted by unconsolidated related parties to employees of the Company and certain compensation and administrative related expense reimbursements.
| |||||||||||||||||||||||
2 Represents adjustments that primarily impact the Principal Investing segment.
| |||||||||||||||||||||||
3 Refer to the consolidated statement of operations for breakout of individual items.
| |||||||||||||||||||||||
The following table presents the reconciliation of the Company’s total reportable segment assets to total assets:
| (In millions) | June 30, 2025 | December 31, 2024 | |||||||||
| Total reportable segment assets | $ | $ | |||||||||
Adjustments1
|
|||||||||||
| Total assets | $ | $ | |||||||||
1 Represents the addition of assets of consolidated funds and VIEs and consolidation elimination adjustments.
| |||||||||||
18. Subsequent Events
Dividends
On August 5, 2025, the Company declared a cash dividend of $0.51 per share of common stock, which will be paid on August 29, 2025 to holders of record at the close of business on August 18, 2025.
On August 5, 2025, the Company also declared and set aside for payment a cash dividend of $0.8438 per share of its Mandatory Convertible Preferred Stock, which will be paid on October 31, 2025 to holders of record at the close of business on October 15, 2025.
95
ITEM 1A. UNAUDITED SUPPLEMENTAL PRESENTATION OF STATEMENTS OF FINANCIAL CONDITION
| June 30, 2025 | |||||||||||||||||||||||
| (In millions) | Apollo Global Management, Inc. and Consolidated Subsidiaries | Consolidated Funds and VIEs | Eliminations | Consolidated | |||||||||||||||||||
| Assets | |||||||||||||||||||||||
| Asset Management | |||||||||||||||||||||||
| Cash and cash equivalents | $ | 2,382 | $ | — | $ | — | $ | 2,382 | |||||||||||||||
| Restricted cash and cash equivalents | 3 | — | — | 3 | |||||||||||||||||||
| Investments | 6,381 | — | (496) | 5,885 | |||||||||||||||||||
| Assets of consolidated variable interest entities | |||||||||||||||||||||||
| Cash and cash equivalents | — | 346 | — | 346 | |||||||||||||||||||
| Investments | — | 2,367 | (109) | 2,258 | |||||||||||||||||||
| Other assets | — | 341 | (246) | 95 | |||||||||||||||||||
| Due from related parties | 850 | — | (87) | 763 | |||||||||||||||||||
| Goodwill | 264 | — | — | 264 | |||||||||||||||||||
| Other assets | 3,064 | — | — | 3,064 | |||||||||||||||||||
| 12,944 | 3,054 | (938) | 15,060 | ||||||||||||||||||||
| Retirement Services | |||||||||||||||||||||||
| Cash and cash equivalents | 10,329 | — | — | 10,329 | |||||||||||||||||||
| Restricted cash and cash equivalents | 1,720 | — | — | 1,720 | |||||||||||||||||||
| Investments | 299,393 | — | (282) | 299,111 | |||||||||||||||||||
| Investments in related parties | 47,118 | — | (16,630) | 30,488 | |||||||||||||||||||
| Assets of consolidated variable interest entities | |||||||||||||||||||||||
| Cash and cash equivalents | 19 | 172 | — | 191 | |||||||||||||||||||
| Investments | 1,680 | 24,681 | (173) | 26,188 | |||||||||||||||||||
| Other assets | 8 | 333 | — | 341 | |||||||||||||||||||
| Reinsurance recoverable | 9,273 | — | — | 9,273 | |||||||||||||||||||
| Deferred acquisition costs, deferred sales inducements and value of business acquired | 7,981 | — | — | 7,981 | |||||||||||||||||||
| Goodwill | 4,075 | — | — | 4,075 | |||||||||||||||||||
| Other assets | 14,889 | — | (96) | 14,793 | |||||||||||||||||||
| 396,485 | 25,186 | (17,181) | 404,490 | ||||||||||||||||||||
| Total Assets | $ | 409,429 | $ | 28,240 | $ | (18,119) | $ | 419,550 | |||||||||||||||
| (Continued) | |||||||||||||||||||||||
96
| June 30, 2025 | |||||||||||||||||||||||
| (In millions) | Apollo Global Management, Inc. and Consolidated Subsidiaries | Consolidated Funds and VIEs | Eliminations | Consolidated | |||||||||||||||||||
| Liabilities, Redeemable non-controlling interests and Equity | |||||||||||||||||||||||
| Liabilities | |||||||||||||||||||||||
| Asset Management | |||||||||||||||||||||||
| Accounts payable, accrued expenses, and other liabilities | $ | 4,079 | $ | — | $ | — | $ | 4,079 | |||||||||||||||
| Due to related parties | 1,013 | — | (253) | 760 | |||||||||||||||||||
| Debt | 4,280 | — | — | 4,280 | |||||||||||||||||||
| Liabilities of consolidated variable interest entities | |||||||||||||||||||||||
| Debt, at fair value | — | 175 | (175) | — | |||||||||||||||||||
| Other liabilities | — | 1,155 | (107) | 1,048 | |||||||||||||||||||
| 9,372 | 1,330 | (535) | 10,167 | ||||||||||||||||||||
| Retirement Services | |||||||||||||||||||||||
| Interest sensitive contract liabilities | 292,238 | — | — | 292,238 | |||||||||||||||||||
| Future policy benefits | 49,400 | — | — | 49,400 | |||||||||||||||||||
| Market risk benefits | 4,489 | — | — | 4,489 | |||||||||||||||||||
| Debt | 7,864 | — | — | 7,864 | |||||||||||||||||||
| Payables for collateral on derivatives and securities to repurchase | 7,260 | — | — | 7,260 | |||||||||||||||||||
| Other liabilities | 12,517 | — | — | 12,517 | |||||||||||||||||||
| Liabilities of consolidated variable interest entities | |||||||||||||||||||||||
| Other liabilities | 30 | 1,730 | (6) | 1,754 | |||||||||||||||||||
| 373,798 | 1,730 | (6) | 375,522 | ||||||||||||||||||||
| Total Liabilities | 383,170 | 3,060 | (541) | 385,689 | |||||||||||||||||||
Commitments and Contingencies (note 16) |
|||||||||||||||||||||||
| Equity | |||||||||||||||||||||||
Mandatory Convertible Preferred Stock |
1,398 | — | — | 1,398 | |||||||||||||||||||
| Additional paid in capital | 15,657 | 40 | — | 15,697 | |||||||||||||||||||
| Retained earnings (accumulated deficit) | 5,938 | 17,704 | (17,723) | 5,919 | |||||||||||||||||||
| Accumulated other comprehensive income (loss) | (3,689) | 33 | (37) | (3,693) | |||||||||||||||||||
| Total AGM Stockholders’ Equity | 19,304 | 17,777 | (17,760) | 19,321 | |||||||||||||||||||
| Non-controlling interests | 6,955 | 7,403 | 182 | 14,540 | |||||||||||||||||||
| Total Equity | 26,259 | 25,180 | (17,578) | 33,861 | |||||||||||||||||||
| Total Liabilities and Equity | $ | 409,429 | $ | 28,240 | $ | (18,119) | $ | 419,550 | |||||||||||||||
| (Concluded) | |||||||||||||||||||||||
97
| December 31, 2024 | |||||||||||||||||||||||
| (In millions) | Apollo Global Management, Inc. and Consolidated Subsidiaries | Consolidated Funds and VIEs | Eliminations | Consolidated | |||||||||||||||||||
| Assets | |||||||||||||||||||||||
| Asset Management | |||||||||||||||||||||||
| Cash and cash equivalents | $ | 2,692 | $ | — | $ | — | $ | 2,692 | |||||||||||||||
| Restricted cash and cash equivalents | 3 | — | — | 3 | |||||||||||||||||||
| Investments | 6,558 | — | (472) | 6,086 | |||||||||||||||||||
| Assets of consolidated variable interest entities | |||||||||||||||||||||||
| Cash and cash equivalents | — | 158 | — | 158 | |||||||||||||||||||
| Investments | — | 2,962 | (156) | 2,806 | |||||||||||||||||||
| Other assets | — | 188 | (104) | 84 | |||||||||||||||||||
| Due from related parties | 630 | — | (46) | 584 | |||||||||||||||||||
| Goodwill | 264 | — | — | 264 | |||||||||||||||||||
| Other assets | 2,579 | — | — | 2,579 | |||||||||||||||||||
| 12,726 | 3,308 | (778) | 15,256 | ||||||||||||||||||||
| Retirement Services | |||||||||||||||||||||||
| Cash and cash equivalents | 12,733 | — | — | 12,733 | |||||||||||||||||||
| Restricted cash and cash equivalents | 943 | — | — | 943 | |||||||||||||||||||
| Investments | 262,561 | — | (278) | 262,283 | |||||||||||||||||||
| Investments in related parties | 44,332 | — | (15,448) | 28,884 | |||||||||||||||||||
| Assets of consolidated variable interest entities | |||||||||||||||||||||||
| Cash and cash equivalents | — | 583 | — | 583 | |||||||||||||||||||
| Investments | 1,807 | 21,722 | (105) | 23,424 | |||||||||||||||||||
| Other assets | 12 | 553 | — | 565 | |||||||||||||||||||
| Reinsurance recoverable | 8,194 | — | — | 8,194 | |||||||||||||||||||
| Deferred acquisition costs, deferred sales inducements and value of business acquired | 7,173 | — | — | 7,173 | |||||||||||||||||||
| Goodwill | 4,063 | — | — | 4,063 | |||||||||||||||||||
| Other assets | 13,865 | — | (71) | 13,794 | |||||||||||||||||||
| 355,683 | 22,858 | (15,902) | 362,639 | ||||||||||||||||||||
| Total Assets | $ | 368,409 | $ | 26,166 | $ | (16,680) | $ | 377,895 | |||||||||||||||
| (Continued) | |||||||||||||||||||||||
98
| December 31, 2024 | |||||||||||||||||||||||
| (In millions) | Apollo Global Management, Inc. and Consolidated Subsidiaries | Consolidated Funds and VIEs | Eliminations | Consolidated | |||||||||||||||||||
| Liabilities, Redeemable non-controlling interests and Equity | |||||||||||||||||||||||
| Liabilities | |||||||||||||||||||||||
| Asset Management | |||||||||||||||||||||||
| Accounts payable, accrued expenses, and other liabilities | $ | 3,616 | $ | — | $ | — | $ | 3,616 | |||||||||||||||
| Due to related parties | 834 | — | (124) | 710 | |||||||||||||||||||
| Debt | 4,279 | — | — | 4,279 | |||||||||||||||||||
| Liabilities of consolidated variable interest entities | |||||||||||||||||||||||
| Debt, at fair value | — | 123 | (123) | — | |||||||||||||||||||
| Other liabilities | — | 1,417 | (54) | 1,363 | |||||||||||||||||||
| 8,729 | 1,540 | (301) | 9,968 | ||||||||||||||||||||
| Retirement Services | |||||||||||||||||||||||
| Interest sensitive contract liabilities | 253,637 | — | — | 253,637 | |||||||||||||||||||
| Future policy benefits | 49,902 | — | — | 49,902 | |||||||||||||||||||
| Market risk benefits | 4,028 | — | — | 4,028 | |||||||||||||||||||
| Debt | 6,309 | — | — | 6,309 | |||||||||||||||||||
| Payables for collateral on derivatives and securities to repurchase | 11,652 | — | — | 11,652 | |||||||||||||||||||
| Other liabilities | 9,789 | — | (5) | 9,784 | |||||||||||||||||||
| Liabilities of consolidated variable interest entities | |||||||||||||||||||||||
| Other liabilities | 30 | 1,610 | (5) | 1,635 | |||||||||||||||||||
| 335,347 | 1,610 | (10) | 336,947 | ||||||||||||||||||||
| Total Liabilities | 344,076 | 3,150 | (311) | 346,915 | |||||||||||||||||||
Commitments and Contingencies (note 16) |
|||||||||||||||||||||||
| Redeemable non-controlling interests | |||||||||||||||||||||||
| Redeemable non-controlling interests | — | 16 | — | 16 | |||||||||||||||||||
| Equity | |||||||||||||||||||||||
Mandatory Convertible Preferred Stock |
1,398 | — | — | 1,398 | |||||||||||||||||||
| Additional paid in capital | 15,287 | 40 | — | 15,327 | |||||||||||||||||||
| Retained earnings (accumulated deficit) | 6,021 | 16,673 | (16,672) | 6,022 | |||||||||||||||||||
| Accumulated other comprehensive income (loss) | (5,485) | (60) | 51 | (5,494) | |||||||||||||||||||
| Total AGM Stockholders’ Equity | 17,221 | 16,653 | (16,621) | 17,253 | |||||||||||||||||||
| Non-controlling interests | 7,112 | 6,347 | 252 | 13,711 | |||||||||||||||||||
| Total Equity | 24,333 | 23,000 | (16,369) | 30,964 | |||||||||||||||||||
| Total Liabilities, Redeemable non-controlling interests and Equity | $ | 368,409 | $ | 26,166 | $ | (16,680) | $ | 377,895 | |||||||||||||||
| (Concluded) | |||||||||||||||||||||||
99
ITEM 2. MANAGEMENT’S DISCUSSION AND ANALYSIS OF FINANCIAL CONDITION AND RESULTS OF OPERATIONS
The following discussion should be read in conjunction with Apollo Global Management, Inc.’s condensed consolidated financial statements and the related notes within this quarterly report. This discussion contains forward-looking statements that are subject to known and unknown risks and uncertainties. Actual results and the timing of events may differ significantly from those expressed or implied in such forward-looking statements due to a number of factors, including those included in the section entitled “Item 1A. Risk Factors” in the 2024 Annual Report. The highlights listed below have had significant effects on many items within our condensed consolidated financial statements and affect the comparison of the current period’s activity with those of prior periods.
General
Our Businesses
Founded in 1990, Apollo is a high-growth, global alternative asset manager and a retirement services provider. Apollo conducts its business primarily in the United States through the following three reportable segments: Asset Management, Retirement Services and Principal Investing. These business segments are differentiated based on the investment services they provide as well as varying investing strategies. As of June 30, 2025, Apollo had a team of 5,333 employees, including 2,008 employees of Athene.
Asset Management
Our Asset Management segment focuses on credit and equity investing strategies. We have a flexible mandate in many of the funds we manage which enables the funds to invest opportunistically across a company’s capital structure. We raise, invest and manage funds, accounts and other vehicles on behalf of some of the world’s most prominent pension, endowment and sovereign wealth funds and insurance companies, as well as other institutional and individual investors. As of June 30, 2025, we had total AUM of $840 billion.
The credit and equity investing strategies of our Asset Management segment reflect the range of investment capabilities across our platform, from investment grade to private equity. As an asset manager, we earn fees for providing investment management services and expertise to our client base. The amount of fees charged for managing these assets depends on the underlying investment strategy, liquidity profile, and, ultimately, our ability to generate returns for our clients. We also earn capital solutions fees as part of our growing capital solutions business and as part of monitoring and deployment activity alongside our private equity franchise. After expenses, we call the resulting earnings stream “Fee Related Earnings” or “FRE”, which represents the primary performance measure for the Asset Management segment.
Credit
Credit is our largest asset management strategy with $690 billion of AUM as of June 30, 2025. Our credit strategy spans third-party strategies and Apollo’s retirement services business across four main investment pillars: direct origination, asset-backed, multi credit and opportunistic credit. Our credit strategy provides flexible, scaled and diverse capital solutions across the entire credit risk-return spectrum, with a focus on generating excess returns through high-quality credit underwriting and origination. Beyond participation in the traditional issuance and secondary credit markets, through our origination platforms and corporate solutions capabilities we seek to originate attractive and safe-yielding assets for the investors in the funds we manage.
Equity
Our equity strategy managed $150 billion of AUM as of June 30, 2025. Across our equity strategy, we maintain our focus on creative structuring and sourcing while working with the management teams of the portfolio companies of the Apollo-managed funds to help transform and grow their businesses. Our flexible mandate and purchase price discipline allow us to embrace complexity and seek attractive outcomes for our stakeholders. Apollo’s equity team has experience across sectors, industries, and geographies spanning its private equity, hybrid value, secondaries equity, AAA, real estate equity, impact investing, infrastructure and clean transition equity strategies. We have consistently produced attractive long-term investment returns in the traditional private equity funds we manage, generating a 39% gross IRR and a 24% net IRR on a compound annual basis from inception through June 30, 2025.
100
Retirement Services
Our retirement services business is conducted by Athene, a leading financial services company that specializes in issuing, reinsuring and acquiring retirement savings products designed for the increasing number of individuals and institutions seeking to fund retirement needs. Athene’s primary product line is annuities, which include fixed, payout and group annuities issued in conjunction with pension group annuity transactions and defined contribution plans. Athene also offers funding agreements and guaranteed investment contracts issued in connection with defined contribution plans. Funding agreements are comprised of funding agreements issued under its FABN program, secured and other funding agreements, which include Athene’s FABR program and direct funding agreements, funding agreements issued to the FHLB and repurchase agreements with an original maturity exceeding one year. Our asset management business provides a full suite of services for Athene’s investment portfolio, including direct investment management, asset allocation, mergers and acquisitions asset diligence, and certain operational support services including investment compliance, tax, legal and risk management support.
Our retirement services business focuses on generating spread income by combining the two core competencies of (1) sourcing long-term, persistent liabilities and (2) using the global scale and reach of our asset management business to actively source or originate assets with Athene’s preferred risk and return characteristics. Athene’s investment philosophy is to invest a portion of its assets in securities that earn an incremental yield by taking measured liquidity and complexity risk and capitalize on its long-dated, persistent liability profile to prudently achieve higher net investment earned rates, rather than assuming incremental credit risk. A cornerstone of Athene’s investment philosophy is that given the operating leverage inherent in its business, modest investment outperformance can translate to outsized return performance. Because Athene maintains discipline in underwriting attractively priced liabilities, it has the ability to invest in a broad range of high-quality assets to generate attractive earnings.
Principal Investing
Our Principal Investing segment is comprised of our realized performance fee income, realized investment income from our balance sheet investments, and certain allocable expenses related to corporate functions supporting the entire company. The Principal Investing segment also includes our growth capital and liquidity resources at AGM. Over time, we may deploy capital into strategic investments that will help accelerate the growth of our Asset Management segment, by broadening our investment management and/or product distribution capabilities or increasing the efficiency of our operations. We believe these investments may translate into greater compounded annual growth of Fee Related Earnings.
Given the cyclical nature of performance fees, earnings from our Principal Investing segment, or PII, are inherently more volatile in nature than earnings from the Asset Management and Retirement Services segments. We earn fees based on the investment performance of the funds we manage and compensate our employees, primarily investment professionals, with a meaningful portion of these proceeds to align our team with the investors in the funds we manage and incentivize them to deliver strong investment performance over time. To enhance this alignment, we have increased the proportion of performance fee income we pay to our employees over the last few years.
101
The diagram below depicts our current organizational structure:
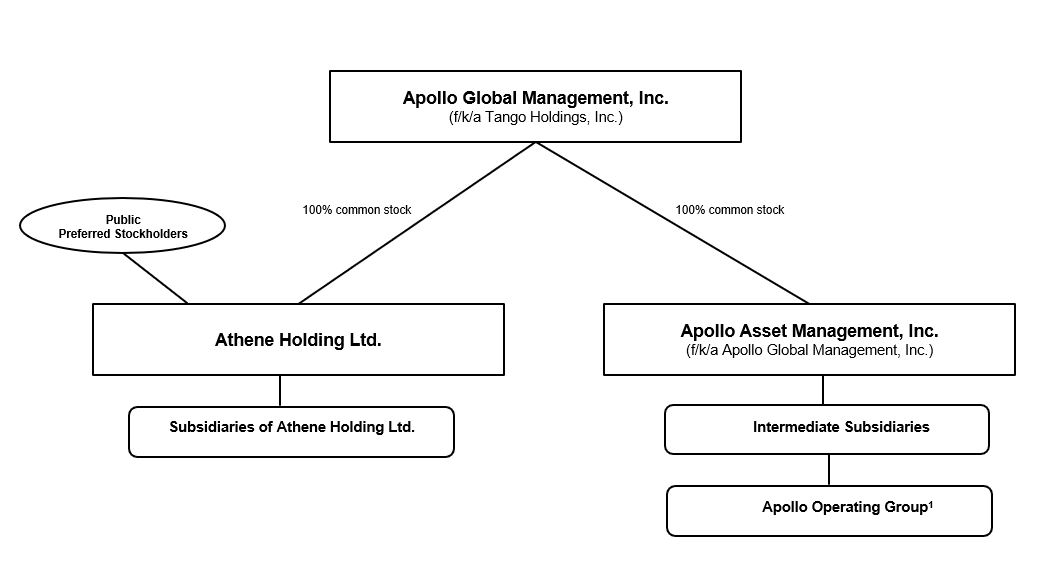
Note: The organizational structure chart above depicts a simplified version of the Apollo structure. It does not include all legal entities in the structure.
(1)Includes direct and indirect ownership by AGM.
Business Environment
Economic and Market Conditions
Our asset management and retirement services businesses are affected by the condition of global financial markets and the economy. Price fluctuations within equity, credit, commodity and foreign exchange markets, as well as interest rates and global inflation, which may be volatile and mixed across geographies, can significantly impact the performance of our business, including, but not limited to, the valuation of investments, including those of the funds we manage, and related income we may recognize.
Adverse economic conditions may result from domestic and global economic and political developments, including plateauing or decreasing economic growth and business activity, changes to U.S. and foreign tariff policies, civil unrest, geopolitical tensions or military action, such as the armed conflicts in the Middle East and between Ukraine and Russia, and corresponding sanctions imposed on Russia by the United States and other countries, and new or evolving legal and regulatory requirements on business investment, hiring, migration, labor supply and global supply chains.
The ongoing uncertainty regarding trade policy poses a downside risk to the current economic outlook, with lower growth and higher inflationary pressures increasing the risk of a stagflationary environment. Tariffs, which are inflationary in nature, remain in place and may have a negative impact on GDP growth. The potential impact of tariffs on corporate earnings remains uncertain and will depend on the duration and outcome of related trade negotiations.
We carefully monitor economic and market conditions that could potentially give rise to global market volatility and affect our business operations, investment portfolios and derivatives, which include global inflation. U.S. inflation remains elevated with the U.S. Bureau of Labor Statistics reporting the annual U.S. inflation rate at 2.7% as of June 30, 2025, compared to 2.4% as of March 31, 2025. The U.S. Federal Reserve finished the quarter with a benchmark interest rate target range of 4.25% to 4.50%, unchanged from its December 2024 meeting.
Equity market performance was strong during the second quarter of 2025. In the U.S., the S&P 500 Index increased by 10.6% during the second quarter of 2025, following a decrease of 4.6% in the first quarter of 2025. Global equity markets increased
102
during the quarter, with the MSCI All Country World ex USA Index increasing by 12.3%, following an increase of 6.4% in the first quarter of 2025.
Conditions in the credit markets also have a significant impact on our business. Credit markets were positive in the second quarter of 2025, with the BofAML HY Master II Index increasing by 3.6%, while the Morningstar/LSTA Leveraged Loan Index increased by 2.8%.
In terms of economic conditions in the U.S., the Bureau of Economic Analysis reported real GDP increased at an annual rate of 3.0% in the second quarter of 2025, following a decrease of 0.5% in the first quarter of 2025. As of July 2025, the International Monetary Fund estimated the U.S. economy will expand by 1.9% in 2025 and 2.0% in 2026. The U.S. Bureau of Labor Statistics reported the U.S. unemployment rate decreased to 4.1% as of June 30, 2025.
Foreign exchange rates can materially impact the valuations of our investments and those of the funds we manage that are denominated in currencies other than the U.S. dollar. The U.S. dollar weakened in the second quarter of 2025 compared to the euro and the British pound. Relative to the U.S. dollar, the euro appreciated 9.0% during the second quarter of 2025, after appreciating 4.5% in the first quarter of 2025, while the British pound appreciated 6.3% during the second quarter of 2025, after appreciating 3.2% in the first quarter of 2025. Oil finished the second quarter of 2025 down 8.9% from the first quarter of 2025.
We are actively monitoring the developments in Ukraine resulting from the Russia/Ukraine conflict and the economic sanctions and restrictions imposed against Russia, Belarus, and certain Russian and Belarussian entities and individuals. The Company continues to (i) identify and assess any exposure to designated persons or entities across the Company’s business; (ii) ensure existing surveillance and controls are calibrated to the evolving sanctions; and (iii) ensure appropriate levels of communication across the Company, and with other relevant market participants, as appropriate.
As of June 30, 2025, the funds we manage have no investments that would cause Apollo or any Apollo managed fund to be in violation of current international sanctions, and we believe the direct exposure of investment portfolios of the funds we manage to Russia and Ukraine is insignificant. The Company and the funds we manage do not intend to make any new material investments in Russia, and have appropriate controls in place to ensure review of any new exposure.
Institutional investors continue to allocate capital towards alternative investment managers in search of more attractive returns, and we believe the business environment remains generally accommodative to raise larger successor funds, launch new products, and pursue attractive strategic growth opportunities.
Interest Rate Environment
Medium and long-term rates experienced some volatility during the second quarter of 2025 before ending the quarter relatively flat, with the U.S. 10-year Treasury yield at 4.24% as of June 30, 2025, compared to 4.23% as of March 31, 2025. Short-term rates were generally flat during the second quarter of 2025, with the 3-month secured overnight financing rate at 4.29% as of each of June 30, 2025 and March 31, 2025, respectively.
With respect to Retirement Services, Athene’s investment portfolio consists predominantly of fixed maturity investments. If prevailing interest rates were to rise, we believe the yield on Athene’s new investment purchases may also rise and its investment income from floating rate investments would increase, while the value of its existing investments may decline. If prevailing interest rates were to decline significantly, the yield on Athene’s new investment purchases may decline and its investment income from floating rate investments would decrease, while the value of its existing investments may increase.
Athene addresses interest rate risk through managing the duration of the liabilities it sources with assets it acquires through asset liability management (“ALM”) modeling. As part of its investment strategy, Athene purchases floating rate investments, which are expected to perform well in a rising interest rate environment and are expected to underperform in a declining rate environment. Athene manages its interest rate risk in a declining rate environment through hedging activity or the issuance of additional floating rate liabilities to lower its overall net floating rate position. As of June 30, 2025, Athene’s net invested asset portfolio included $55.9 billion of floating rate investments, or 20% of its net invested assets, and its net reserve liabilities included $40.8 billion of floating rate liabilities at notional, or 15% of its net invested assets, resulting in $15.1 billion of net floating rate assets, or 5% of its net invested assets.
If prevailing interest rates were to rise, we believe Athene’s products would be more attractive to consumers and its sales would likely increase. If prevailing interest rates were to decline, it is likely that Athene’s products would be less attractive to
103
consumers and its sales would likely decrease. In periods of prolonged low interest rates, the net investment spread may be negatively impacted by reduced investment income to the extent that Athene is unable to adequately reduce policyholder crediting rates due to policyholder guarantees in the form of minimum crediting rates or otherwise due to market conditions. A significant majority of Athene’s deferred annuity products have crediting rates that it may reset annually upon renewal, following the expiration of the current guaranteed period. While Athene has the contractual ability to lower these crediting rates to the guaranteed minimum levels at renewal, its willingness to do so may be limited by competitive pressures. Athene’s funding agreements and other investment-type products, the latter of which is comprised of immediate annuities without significant mortality risk (including pension group annuities without life contingencies) and assumed endowments without significant mortality risks, provide little to no discretionary ability to change the rates of interest that determine the amounts payable to the respective policyholder or institution.
See “Part I—Item 3. Quantitative and Qualitative Disclosures About Market Risk,” in this report and “Part II—Item 7A. Quantitative and Qualitative Disclosures About Market Risk,” in our 2024 Annual Report, which include a discussion regarding interest rate and other significant risks and our strategies for managing these risks.
Overview of Results of Operations
Financial Measures under U.S. GAAP - Asset Management
The following discussion of financial measures under U.S. GAAP is based on Apollo’s asset management business as of June 30, 2025.
Revenues
Management Fees
The significant growth of the assets we manage has had a positive effect on our revenues. Management fees are typically calculated based upon any of “net asset value,” “gross assets,” “adjusted par asset value,” “adjusted costs of all unrealized portfolio investments,” “capital commitments,” “invested capital,” “adjusted assets,” “capital contributions,” or “stockholders’ equity,” each as defined in the applicable limited partnership agreement and/or management agreement of the unconsolidated funds or accounts.
Advisory and Transaction Fees, Net
As a result of providing advisory services with respect to actual and potential investments, we are entitled to receive fees for transactions related to the acquisition and, in certain instances, disposition and financing of companies, some of which are portfolio companies of the funds we manage, as well as fees for ongoing monitoring of portfolio company operations and directors’ fees. We also receive advisory fees for advisory services provided to certain funds. In addition, monitoring fees are generated on certain structured portfolio company investments. Under the terms of the limited partnership agreements for certain funds, the management fee payable by the funds may be subject to a reduction based on a certain percentage (up to 100%) of such advisory and transaction fees, net of applicable broken deal costs (“Management Fee Offset”). Such amounts are presented as a reduction to advisory and transaction fees, net, in the condensed consolidated statements of operations.
Performance Fees
The general partners of the funds we manage are entitled to an incentive return of normally up to 20% of the total returns of a fund’s capital, depending upon performance of the underlying funds and subject to preferred returns and high water marks, as applicable. Performance fees, categorized as performance allocations, are accounted for as an equity method investment, and effectively, the performance fees for any period are based upon an assumed liquidation of the funds’ assets at the reporting date, and distribution of the net proceeds in accordance with the funds’ allocation provisions. Performance fees categorized as incentive fees, which are not accounted for as an equity method investment, are deferred until fees are probable to not be significantly reversed. The majority of performance fees are comprised of performance allocations.
As of June 30, 2025, approximately 41% of the value of the investments of the funds we manage, on a gross basis, was determined using market-based valuation methods (i.e., reliance on broker or listed exchange quotes) and the remaining 59% was determined primarily by comparable company and industry multiples or discounted cash flow models. See “Item 1A. Risk Factors—Risks Relating to Our Asset Management Business—The performance of the funds we manage, and our performance,
104
may be adversely affected by the financial performance of portfolio companies of the funds we manage and the industries in which the funds we manage invest” in the 2024 Annual Report for discussion regarding certain industry-specific risks that could affect the fair value of certain of the portfolio company investments of the funds we manage.
In certain funds we manage, generally in our equity strategy, the Company does not earn performance fees until the investors have achieved cumulative investment returns on invested capital (including management fees and expenses) in excess of an 8% hurdle rate. Additionally, certain of the credit funds we manage have various performance fee rates and hurdle rates. Certain of the credit funds we manage allocate performance fees to the general partner in a similar manner as the equity funds. In certain funds we manage, as long as the investors achieve their priority returns, there is a catch-up formula whereby the Company earns a priority return for a portion of the return until the Company’s performance fees equate to its performance fee rate for that fund; thereafter, the Company participates in returns from the fund at the performance fee rate. Performance fees, categorized as performance allocations, are subject to reversal to the extent that the performance fees distributed exceed the amount due to the general partner based on a fund’s cumulative investment returns. The Company recognizes potential repayment of previously received performance fees as a general partner obligation representing all amounts previously distributed to the general partner that would need to be repaid to the Apollo funds if these funds were to be liquidated based on the current fair value of the underlying fund’s investments as of the reporting date. The actual general partner obligation, however, would not become payable or realized until the end of a fund’s life or as otherwise set forth in the respective limited partnership agreement of the fund.
105
The table below presents an analysis of Apollo’s (i) performance fees receivable on an unconsolidated basis, (ii) unrealized performance fees and (iii) realized performance fees, inclusive of realized incentive fees:
| June 30, 2025 | Performance Fees for the Three Months Ended June 30, 2025 |
Performance Fees for the Six Months Ended June 30, 2025 |
|||||||||||||||||||||||||||||||||||||||
| (In millions) | Performance Fees Receivable on an Unconsolidated Basis | Unrealized | Realized | Total | Unrealized | Realized | Total | ||||||||||||||||||||||||||||||||||
| Accord and Accord+ Funds | $ | 126 | $ | 23 | $ | — | $ | 23 | $ | 33 | $ | — | $ | 33 | |||||||||||||||||||||||||||
| AIOF I, II and III | 61 | 2 | 3 | 5 | 4 | 3 | 7 | ||||||||||||||||||||||||||||||||||
ANRP I, II and III1
|
76 | 23 | 8 | 31 | 40 | 13 | 53 | ||||||||||||||||||||||||||||||||||
| Athora | 46 | (23) | — | (23) | (38) | — | (38) | ||||||||||||||||||||||||||||||||||
| Credit Strategies | 46 | 24 | — | 24 | 40 | 6 | 46 | ||||||||||||||||||||||||||||||||||
EPF Funds1
|
25 | (2) | — | (2) | 4 | — | 4 | ||||||||||||||||||||||||||||||||||
| FCI Funds | 90 | 2 | — | 2 | (2) | — | (2) | ||||||||||||||||||||||||||||||||||
| Freedom Parent Holdings | 65 | 29 | — | 29 | 46 | — | 46 | ||||||||||||||||||||||||||||||||||
| Fund X | 406 | 123 | — | 123 | 207 | — | 207 | ||||||||||||||||||||||||||||||||||
| Fund IX | 1,291 | (260) | 138 | (122) | (306) | 216 | (90) | ||||||||||||||||||||||||||||||||||
Fund VIII2
|
3 | (8) | 1 | (7) | (16) | 3 | (13) | ||||||||||||||||||||||||||||||||||
| Fund VI | 35 | — | 2 | 2 | — | 4 | 4 | ||||||||||||||||||||||||||||||||||
| HVF I | 66 | 6 | 1 | 7 | 6 | 4 | 10 | ||||||||||||||||||||||||||||||||||
| HVF II | 138 | 8 | 15 | 23 | (30) | 86 | 56 | ||||||||||||||||||||||||||||||||||
| MidCap FinCo | 42 | — | 9 | 9 | — | 12 | 12 | ||||||||||||||||||||||||||||||||||
Redding Ridge Holdings |
167 | 7 | 8 | 15 | 22 | 17 | 39 | ||||||||||||||||||||||||||||||||||
Other1,3
|
695 | 18 | 97 | 115 | 81 | 162 | 243 | ||||||||||||||||||||||||||||||||||
| Total | $ | 3,378 | $ | (28) | $ | 282 | $ | 254 | $ | 91 | $ | 526 | $ | 617 | |||||||||||||||||||||||||||
Total, net of profit sharing payable4/expense
|
$ | 1,572 | $ | 15 | $ | 128 | $ | 143 | $ | 29 | $ | 198 | $ | 227 | |||||||||||||||||||||||||||
1 As of June 30, 2025, certain funds had $201 million in general partner obligations to return previously distributed performance fees. The fair value gain on investments and income at the fund level needed to reverse the general partner obligations was $2.4 billion as of June 30, 2025.
| |||||||||||||||||||||||||||||||||||||||||
2 As of June 30, 2025, the remaining investments and escrow cash of Fund VIII was valued at 83% of the fund’s unreturned capital, which was below the required escrow ratio of 115%. As a result, the fund is required to place in escrow current and future performance fee distributions to the general partner until the specified return ratio of 115% is met (at the time of a future distribution) or upon liquidation. As of June 30, 2025, Fund VIII had $138 million of gross performance fees or $76 million net of profit sharing, in escrow. With respect to Fund VIII, realized performance fees currently distributed to the general partner are limited to potential tax distributions and interest on escrow balances per the fund’s partnership agreement. Performance fees receivable as of June 30, 2025 and realized performance fees for the three and six months ended June 30, 2025 include interest earned on escrow balances that is not subject to contingent repayment.
| |||||||||||||||||||||||||||||||||||||||||
3 Other includes certain SIAs.
| |||||||||||||||||||||||||||||||||||||||||
4 There was a corresponding profit sharing payable of $1.8 billion as of June 30, 2025, including profit sharing payable related to amounts in escrow and contingent consideration obligations of $61 million.
| |||||||||||||||||||||||||||||||||||||||||
The general partners of certain of the funds we manage accrue performance fees, categorized as performance allocations, when the fair value of investments exceeds the cost basis of the individual investors’ investments in the fund, including any allocable share of expenses incurred in connection with such investments, which we refer to as “high water marks.” These high water marks are applied on an individual investor basis. Certain of the funds we manage have investors with various high water marks, the achievement of which is subject to market conditions and investment performance.
Performance fees from certain funds we manage are subject to contingent repayment by the general partner in the event of future losses to the extent that the cumulative performance fees distributed from inception to date exceeds the amount computed as due to the general partner at the final distribution. These general partner obligations, if applicable, are included in due to related parties on the condensed consolidated statements of financial condition.
106
The following table summarizes our performance fees since inception through June 30, 2025:
Performance Fees Since Inception1
|
|||||||||||||||||||||||||||||
| (In millions) | Undistributed by Fund and Recognized |
Distributed by Fund and Recognized2
|
Total Undistributed and Distributed by Fund and Recognized3
|
General Partner Obligation3
|
Maximum Performance Fees Subject to Potential Reversal4
|
||||||||||||||||||||||||
| Accord and Accord+ Funds | $ | 126 | $ | 47 | $ | 173 | $ | — | $ | 126 | |||||||||||||||||||
| AIOF I, II and III | 61 | 66 | 127 | — | 67 | ||||||||||||||||||||||||
| ANRP I, II and III | 76 | 199 | 275 | — | 142 | ||||||||||||||||||||||||
| Athora | 46 | — | 46 | — | 46 | ||||||||||||||||||||||||
| Credit Strategies | 46 | 486 | 532 | — | 45 | ||||||||||||||||||||||||
| EPF Funds | 25 | 572 | 597 | 116 | 36 | ||||||||||||||||||||||||
| FCI Funds | 90 | 24 | 114 | — | 90 | ||||||||||||||||||||||||
| Freedom Parent Holdings | 65 | 108 | 173 | — | 56 | ||||||||||||||||||||||||
| Fund X | 406 | — | 406 | — | 406 | ||||||||||||||||||||||||
| Fund IX | 1,291 | 1,513 | 2,804 | — | 1,997 | ||||||||||||||||||||||||
| Fund VIII | 3 | 1,784 | 1,787 | 63 | 1,174 | ||||||||||||||||||||||||
| Fund VII | — | 3,271 | 3,271 | — | — | ||||||||||||||||||||||||
| Fund VI | 35 | 1,664 | 1,699 | — | — | ||||||||||||||||||||||||
| Fund IV and Fund V | — | 2,023 | 2,023 | 1 | — | ||||||||||||||||||||||||
| HVF I | 66 | 256 | 322 | — | 192 | ||||||||||||||||||||||||
| HVF II | 138 | 86 | 224 | — | 176 | ||||||||||||||||||||||||
| MidCap FinCo | 42 | 166 | 208 | — | 42 | ||||||||||||||||||||||||
| Redding Ridge Holdings | 167 | — | 167 | — | 151 | ||||||||||||||||||||||||
Other5
|
695 | 2,752 | 3,447 | 21 | 842 | ||||||||||||||||||||||||
| Total | $ | 3,378 | $ | 15,017 | $ | 18,395 | $ | 201 | $ | 5,588 | |||||||||||||||||||
1 Certain funds are denominated in euros and historical figures are translated into U.S. dollars at an exchange rate of €1.00 to $1.18 as of June 30, 2025. Certain funds are denominated in pounds sterling and historical figures are translated into U.S. dollars at an exchange rate of £1.00 to $1.37 as of June 30, 2025.
| |||||||||||||||||||||||||||||
2 Amounts exclude certain performance fees from business development companies and Redding Ridge Holdings, an affiliate of Redding Ridge.
| |||||||||||||||||||||||||||||
3 Amounts were computed based on the fair value of fund investments on June 30, 2025. Performance fees have been allocated to and recognized by the general partner. Based on the amount allocated, a portion is subject to potential reversal or, to the extent applicable, has been reduced by the general partner obligation to return previously distributed performance fees at June 30, 2025. The actual determination and any required payment of any such general partner obligation would not take place until the final disposition of the fund’s investments based on contractual termination of the fund.
| |||||||||||||||||||||||||||||
4 Represents the amount of performance fees that would be reversed if remaining fund investments became worthless on June 30, 2025. Amounts subject to potential reversal of performance fees include amounts undistributed by a fund (i.e., the performance fees receivable), as well as a portion of the amounts that have been distributed by a fund, net of taxes and not subject to a general partner obligation to return previously distributed performance fees, except for those funds that are gross of taxes as defined in the respective funds’ governing documents.
| |||||||||||||||||||||||||||||
5 Other includes certain SIAs.
| |||||||||||||||||||||||||||||
Expenses
Compensation and Benefits
The most significant expense in our asset management business is compensation and benefits expense. This consists of fixed salary, discretionary and non-discretionary bonuses, profit sharing expense associated with the performance fees earned and compensation expense associated with the vesting of non-cash equity-based awards.
Our compensation arrangements with certain employees contain a significant performance-based incentive component. Therefore, as our net revenues increase, our compensation costs rise. Our compensation costs also reflect the increased investment in people as we expand geographically and create new funds.
In addition, certain professionals and selected other individuals have a profit sharing interest in the performance fees earned in order to better align their interests with our own and with those of the investors in the funds we manage. Profit sharing expense is part of our compensation and benefits expense and is generally based upon a fixed percentage of performance fees. Certain of our performance-based incentive arrangements provide for compensation based on realized performance fees which includes fees earned by the general partners of the funds we manage under the applicable fund limited partnership agreements based upon transactions that have closed or other rights to incentive income cash that have become fixed in the applicable calendar
107
year period. Profit sharing expense can reverse during periods when there is a decline in performance fees that were previously recognized. Profit sharing amounts are normally distributed to employees after the corresponding investment gains have been realized. Therefore, changes in our unrealized performance fees have the same effect on our profit sharing expense. Profit sharing expense increases when unrealized performance fees increase. Realizations only impact profit sharing expense to the extent that the effects on investments have not been recognized previously. If losses on other investments within a fund are subsequently realized, the profit sharing amounts previously distributed are normally subject to a general partner obligation to return performance fees previously distributed back to the funds. This general partner obligation due to the funds would generally be realized only when the fund is liquidated, which generally occurs at the end of the fund’s term. However, indemnification obligations also exist for realized gains with respect to certain funds, which, although our Former Managing Partners and Contributing Partners would remain personally liable, may indemnify our Former Managing Partners and Contributing Partners for 17.5% to 100% of the previously distributed profits regardless of the fund’s future performance. See note 15 to our condensed consolidated financial statements for further information regarding the Company’s indemnification liability.
The Company grants equity awards to certain employees, including RSUs and restricted shares of common stock, that generally vest and become exercisable in quarterly installments or annual installments depending on the award terms. In some instances, vesting of an RSU is also subject to the Company’s receipt of performance fees, within prescribed periods, sufficient to cover the associated equity-based compensation expense. See note 12 to our condensed consolidated financial statements for further discussion of equity-based compensation.
Other expenses
The balance of our other expenses includes interest, placement fees, and general, administrative and other operating expenses. Interest expense consists primarily of interest related to the senior and subordinated notes as discussed in note 11 to our condensed consolidated financial statements. Placement fees are incurred in connection with our capital raising activities. In cases where the limited partners of the funds are determined to be the customer in an arrangement, placement fees may be capitalized as a cost to acquire a customer contract, and amortized over the life of the customer contract. General, administrative and other expenses includes occupancy expense, depreciation and amortization, professional fees and costs related to travel, information technology and administration. Occupancy expense represents charges related to office leases and associated expenses, such as utilities and maintenance fees. Depreciation and amortization of fixed assets is normally calculated using the straight-line method over their estimated useful lives, ranging from two to sixteen years, taking into consideration any residual value. Leasehold improvements are amortized over the shorter of the useful life of the asset or the expected term of the lease. Intangible assets are amortized based on the future cash flows over the expected useful lives of the assets.
Other Income (Loss)
Net Gains (Losses) from Investment Activities
Net gains (losses) from investment activities include both realized gains and losses and the change in unrealized gains and losses in our investment portfolio between the opening reporting date and the closing reporting date. Net unrealized gains (losses) are a result of changes in the fair value of unrealized investments and reversal of unrealized gains (losses) due to dispositions of investments during the reporting period. Significant judgment and estimation goes into the assumptions that drive these models and the actual values realized with respect to investments could be materially different from values obtained based on the use of those models. The valuation methodologies applied impact the reported value of investment company holdings and their underlying portfolios in our condensed consolidated financial statements.
Net Gains (Losses) from Investment Activities of Consolidated Variable Interest Entities (“VIEs”)
Changes in the fair value of the consolidated VIEs’ assets and liabilities and related interest, dividend and other income and expenses subsequent to consolidation are presented within net gains (losses) from investment activities of consolidated variable interest entities and are attributable to non-controlling interests in the condensed consolidated statements of operations.
Other Income (Losses), Net
Other income (losses), net includes interest income, gains (losses) arising from the remeasurement of foreign currency denominated assets and liabilities, remeasurement of the tax receivable agreement liability and other miscellaneous non-operating income and expenses.
108
Financial Measures under U.S. GAAP - Retirement Services
The following discussion of financial measures under U.S. GAAP is based on the Company’s retirement services business, which is operated by Athene, as of June 30, 2025.
Revenues
Premiums
Premiums for long-duration contracts, including products with fixed and guaranteed premiums and benefits, are recognized as revenue when due from policyholders. Insurance revenues are reported net of reinsurance ceded.
Product charges
Revenues for universal life-type policies and investment contracts, including surrender and market value adjustments, costs of insurance, policy administration, GMDB, GLWB and no-lapse guarantee charges, are earned when assessed against policyholder account balances during the period.
Net investment income
Net investment income is a significant component of Athene’s total revenues. Athene recognizes investment income as it accrues or is legally due, net of investment management and custody fees. Investment income on fixed maturity securities includes coupon interest, as well as the amortization of any premium and the accretion of any discount. Investment income on equity securities represents dividend income and preferred coupon interest.
Investment related gains (losses)
Investment related gains (losses) primarily consist of (i) realized gains and losses on sales of investments, (ii) unrealized gains or losses relating to identified risks within AFS securities in fair value hedging relationships, (iii) gains and losses on trading securities, (iv) gains and losses on equity securities, (v) changes in the fair value of the embedded derivatives and derivatives not designated as a hedge, (vi) changes in the fair value of mortgage loan assets, (vii) foreign exchange gains and losses and (viii) changes in the provision for credit losses.
Expenses
Interest sensitive contract benefits
Universal life-type policies and investment contracts include traditional deferred annuities; indexed annuities consisting of fixed indexed, index-linked variable annuities in the accumulation phase, and assumed indexed universal life without significant mortality risk; funding agreements; immediate annuities without significant mortality risk (which include pension group annuities without life contingencies); universal life insurance; and other investment contracts inclusive of assumed endowments without significant mortality risk. Liabilities for traditional deferred annuities, indexed annuities, funding agreements and universal life insurance are carried at the account balances without reduction for potential surrender or withdrawal charges, except for a block of universal life business ceded to Global Atlantic Financial Group Limited (together with its subsidiaries, “Global Atlantic”), which is carried at fair value. Fixed indexed annuity, index-linked variable annuity and indexed universal life insurance contracts contain an embedded derivative. Benefit reserves for these contracts are reported as the sum of the fair value of the embedded derivative and the host (or guaranteed) component of the contracts. The fair value of the embedded derivatives represents the present value of cash flows attributable to the indexed strategies. The host contract is established at contract inception as the initial account value less the initial fair value of the embedded derivative and accreted over the policy’s life. Liabilities for immediate annuities without significant mortality risk are calculated as the present value of future liability cash flows and policy maintenance expenses discounted at contractual interest rates. Certain contracts are offered with additional contract features that meet the definition of a market risk benefit. See “—Market risk benefits remeasurement (gains) losses” below for further information.
Changes in interest sensitive contract liabilities, excluding deposits and withdrawals, are recorded in interest sensitive contract benefits or product charges on the condensed consolidated statements of operations.
109
Future policy and other policy benefits
Athene issues or reinsures contracts classified as long-duration, which include term and whole life, accident and health, disability, and deferred and immediate annuities with life contingencies (which include pension group annuities with life contingencies).
Liabilities for nonparticipating long-duration contracts are established as the estimated present value of benefits Athene expects to pay to or on behalf of the policyholder and related expenses less the present value of the net premiums to be collected, referred to as the net premium ratio. Liabilities for nonparticipating long-duration contracts are established using accepted actuarial valuation methods which require the use of assumptions related to discount rate, expenses, longevity, mortality, morbidity, persistency and other policyholder behavior. The liability for nonparticipating long-duration contracts is discounted using an upper-medium grade fixed income instrument yield aligned to the characteristics of the liability, including the duration and currency of the underlying cash flows.
Changes in the value of the liability for nonparticipating long-duration contracts due to changes in the discount rate are recognized as a component of OCI on the condensed consolidated statements of comprehensive income (loss). Changes in the liability for remeasurement gains or losses and all other changes in the liability are recorded in future policy and other policy benefits on the condensed consolidated statements of operations.
Future policy benefits include liabilities for no-lapse guarantees on universal life insurance and fixed indexed universal life insurance. Each reporting period, expected excess benefits and assessments are updated with actual excess benefits and assessments. Athene also periodically revises the key assumptions used in the calculation of the liabilities that result in revisions to the expected excess benefits and assessments. The effects of changes in assumptions are recorded as unlocking in the period in which the changes are made. Changes in the liabilities associated with no-lapse guarantees are recorded in future policy and other policy benefits on the condensed consolidated statements of operations.
Market risk benefits remeasurement (gains) losses
Market risk benefits represent contracts or contract features that both provide protection to the contract holder from, and expose the insurance entity to, other-than-nominal capital market risk. Athene’s deferred annuity contracts contain GLWB and GMDB riders that meet the criteria for, and are classified as, market risk benefits.
Market risk benefits are measured at fair value at the contract level and may be recorded as a liability or an asset, which are included in market risk benefits or other assets, respectively, on the condensed consolidated statements of financial condition. Fees and assessments collectible from the policyholder at contract inception are allocated to the extent they are attributable to the market risk benefit. If the fees are sufficient to cover the projected benefits, a non-option based valuation model is used. If the fees are insufficient to cover the projected benefits, an option-based valuation model is used to compute the market risk benefit liability at contract inception, with an equal and offsetting adjustment recognized in interest sensitive contract liabilities.
Changes in fair value of market risk benefits are recorded in market risk benefits remeasurement (gains) losses on the condensed consolidated statements of operations, excluding portions attributed to changes in instrument-specific credit risk, which are recorded in OCI on the condensed consolidated statements of comprehensive income (loss). Ceded market risk benefits are measured at fair value and recorded within reinsurance recoverable on the condensed consolidated statements of financial condition.
Amortization of deferred acquisition costs, deferred sales inducements, and value of business acquired
Costs related directly to the successful acquisition of new, or the renewal of existing, insurance or investment contracts are deferred. These costs consist of commissions and policy issuance costs, as well as sales inducements credited to policyholder account balances, and are included in deferred acquisition costs, deferred sales inducements and value of business acquired on the condensed consolidated statements of financial condition.
Deferred costs related to universal life-type policies and investment contracts with significant revenue streams from sources other than investment of the policyholder funds are grouped into cohorts based on issue year and contract type and amortized on a constant level basis over the expected term of the related contracts. The cohorts and assumptions used for the amortization of deferred costs are consistent with those used in estimating the related liabilities for these contracts. Deferred costs related to
110
investment contracts without significant revenue streams from sources other than investment of the policyholder funds are amortized using the effective interest method. The effective interest method amortizes the deferred costs by discounting the future liability cash flows at a break-even rate. The break-even rate is solved for such that the present value of future liability cash flows is equal to the net liability at the inception of the contract. VOBA associated with acquired contracts can be either positive or negative and is amortized in relation to respective policyholder liabilities. Significant assumptions that impact VOBA amortization are consistent with those that impact the measurement of policyholder liabilities.
Amortization of DAC, DSI and VOBA is included in amortization of deferred acquisition costs, deferred sales inducements and value of business acquired on the condensed consolidated statements of operations.
Policy and other operating expenses
Policy and other operating expenses include normal operating expenses, policy acquisition expenses, interest expense, dividends to policyholders, integration, restructuring and other non-operating expenses and stock compensation expenses.
Other Financial Measures under U.S. GAAP
Income Taxes
Significant judgment is required in determining the provision for income taxes and in evaluating income tax positions, including evaluating uncertainties. We recognize the income tax benefits of uncertain tax positions only where the position is “more likely than not” to be sustained upon examination, including resolution of any related appeals or litigation, based on the technical merits of the positions. The tax benefit is measured as the largest amount of benefit that has a greater than 50% likelihood of being realized upon ultimate settlement. If a tax position is not considered more likely than not to be sustained, then no benefits of the position are recognized. The Company’s income tax positions are reviewed and evaluated quarterly to determine whether or not we have uncertain tax positions that require financial statement recognition or de-recognition.
Deferred tax assets and liabilities are recognized for the expected future tax consequences, using currently enacted tax rates, of differences between the carrying amount of assets and liabilities and their respective tax basis. The effect on deferred tax assets and liabilities of a change in tax rates is recognized in income in the period when the change is enacted. Deferred tax assets are reduced by a valuation allowance when it is more likely than not that some portion or all of the deferred tax assets will not be realized.
Non-Controlling Interests
For entities that are consolidated, but not 100% owned, a portion of the income or loss and corresponding equity is allocated to owners other than Apollo. The aggregate of the income or loss and corresponding equity that is not owned by the Company is included in non-controlling interests in the condensed consolidated financial statements. Non-controlling interests primarily include limited partner interests in certain consolidated funds and VIEs.
The authoritative guidance for non-controlling interests in the condensed consolidated financial statements requires reporting entities to present non-controlling interest as equity and provides guidance on the accounting for transactions between an entity and non-controlling interests. According to the guidance, (1) non-controlling interests are presented as a separate component of stockholders’ equity on the Company’s condensed consolidated statements of financial condition, (2) net income (loss) includes the net income (loss) attributable to the non-controlling interest holders on the Company’s condensed consolidated statements of operations, and (3) profits and losses are allocated to non-controlling interests in proportion to their ownership interests regardless of their basis.
111
Managing Business Performance - Key Segment and Non-U.S. GAAP Performance Measures
We believe that the presentation of Segment Income supplements a reader’s understanding of the economic operating performance of each of our segments.
Segment Income and Adjusted Net Income
Segment Income is the key performance measure used by management in evaluating the performance of the Asset Management, Retirement Services, and Principal Investing segments. See note 17 to the condensed consolidated financial statements for more details regarding the components of Segment Income and management’s consideration of Segment Income.
We believe that Segment Income is helpful for an understanding of our business and that investors should review the same supplemental financial measure that management uses to analyze our segment performance. This measure supplements and should be considered in addition to and not in lieu of the results of operations discussed above in “—Overview of Results of Operations” that have been prepared in accordance with U.S. GAAP.
Adjusted Net Income (“ANI”) represents Segment Income less HoldCo interest and other financing costs and estimated income taxes. For purposes of calculating the Adjusted Net Income tax rate, Segment Income is reduced by HoldCo interest and financing costs. Income taxes on FRE and PII represents the total current corporate, local, and non-U.S. taxes as well as the current payable under Apollo’s tax receivable agreement. Income taxes on FRE and PII excludes the impacts of deferred taxes and the remeasurement of the tax receivable agreement, which arise from changes in estimated future tax rates. Certain assumptions and methodologies that impact the implied FRE and PII income tax provision are similar to those used under U.S. GAAP. Specifically, certain deductions considered in the income tax provision under U.S. GAAP relating to transaction-related costs, equity-based compensation, charitable contributions and tax deductible interest expense are taken into account for the implied tax provision. Income Taxes on SRE represent the total current and deferred tax expense or benefit on income before taxes adjusted to eliminate the impact of the tax expense or benefit associated with the non-operating adjustments. Management believes the methodologies used to compute income taxes on FRE, SRE, and PII are meaningful to each segment and increases comparability of income taxes between periods.
Fee Related Earnings, Spread Related Earnings and Principal Investing Income
Fee Related Earnings, or “FRE”, is a component of Segment Income that is used to assess the performance of the Asset Management segment.
Spread Related Earnings, or “SRE”, is a component of Segment Income that is used to assess the performance of the Retirement Services segment, excluding certain market volatility, which consists of investment gains (losses), net of offsets and non-operating change in insurance liabilities and related derivatives, and certain expenses related to integration, restructuring, equity-based compensation, and other expenses.
Non-operating change in insurance liabilities and related derivatives includes the change in fair values of derivatives and embedded derivatives, non-operating change in funding agreements, change in fair value of market risk benefits, and non-operating change in liability for future policy benefits.
Principal Investing Income, or “PII”, is a component of Segment Income that is used to assess the performance of the Principal Investing segment.
See note 17 to the condensed consolidated financial statements for more details regarding the components of FRE, SRE, and PII.
We use Segment Income, ANI, FRE, SRE and PII as measures of operating performance, not as measures of liquidity. These measures should not be considered in isolation or as a substitute for net income or other income data prepared in accordance with U.S. GAAP. The use of these measures without consideration of their related U.S. GAAP measures is not adequate due to the adjustments described above.
112
Net Invested Assets
In managing its business, Athene analyzes net invested assets, which does not correspond to total Athene investments, including investments in related parties, as disclosed in the condensed consolidated statements of financial condition and notes thereto. Net invested assets represent the investments that directly back Athene’s net reserve liabilities, as well as surplus assets. Net invested assets is used in the computation of net investment earned rate, which is used to analyze the profitability of Athene’s investment portfolio. Net invested assets include (a) total investments on the condensed consolidated statements of financial condition with AFS securities, trading securities and mortgage loans at cost or amortized cost, excluding derivatives, (b) cash and cash equivalents and restricted cash, (c) investments in related parties, (d) accrued investment income, (e) VIE and VOE assets, liabilities and non-controlling interest adjustments, (f) net investment payables and receivables, (g) policy loans ceded (which offset the direct policy loans in total investments) and (h) an adjustment for the allowance for credit losses. Net invested assets exclude the derivative collateral offsetting the related cash positions. Athene includes the underlying investments supporting its assumed funds withheld and modco agreements and excludes the underlying investments related to ceded reinsurance transactions in its net invested assets calculation in order to match the assets with the income received. Athene believes the adjustments for reinsurance provide a view of the assets for which it has economic exposure. Net invested assets include Athene’s proportionate share of ACRA investments, based on its economic ownership, but do not include the proportionate share of investments associated with the non-controlling interests. Net invested assets are averaged over the number of quarters in the relevant period to compute a net investment earned rate for such period. While Athene believes net invested assets is a meaningful financial metric and enhances the understanding of the underlying drivers of its investment portfolio, it should not be used as a substitute for Athene’s total investments, including related parties, presented under U.S. GAAP.
113
Results of Operations
Below is a discussion of our condensed consolidated statements of operations for the three and six months ended June 30, 2025 and 2024. For additional analysis of the factors that affected our results at the segment level, see “—Segment Analysis” below:
| Three months ended June 30, | Total Change |
Percentage Change |
Six months ended June 30, | Total Change |
Percentage Change |
||||||||||||||||||||||||||||||||||||||||||
| (In millions, except percentages) | 2025 | 2024 | 2025 | 2024 | |||||||||||||||||||||||||||||||||||||||||||
| Revenues | |||||||||||||||||||||||||||||||||||||||||||||||
| Asset Management | |||||||||||||||||||||||||||||||||||||||||||||||
| Management fees | $ | 583 | $ | 462 | $ | 121 | 26.2% | $ | 1,091 | $ | 900 | $ | 191 | 21.2% | |||||||||||||||||||||||||||||||||
| Advisory and transaction fees, net | 277 | 267 | 10 | 3.7 | 472 | 436 | 36 | 8.3 | |||||||||||||||||||||||||||||||||||||||
| Investment income (loss) | 189 | 278 | (89) | (32.0) | 492 | 680 | (188) | (27.6) | |||||||||||||||||||||||||||||||||||||||
| Incentive fees | 58 | 47 | 11 | 23.4 | 98 | 73 | 25 | 34.2 | |||||||||||||||||||||||||||||||||||||||
| 1,107 | 1,054 | 53 | 5.0 | 2,153 | 2,089 | 64 | 3.1 | ||||||||||||||||||||||||||||||||||||||||
| Retirement Services | |||||||||||||||||||||||||||||||||||||||||||||||
| Premiums | 107 | 673 | (566) | (84.1) | 234 | 774 | (540) | (69.8) | |||||||||||||||||||||||||||||||||||||||
| Product charges | 274 | 251 | 23 | 9.2 | 539 | 489 | 50 | 10.2 | |||||||||||||||||||||||||||||||||||||||
| Net investment income | 4,776 | 3,804 | 972 | 25.6 | 9,117 | 7,380 | 1,737 | 23.5 | |||||||||||||||||||||||||||||||||||||||
| Investment related gains (losses) | (5) | (134) | 129 | (96.3) | (833) | 1,543 | (2,376) | NM | |||||||||||||||||||||||||||||||||||||||
| Revenues of consolidated variable interest entities | 550 | 366 | 184 | 50.3 | 1,142 | 777 | 365 | 47.0 | |||||||||||||||||||||||||||||||||||||||
| Other revenues | 5 | 4 | 1 | 25.0 | 10 | 6 | 4 | 66.7 | |||||||||||||||||||||||||||||||||||||||
| 5,707 | 4,964 | 743 | 15.0 | 10,209 | 10,969 | (760) | (6.9) | ||||||||||||||||||||||||||||||||||||||||
| Total Revenues | 6,814 | 6,018 | 796 | 13.2 | 12,362 | 13,058 | (696) | (5.3) | |||||||||||||||||||||||||||||||||||||||
| Expenses | |||||||||||||||||||||||||||||||||||||||||||||||
| Asset Management | |||||||||||||||||||||||||||||||||||||||||||||||
| Compensation and benefits: | |||||||||||||||||||||||||||||||||||||||||||||||
| Salary, bonus and benefits | 330 | 291 | 39 | 13.4 | 656 | 560 | 96 | 17.1 | |||||||||||||||||||||||||||||||||||||||
| Equity-based compensation | 155 | 142 | 13 | 9.2 | 293 | 318 | (25) | (7.9) | |||||||||||||||||||||||||||||||||||||||
| Profit sharing expense | 117 | 171 | (54) | (31.6) | 398 | 393 | 5 | 1.3 | |||||||||||||||||||||||||||||||||||||||
| Total compensation and benefits | 602 | 604 | (2) | (0.3) | 1,347 | 1,271 | 76 | 6.0 | |||||||||||||||||||||||||||||||||||||||
| Interest expense | 60 | 53 | 7 | 13.2 | 120 | 104 | 16 | 15.4 | |||||||||||||||||||||||||||||||||||||||
| General, administrative and other | 370 | 319 | 51 | 16.0 | 678 | 559 | 119 | 21.3 | |||||||||||||||||||||||||||||||||||||||
| 1,032 | 976 | 56 | 5.7 | 2,145 | 1,934 | 211 | 10.9 | ||||||||||||||||||||||||||||||||||||||||
| Retirement Services | |||||||||||||||||||||||||||||||||||||||||||||||
| Interest sensitive contract benefits | 3,428 | 1,824 | 1,604 | 87.9 | 4,922 | 4,708 | 214 | 4.5 | |||||||||||||||||||||||||||||||||||||||
| Future policy and other policy benefits | 527 | 1,095 | (568) | (51.9) | 1,068 | 1,638 | (570) | (34.8) | |||||||||||||||||||||||||||||||||||||||
| Market risk benefits remeasurement (gains) losses | (111) | (16) | (95) | NM | 274 | (170) | 444 | NM | |||||||||||||||||||||||||||||||||||||||
| Amortization of deferred acquisition costs, deferred sales inducements and value of business acquired | 292 | 227 | 65 | 28.6 | 559 | 434 | 125 | 28.8 | |||||||||||||||||||||||||||||||||||||||
| Policy and other operating expenses | 550 | 478 | 72 | 15.1 | 1,092 | 931 | 161 | 17.3 | |||||||||||||||||||||||||||||||||||||||
| 4,686 | 3,608 | 1,078 | 29.9 | 7,915 | 7,541 | 374 | 5.0 | ||||||||||||||||||||||||||||||||||||||||
| Total Expenses | 5,718 | 4,584 | 1,134 | 24.7 | 10,060 | 9,475 | 585 | 6.2 | |||||||||||||||||||||||||||||||||||||||
Other income (loss) – Asset Management |
|||||||||||||||||||||||||||||||||||||||||||||||
| Net gains (losses) from investment activities | (268) | (21) | (247) | NM | (286) | 18 | (304) | NM | |||||||||||||||||||||||||||||||||||||||
| Net gains (losses) from investment activities of consolidated variable interest entities | 4 | 1 | 3 | 300.0 | 215 | 26 | 189 | NM | |||||||||||||||||||||||||||||||||||||||
| Other income (loss), net | 13 | 24 | (11) | (45.8) | (205) | (2) | (203) | NM | |||||||||||||||||||||||||||||||||||||||
| Total Other income (loss) | (251) | 4 | (255) | NM | (276) | 42 | (318) | NM | |||||||||||||||||||||||||||||||||||||||
| Income (loss) before income tax (provision) benefit | 845 | 1,438 | (593) | (41.2) | 2,026 | 3,625 | (1,599) | (44.1) | |||||||||||||||||||||||||||||||||||||||
| Income tax (provision) benefit | (3) | (261) | 258 | (98.9) | (246) | (683) | 437 | (64.0) | |||||||||||||||||||||||||||||||||||||||
| Net income (loss) | 842 | 1,177 | (335) | (28.5) | 1,780 | 2,942 | (1,162) | (39.5) | |||||||||||||||||||||||||||||||||||||||
| Net (income) loss attributable to non-controlling interests | (212) | (324) | 112 | (34.6) | (708) | (662) | (46) | 6.9 | |||||||||||||||||||||||||||||||||||||||
| Net income (loss) attributable to Apollo Global Management, Inc. | 630 | 853 | (223) | (26.1) | 1,072 | 2,280 | (1,208) | (53.0) | |||||||||||||||||||||||||||||||||||||||
| Preferred stock dividends | (25) | (25) | — | — | (49) | (49) | — | — | |||||||||||||||||||||||||||||||||||||||
| Net income (loss) available to Apollo Global Management, Inc. common stockholders | $ | 605 | $ | 828 | $ | (223) | (26.9)% | $ | 1,023 | $ | 2,231 | $ | (1,208) | (54.1)% | |||||||||||||||||||||||||||||||||
Note: “NM” denotes not meaningful. Changes from negative to positive amounts and positive to negative amounts are not considered meaningful. Increases or decreases from zero and changes greater than 500% are also not considered meaningful. | |||||||||||||||||||||||||||||||||||||||||||||||
114
Three Months Ended June 30, 2025 Compared to Three Months Ended June 30, 2024
In this section, references to 2025 refer to the three months ended June 30, 2025 and references to 2024 refer to the three months ended June 30, 2024.
Asset Management
Revenues
Revenues were $1,107 million in 2025, an increase of $53 million from $1,054 million in 2024, primarily driven by an increase in management fees and advisory and transaction fees, net, partially offset by a decrease in investment income.
Management fees increased by $121 million to $583 million in 2025 from $462 million in 2024. The increase in management fees was primarily attributable to management fees earned from Atlas, Apollo S3 Equity and Hybrid Solutions Fund, L.P. ("S3 Equity and Hybrid Solutions") and ADS of $42 million, $23 million and $20 million, respectively, partially offset by decreases in management fees earned from Fund IX and Fund VIII of $9 million and $4 million, respectively. Management fees in 2025 also benefited from increased management fees earned from certain strategic separately managed accounts. The increase in management fees earned from Atlas, S3 Equity and Hybrid Solutions and ADS was driven by higher fee-generating AUM due to an upsize in Atlas warehousing financing facilities, catch-up management fees for additional closes and an increase in subscriptions, respectively. The decrease in management fees earned from Fund IX and Fund VIII were correlated with the fee rate step-down of Fund IX and the expiration of Fund VIII’s fee-paying period, respectively.
Advisory and transaction fees, net increased by $10 million to $277 million in 2025 from $267 million in 2024. Advisory and transaction fees earned during 2025 were primarily attributable to advisory and transaction fees earned from companies in the (i) natural resources, (ii) financial services, (iii) manufacturing and industrial and (iv) consumer services sectors.
Investment income decreased by $89 million in 2025 to $189 million compared to $278 million in 2024. The decrease in investment income of $89 million in 2025 was primarily driven by a decrease in performance allocations of $83 million.
Significant drivers for performance allocations in 2025 were performance allocations primarily earned from Fund X, Freedom Parent Holdings, Credit Strategies, HVF II, ANRP II and Redding Ridge Holdings of $123 million, $29 million, $25 million, $23 million, $18 million and $16 million, respectively, partially offset by performance allocation losses from Fund IX of $122 million.
See below for details on the respective performance allocations in 2025.
The performance allocations earned from Fund X in 2025 were primarily driven by the appreciation and realization of the fund’s investments in the (i) manufacturing and industrial, (ii) consumer services and (iii) consumer and retail sectors.
The performance allocations earned from Freedom Parent Holdings in 2025 were primarily driven by the appreciation of its investment in Wheels, a U.S. corporate fleet lessor platform.
The performance allocations earned from Credit Strategies in 2025 were driven by the net income generated by the fund’s investments.
The performance allocations earned from HVF II in 2025 were primarily driven by the appreciation and realization of the fund’s investments in private portfolio companies in the (i) consumer and retail, (ii) consumer services and (iii) media, telecom and technology sectors.
The performance allocations earned from ANRP II in 2025 were primarily driven by the appreciation and realization of the fund's investments in the (i) natural resources and (ii) manufacturing and industrial sectors.
The performance allocations earned from Redding Ridge Holdings in 2025 were primarily driven by existing and new CLO issuances, resets, accumulation of warehouse assets, the acquisition of Irradiant Partners LP, new consulting contracts and the net income generated by the vehicle’s strategic investments.
115
The performance allocation losses from Fund IX in 2025 were primarily driven by the depreciation of the fund’s investments in the (i) leisure, (ii) media, telecom and technology and (iii) manufacturing and industrial sectors.
Expenses
Expenses were $1,032 million in 2025, an increase of $56 million from $976 million in 2024, primarily due to increases in general, administrative and other expenses, partially offset by a slight decrease in total compensation and benefits.
General, administrative and other expenses were $370 million in 2025, an increase of $51 million from $319 million in 2024. The increase in 2025 was primarily driven by increases in professional fees, depreciation and amortization expenses and higher placement fees.
Interest expense was $60 million in 2025, an increase of $7 million from $53 million in 2024. The increase in 2025 was primarily driven by higher interest rates from additional debt issuances in the full year 2024, offset, in part, by debt repayments.
Total compensation and benefits were $602 million in 2025, a decrease of $2 million from $604 million in 2024, primarily due to a decrease in profit sharing expense of $54 million, partially offset by increases in salary, bonus and benefits and equity-based compensation of $39 million and $13 million, respectively. The decrease in profit sharing expense of $54 million was correlated with the corresponding lower investment income in 2025. In any period, the blended profit sharing percentage is impacted by the respective profit sharing ratios of the funds generating performance allocations in the period. The increase in salary, bonus and benefits of $39 million was primarily driven by the growth in revenues and increased headcount in 2025. Equity-based compensation expense, in any given period, is generally comprised of: (i) performance grants which are tied to the Company’s receipt of performance fees, within prescribed periods and are typically recognized on an accelerated recognition method over the requisite service period to the extent the performance revenue metrics are met or deemed probable, and (ii) the impact of the 2021 one-time grants awarded to the then Co-Presidents of AAM, all of which vest on a cliff basis subject to continued employment over five years, and a portion of which also vest on the Company’s achievement of FRE and SRE per share metrics.
Other Income (Loss)
Other income (loss) was a loss of $251 million in 2025, a decrease of $255 million from income of $4 million in 2024. This decrease was primarily driven by decreases in net gains (losses) from investment activities and other income (loss), net of $247 million and $11 million, respectively.
The decrease in net gains (losses) from investment activities of $247 million was primarily driven by an impairment loss on an equity investment triggered by the initial public offering of the equity security which resulted in an observable transaction price below the Company’s carrying amount, as well as the depreciation in the Company’s investments in Global Business Travel Group, Inc.
Retirement Services
Retirement Services revenues were $5.7 billion in 2025, an increase of $743 million from $5.0 billion in 2024. The increase was primarily driven by an increase in net investment income, an increase in revenues of consolidated VIEs and an increase in investment related gains (losses), partially offset by a decrease in premiums.
Net investment income was $4.8 billion in 2025, an increase of $972 million from $3.8 billion in 2024, primarily driven by significant growth in Athene’s investment portfolio attributable to strong net flows during the previous twelve months, higher rates on new deployment in comparison to Athene’s existing portfolio related to the higher interest rate environment, earlier deployment into assets during the quarter compared to 2024 and more favorable investment fund performance in 2025. These impacts were partially offset by lower floating rate income.
Revenues of consolidated VIEs were $550 million in 2025, an increase of $184 million from $366 million in 2024, primarily driven by growth and investment performance within AAA related to favorable returns on the underlying assets as well as underperformance from certain investment funds held in VIEs in 2024 that were subsequently deconsolidated.
Investment related gains (losses) were $(5) million in 2025, an increase of $129 million from $(134) million in 2024, primarily driven by a favorable change in fair value of FIA hedging derivatives, reinsurance assets, trading securities and mortgage loans,
116
partially offset by unfavorable net foreign exchange impacts and an increase in realized losses on AFS securities. The change in fair value of FIA hedging derivatives increased $758 million, primarily driven by the favorable performance of the equity indices upon which Athene’s call options are based. The largest percentage of Athene’s call options are based on the S&P 500 Index, which increased 10.6% in 2025, compared to an increase of 3.9% in 2024. The change in fair value of reinsurance assets increased $153 million, the change in fair value of trading securities increased $96 million and the change in fair value of mortgage loans increased $91 million, primarily driven by a decrease in U.S. Treasury rates in 2025 compared to an increase in 2024. The unfavorable net foreign exchange impacts were primarily related to the weakening of the U.S. dollar against foreign currencies in 2025 compared to 2024, including the impact from derivatives not designated as a hedge where the foreign exchange impact on the related asset is reported through AOCI.
Premiums were $107 million in 2025, a decrease of $566 million from $673 million in 2024, primarily driven by a $576 million decrease in pension group annuity premiums compared to 2024.
Expenses
Retirement Services expenses were $4.7 billion in 2025, an increase of $1.1 billion from $3.6 billion in 2024. The increase was primarily driven by an increase in interest sensitive contract benefits, an increase in policy and other operating expenses and an increase in the amortization of DAC, DSI and VOBA, partially offset by a decrease in future policy and other policy benefits and a decrease in market risk benefits remeasurement (gains) losses.
Interest sensitive contract benefits were $3.4 billion in 2025, an increase of $1.6 billion from $1.8 billion in 2024, primarily driven by an increase in the change in FIA reserves, significant growth in Athene’s deferred annuity and funding agreement blocks of business, higher rates on new deferred annuity and funding agreement issuances in comparison to its existing blocks of business and earlier origination of new business within the quarter compared to 2024. These impacts were partially offset by lower rates on floating rate funding agreements. The change in Athene’s FIA reserves includes the impact from changes in the fair value of FIA embedded derivatives. The increase in the change in fair value of FIA embedded derivatives of $1.1 billion was primarily due to the performance of the equity indices to which Athene’s FIA policies are linked. The largest percentage of Athene’s FIA policies are linked to the S&P 500 Index, which increased 10.6% in 2025, compared to an increase of 3.9% in 2024. The change in fair value of FIA embedded derivatives was also driven by the unfavorable change in discount rates used in Athene’s embedded derivative calculations as 2025 experienced a decrease in discount rates compared to an increase in 2024.
Policy and other operating expenses were $550 million in 2025, an increase of $72 million from $478 million in 2024, primarily driven by an increase in interest expense and policy acquisition expenses related to significant growth. The increase in interest expense was primarily due to an increase in host accretion on business ceded to Catalina, as well as interest related to additional issuances of long-term debt in the fourth quarter of 2024 and second quarter of 2025.
Amortization of DAC, DSI and VOBA was $292 million in 2025, an increase of $65 million from $227 million in 2024, primarily driven by an increase in acquisition costs that are deferred and amortized due to strong growth in Athene’s deferred annuity business.
Future policy and other policy benefits were $527 million in 2025, a decrease of $568 million from $1.1 billion in 2024, primarily driven by a $576 million decrease in pension group annuity obligations compared to 2024.
Market risk benefits remeasurement (gains) losses were $(111) million in 2025, a decrease of $95 million from $(16) million in 2024. The larger gains in 2025 compared to 2024 were primarily driven by a favorable change in the fair value of market risk benefits. The change in fair value of market risk benefits was $60 million favorable due to an increase in risk-free discount rates across the long end of the curve compared to 2024, which is used in the fair value measurement of the liability for market risk benefits, and $42 million favorable related to favorable equity market performance compared to 2024.
Income Tax (Provision) Benefit
The Company’s income tax provision totaled $3 million and $261 million in 2025 and 2024, respectively. The change to the provision was primarily related to the decline in pretax income subject to tax. The (provision) for income taxes includes federal, state, local and foreign income taxes resulting in an effective income tax rate of 0.4% and 18.2% for 2025 and 2024, respectively. The most significant reconciling items between the U.S. federal statutory income tax rate and the effective income tax rate were due to the following: (i) foreign, state and local income taxes, including NYC UBT, (ii) income attributable to non-controlling interests, (iii) equity-based compensation net of the limiting provisions for executive compensation under IRC
117
Section 162(m), and (iv) Bermuda CIT. See note 10 to the condensed consolidated financial statements for further details regarding the Company’s income tax (provision).
Six Months Ended June 30, 2025 Compared to Six Months Ended June 30, 2024
In this section, references to 2025 refer to the six months ended June 30, 2025 and references to 2024 refer to the six months ended June 30, 2024.
Asset Management
Revenues
Revenues were $2,153 million in 2025, an increase of $64 million from $2,089 million in 2024, primarily driven by an increase in management fees and advisory and transaction fees, net, partially offset by a decrease in investment income.
Management fees increased by $191 million to $1,091 million in 2025 from $900 million in 2024. The increase in management fees was primarily attributable to management fees earned from Atlas, S3 Equity and Hybrid Solutions and ADS of $67 million, $39 million, and $38 million, respectively, partially offset by decreases in management fees earned from Fund IX and Fund VIII of $19 million and $8 million, respectively. Management fees in 2025 also benefited from increased management fees earned from certain strategic separately managed accounts. The increase in management fees earned from Atlas, S3 Equity and Hybrid Solutions and ADS was driven by higher fee-generating AUM due to an upsize in Atlas warehousing financing facilities, catch-up management fees on additional closes and an increase in subscriptions, respectively. The decrease in management fees earned from Fund IX and Fund VIII were correlated with the fee rate step-down of Fund IX and the expiration of Fund VIII’s fee-paying period, respectively.
Advisory and transaction fees increased by $36 million to $472 million in 2025 from $436 million in 2024. Advisory and transaction fees earned during 2025 were primarily attributable to advisory and transaction fees earned from companies in the (i) financial services, (ii) natural resources, (iii) manufacturing and industrial and (iv) consumer services sectors.
Investment income decreased $188 million in 2025 to $492 million compared to $680 million in 2024. The decrease in investment income in 2025 was primarily driven by a decrease in performance allocations of $181 million.
Significant drivers for performance allocations in 2025 were performance allocations primarily earned from Fund X, HVF II, Freedom Parent Holdings, Credit Strategies, Redding Ridge Holdings and ANRP II of $207 million, $56 million, $46 million, $46 million, $38 million and $30 million, respectively, partially offset by performance allocation losses from Fund IX of $90 million.
See below for details on the respective performance allocations in 2025.
The performance allocations earned from Fund X in 2025 were primarily driven by the appreciation and realization of the fund’s investments in the (i) manufacturing and industrial, (ii) consumer and retail and (iii) consumer services sectors.
The performance allocations earned from HVF II in 2025 were primarily driven by the appreciation and realization of the fund’s investments in private portfolio companies in the (i) consumer and retail, (ii) consumer services and (iii) media, telecom and technology sectors.
The performance allocations earned from Freedom Parent Holdings in 2025 were primarily driven by the appreciation of its investment in Wheels.
The performance allocations earned from Credit Strategies in 2025 were driven by the net income generated by the fund’s investments.
The performance allocations earned from Redding Ridge Holdings in 2025 were primarily driven by existing and new CLO issuances, resets, accumulation of warehouse assets, the acquisition of Irradiant Partners LP, new consulting contracts and the net income generated by the vehicle’s strategic investments.
118
The performance allocations earned from ANRP II in 2025 were primarily driven by the appreciation and realization of the fund's investments in the (i) natural resources and (ii) manufacturing and industrial sectors.
The performance allocation losses from Fund IX in 2025 were primarily driven by the depreciation of the fund’s investments in the (i) business service, (ii) leisure and (iii) media, telecom and technology sectors.
Expenses
Expenses were $2,145 million in 2025, an increase of $211 million from $1,934 million in 2024 primarily due to increases in general, administrative and other expenses, total compensation and benefits and interest expense.
General, administrative and other expenses were $678 million in 2025, an increase of $119 million from $559 million in 2024. The increase in 2025 was primarily driven by increases in professional fees, depreciation and amortization expenses and higher placement fees.
Total compensation and benefits were $1,347 million in 2025, an increase of $76 million from $1,271 million in 2024, primarily due to an increase in salary, bonus and benefits of $96 million, partially offset by a decrease in equity-based compensation of $25 million. The increase in salary, bonus and benefits of $96 million was primarily driven by the growth in revenues and increased headcount in 2025, whereas the decrease in equity-based compensation of $25 million was primarily due to a decrease in amortization of certain RSUs.
Interest expense was $120 million in 2025, an increase of $16 million from $104 million in 2024.The increase in 2025 was primarily driven by higher interest rates from additional debt issuances in the full year 2024, offset, in part, by debt repayments.
Other Income (Loss)
Other income (loss) was a loss of $276 million in 2025, a decrease of $318 million from income of $42 million in 2024. This decrease was primarily driven by decreases in net gains (losses) from investment activities and other income (loss), net of $304 million and $203 million, respectively, offset by an increase in net gains (losses) from investment activities of consolidated variable interest entities of $189 million.
The decrease in net gains (losses) from investment activities of $304 million was primarily driven by an impairment loss on an equity investment triggered by the initial public offering of the equity security which resulted in an observable transaction price below the Company’s carrying amount, as well as the depreciation in the Company’s investments in Global Business Travel Group, Inc. The decrease in other income (loss), net of $203 million was primarily driven by the expense related to the issuance of common stock to the Apollo DAF, losses on a derivative forward contract and FX losses due to the significant fluctuations in foreign exchange rates in 2025, partially offset by a decrease in the earnout expense associated with a previous acquisition.
The increase in net gains (losses) from investment activities of consolidated VIEs of $189 million was primarily driven by the appreciation of a consolidated VIE’s underlying investment valuation.
Retirement Services
Revenues
Retirement Services revenues were $10.2 billion in 2025, a decrease of $760 million from $11.0 billion in 2024. The decrease was primarily driven by a decrease in investment related gains (losses) and a decrease in premiums, partially offset by an increase in net investment income and an increase in revenues of consolidated VIEs.
Investment related gains (losses) were $(833) million in 2025, a decrease of $2.4 billion from $1.5 billion in 2024, primarily driven by unfavorable net foreign exchange impacts, an unfavorable change in fair value of FIA hedging derivatives and an increase in realized losses on AFS securities, partially offset by the favorable change in fair value of mortgage loans, reinsurance assets and trading securities. The unfavorable net foreign exchange impacts were primarily related to the weakening of the U.S. dollar against foreign currencies in 2025 compared to 2024, including the impact from derivatives not designated as a hedge where the foreign exchange impact on the related asset is reported through AOCI. The change in fair value of FIA hedging derivatives decreased $1.9 billion, primarily driven by less favorable performance of the equity indices upon which Athene’s call options are based. The largest percentage of Athene’s call options are based on the S&P 500 Index, which
119
increased 5.5% in 2025, compared to an increase of 14.5% in 2024. The change in fair value of mortgage loans increased $1.0 billion, the change in fair value of reinsurance assets increased $386 million and the change in fair value of trading securities increased $131 million primarily driven by a decrease in U.S. Treasury rates in 2025 compared to an increase in 2024.
Premiums were $234 million in 2025, a decrease of $540 million from $774 million in 2024, primarily driven by a $572 million decrease in pension group annuity premiums, partially offset by an increase in payout premiums compared to 2024.
Net investment income was $9.1 billion in 2025, an increase of $1.7 billion from $7.4 billion in 2024, primarily driven by significant growth in Athene’s investment portfolio attributable to strong net flows during the previous twelve months, higher rates on new deployment in comparison to Athene’s existing portfolio related to the higher interest rate environment, earlier deployment into assets during the year compared to 2024 and more favorable investment fund performance in 2025. These impacts were partially offset by lower floating rate income.
Revenues of consolidated VIEs were $1.1 billion in 2025, an increase of $365 million from $777 million in 2024, primarily driven by growth and investment performance within AAA related to favorable returns on the underlying assets, favorable returns from A-A Onshore Fund, LLC, a favorable change in the fair value of mortgage loans held in VIEs related to a decrease in U.S. Treasury rates in 2025 compared to an increase in 2024 and underperformance from certain investment funds held in VIEs in 2024 that were subsequently deconsolidated.
Expenses
Retirement Services expenses were $7.9 billion in 2025, an increase of $374 million from $7.5 billion in 2024. The increase was primarily driven by an increase in market risk benefits remeasurement (gains) losses, an increase in interest sensitive contract benefits, an increase in policy and other operating expenses and an increase in the amortization of DAC, DSI and VOBA, partially offset by a decrease in future policy and other policy benefits.
Market risk benefits remeasurement (gains) losses were $274 million in 2025, an increase of $444 million from $(170) million in 2024. The losses in 2025 compared to gains in 2024 were primarily driven by an unfavorable change in the fair value of market risk benefits. The change in fair value of market risk benefits was $357 million unfavorable due to a decrease in risk-free discount rates across the long end of the curve compared to 2024, which is used in the fair value measurement of the liability for market risk benefits, and $81 million unfavorable related to less favorable equity market performance compared to 2024.
Interest sensitive contract benefits were $4.9 billion in 2025, an increase of $214 million from $4.7 billion in 2024, primarily driven by significant growth in Athene’s deferred annuity and funding agreement blocks of business, higher rates on new deferred annuity and funding agreement issuances in comparison to its existing blocks of business and earlier origination of new business within the year compared to 2024. These impacts were partially offset by a decrease in the change in FIA reserves and lower rates on floating rate funding agreements. The change in Athene’s FIA reserves includes the impact from changes in the fair value of FIA embedded derivatives. The decrease in the change in fair value of FIA embedded derivatives of $1.1 billion was primarily due to the performance of the equity indices to which Athene’s FIA policies are linked. The largest percentage of Athene’s FIA policies are linked to the S&P 500 Index, which increased 5.5% in 2025, compared to an increase of 14.5% in 2024. The change in fair value of FIA embedded derivatives was also driven by the favorable impact of rates on policyholder projected benefits. These impacts were partially offset by the unfavorable change in discount rates used in Athene’s embedded derivative calculations as 2025 experienced a decrease in discount rates compared to an increase in 2024.
Policy and other operating expenses were $1.1 billion in 2025, an increase of $161 million from $931 million in 2024, primarily driven by an increase in interest expense and policy acquisition expenses related to significant growth. The increase in interest expense was primarily due to an increase in host accretion on business ceded to Catalina, as well as interest related to additional issuances of long-term debt in the fourth quarter of 2024 and second quarter of 2025.
Amortization of DAC, DSI and VOBA was $559 million in 2025, an increase of $125 million from $434 million in 2024, primarily driven by an increase in acquisition costs that are deferred and amortized due to strong growth in Athene’s deferred annuity business.
Future policy and other policy benefits were $1.1 billion in 2025, a decrease of $570 million from $1.6 billion in 2024, primarily driven by a $572 million decrease in pension group annuity obligations compared to 2024.
120
Income Tax (Provision) Benefit
The Company’s income tax provision totaled $246 million and $683 million in 2025 and 2024, respectively. The change to the provision was primarily related to the decline in pretax income subject to tax. The provision for income taxes includes federal, state, local and foreign income taxes resulting in an effective income tax rate of 12.1% and 18.8% for 2025 and 2024, respectively. The most significant reconciling items between the U.S. federal statutory income tax rate and the effective income tax rate were due to the following: (i) foreign, state and local income taxes, including NYC UBT, (ii) income attributable to non-controlling interests, (iii) equity-based compensation net of the limiting provisions for executive compensation under IRC Section 162(m), and (iv) Bermuda CIT. See note 10 to the condensed consolidated financial statements for further details regarding the Company’s income tax provision.
Segment Analysis
Discussed below are our results of operations for each of our reportable segments. They represent the segment information available and utilized by management to assess performance and to allocate resources. See note 17 to our condensed consolidated financial statements for more information regarding our segment reporting.
Asset Management
The following table presents Fee Related Earnings, the performance measure of our Asset Management segment.
| Three months ended June 30, | Total Change | Percentage Change | Six months ended June 30, | Total Change | Percentage Change | ||||||||||||||||||||||||||||||||||||||||||
| (In millions, except percentages) | 2025 | 2024 | 2025 | 2024 | |||||||||||||||||||||||||||||||||||||||||||
| Asset Management: | |||||||||||||||||||||||||||||||||||||||||||||||
| Management fees - Credit | $ | 605 | $ | 484 | $ | 121 | 25.0% | $ | 1,174 | $ | 947 | $ | 227 | 24.0% | |||||||||||||||||||||||||||||||||
| Management fees - Equity | 211 | 188 | 23 | 12.2 | 412 | 377 | 35 | 9.3 | |||||||||||||||||||||||||||||||||||||||
| Management fees | 816 | 672 | 144 | 21.4 | 1,586 | 1,324 | 262 | 19.8 | |||||||||||||||||||||||||||||||||||||||
| Capital solutions fees and other, net | 216 | 208 | 8 | 3.8 | 370 | 349 | 21 | 6.0 | |||||||||||||||||||||||||||||||||||||||
| Fee-related performance fees | 63 | 52 | 11 | 21.2 | 117 | 98 | 19 | 19.4 | |||||||||||||||||||||||||||||||||||||||
| Fee-related compensation | (279) | (240) | 39 | 16.3 | (538) | (460) | 78 | 17.0 | |||||||||||||||||||||||||||||||||||||||
| Non-compensation expenses | (189) | (176) | 13 | 7.4 | (349) | (333) | 16 | 4.8 | |||||||||||||||||||||||||||||||||||||||
| Fee Related Earnings (FRE) | $ | 627 | $ | 516 | $ | 111 | 21.5% | $ | 1,186 | $ | 978 | $ | 208 | 21.3% | |||||||||||||||||||||||||||||||||
Three Months Ended June 30, 2025 Compared to Three Months Ended June 30, 2024
In this section, references to 2025 refer to the three months ended June 30, 2025 and references to 2024 refer to the three months ended June 30, 2024.
FRE was $627 million in 2025, an increase of $111 million compared to $516 million in 2024. This increase was primarily attributable to growth in fee related revenues, including management fees, fee-related performance fees and capital solutions fees and other, net.
The increase in management fees was primarily attributable to management fees earned from Athene, S3 Equity and Hybrid Solutions and ADS of $78 million, $21 million and $17 million, respectively, partially offset by decreases in management fees earned from Fund IX and Fund VIII of $9 million and $4 million, respectively. The increase in management fees earned from Athene was primarily driven by increases in fee-generating AUM as a result of strong organic growth at Athene. The increase in management fees earned from S3 Equity and Hybrid Solutions and ADS was primarily driven by catch-up management fees for additional closes and additional subscriptions in 2025, respectively. The decrease in management fees earned from Fund IX and Fund VIII were correlated with the fee rate step-down of Fund IX and the expiration of Fund VIII’s fee-paying period, respectively.
The increase in fee-related performance fees in 2025 was primarily attributable to fees earned from ADS, reflecting the growing contribution from Apollo’s wealth-focused products.
Capital solutions fees earned in 2025 were primarily attributable to fees earned from companies in the (i) natural resources, (ii) financial services, (iii) manufacturing and industrial and (iv) consumer services sectors.
121
The growth in fee related revenues was offset, in part, by higher fee-related compensation expense and non-compensation expenses. Higher fee-related compensation expense in 2025 was driven by increased headcount as a result of our investment in the next phase of our growth. The increase in non-compensation expenses in 2025 was primarily driven by increases in travel and entertainment expenses, higher professional fees and higher depreciation and amortization expenses.
Six Months Ended June 30, 2025 Compared to Six Months Ended June 30, 2024
In this section, references to 2025 refer to the six months ended June 30, 2025 and references to 2024 refer to the six months ended June 30, 2024.
FRE was $1,186 million in 2025, an increase of $208 million compared to $978 million in 2024. This increase was primarily attributable to growth in fee related revenues, including management fees, capital solutions fees and other, net and fee-related performance fees.
The increase in management fees was primarily attributable to management fees earned from Athene, S3 Equity and Hybrid Solutions and ADS of $148 million, $36 million and $33 million, respectively, partially offset by decreases in management fees earned from Fund IX and Fund VIII of $19 million and $8 million, respectively. The increase in management fees earned from Athene was primarily driven by increases in fee-generating AUM as a result of strong organic inflows at Athene. The increase in management fees earned from S3 Equity and Hybrid Solutions and ADS was primarily driven by catch-up management fees on additional closes and increased subscriptions in 2025, respectively. The decrease in management fees earned from Fund IX and Fund VIII were correlated with the fee rate step-down of Fund IX and the expiration of Fund VIII’s fee-paying period, respectively.
Capital solutions fees earned in 2025 were primarily attributable to fees earned from companies in the (i) financial services, (ii) natural resources, (iii) manufacturing and industrial and (iv) consumer services sectors.
The increase in fee-related performance fees in 2025 was primarily attributable to fees earned from ADS, reflecting the growing contribution from Apollo’s wealth-focused products.
The growth in fee related revenues was offset, in part, by higher fee-related compensation expense and non-compensation expenses. Higher fee-related compensation expense in 2025 was driven by strong growth in fee related revenues and increased headcount as a result of our investment in the next phase of our growth. The increase in non-compensation expenses in 2025 was primarily driven by increases in placement fees, depreciation and amortization expenses, and professional fees, partially offset by decreases in travel and entertainment expenses.
122
Asset Management Operating Metrics
We monitor certain operating metrics that are common to the alternative asset management industry and directly impact the performance of our Asset Management segment. These operating metrics include Assets Under Management, origination, gross capital deployment and uncalled commitments.
Assets Under Management
The following presents Apollo’s Total AUM and Fee-Generating AUM by investing strategy (in billions):
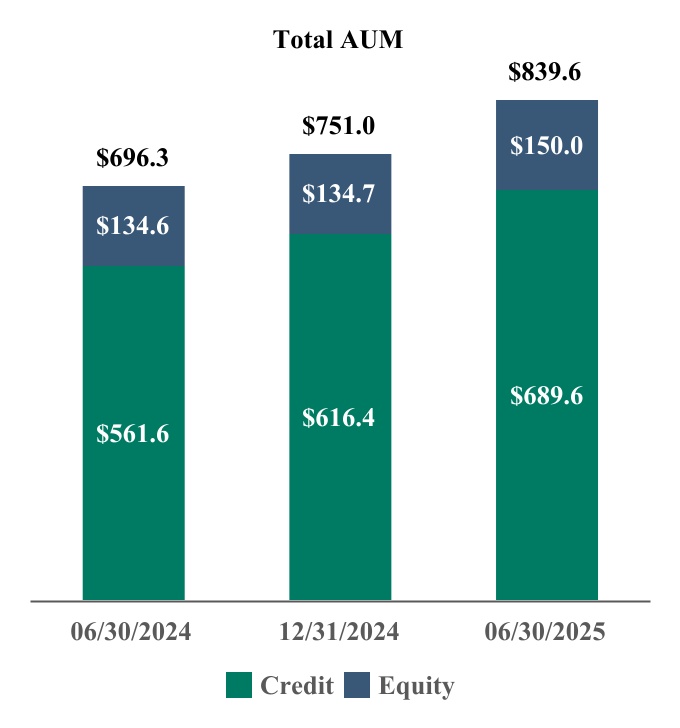
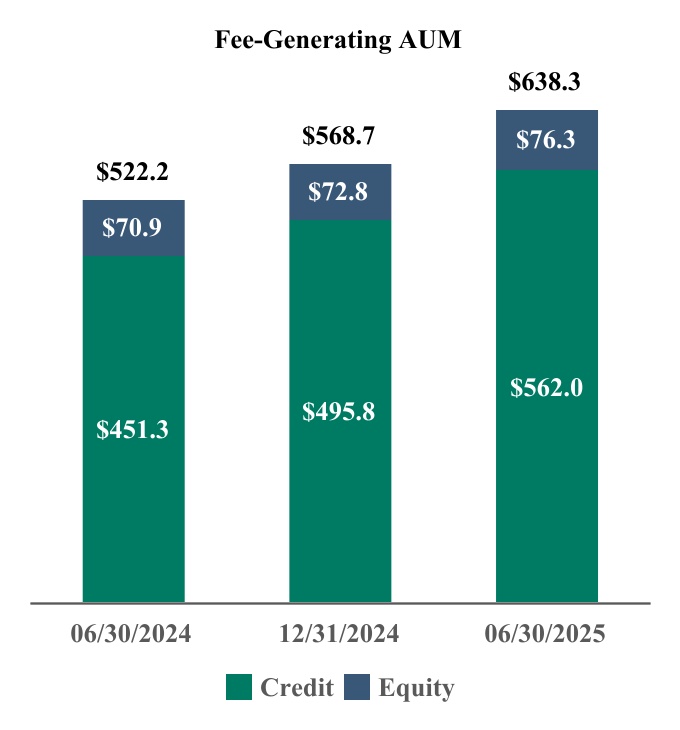 Note: Totals may not add due to rounding.
123
The following presents Apollo’s AUM with Future Management Fee Potential by investing strategy (in billions):
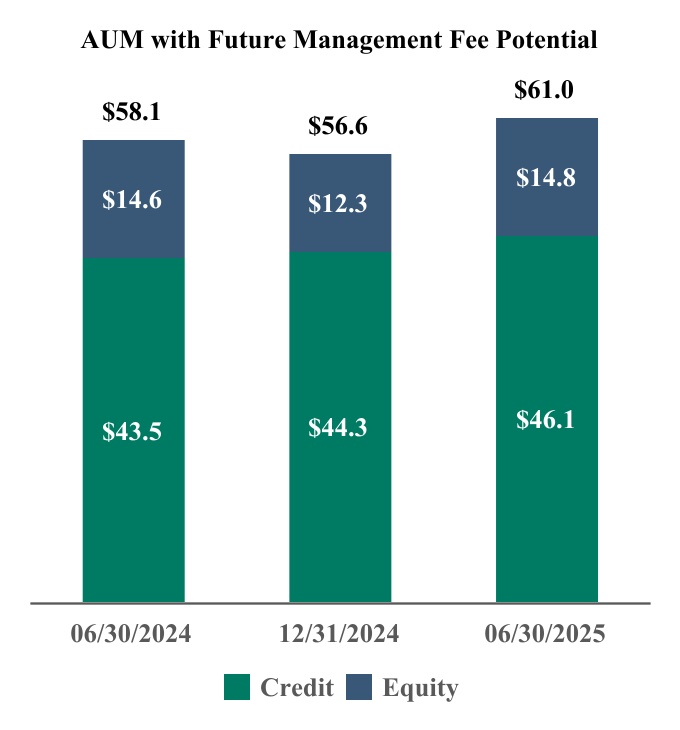
Note: Totals may not add due to rounding
The following tables present the components of Performance Fee-Eligible AUM for Apollo’s investing strategies within the Asset Management segment:
| June 30, 2025 | |||||||||||||||||
| (In millions) | Credit | Equity | Total | ||||||||||||||
Performance Fee-Generating AUM 1
|
$ | 125,597 | $ | 60,438 | $ | 186,035 | |||||||||||
| AUM Not Currently Generating Performance Fees | 10,409 | 5,822 | 16,231 | ||||||||||||||
| Uninvested Performance Fee-Eligible AUM | 28,917 | 30,230 | 59,147 | ||||||||||||||
| Total Performance Fee-Eligible AUM | $ | 164,923 | $ | 96,490 | $ | 261,413 | |||||||||||
| June 30, 2024 | |||||||||||||||||
| (In millions) | Credit | Equity | Total | ||||||||||||||
Performance Fee-Generating AUM 1
|
$ | 85,543 | $ | 54,012 | $ | 139,555 | |||||||||||
| AUM Not Currently Generating Performance Fees | 8,269 | 4,789 | 13,058 | ||||||||||||||
| Uninvested Performance Fee-Eligible AUM | 28,977 | 31,536 | 60,513 | ||||||||||||||
| Total Performance Fee-Eligible AUM | $ | 122,789 | $ | 90,337 | $ | 213,126 | |||||||||||
| December 31, 2024 | |||||||||||||||||
| (In millions) | Credit | Equity | Total | ||||||||||||||
Performance Fee-Generating AUM 1
|
$ | 92,532 | $ | 57,665 | $ | 150,197 | |||||||||||
| AUM Not Currently Generating Performance Fees | 10,454 | 4,354 | 14,808 | ||||||||||||||
| Uninvested Performance Fee-Eligible AUM | 30,695 | 27,779 | 58,474 | ||||||||||||||
| Total Performance Fee-Eligible AUM | $ | 133,681 | $ | 89,798 | $ | 223,479 | |||||||||||
1 Performance Fee-Generating AUM of $8.8 billion, $7.5 billion and $6.1 billion as of June 30, 2025, June 30, 2024 and December 31, 2024, respectively, are above the hurdle rates or preferred returns and have been deferred to future periods when the fees are probable to not be significantly reversed.
| |||||||||||||||||
124
The components of Fee-Generating AUM by investing strategy are presented below:
| June 30, 2025 | |||||||||||||||||
| (In millions) | Credit | Equity | Total | ||||||||||||||
| Fee-Generating AUM based on capital commitments | $ | — | $ | 27,408 | $ | 27,408 | |||||||||||
| Fee-Generating AUM based on invested capital | 13,662 | 30,666 | 44,328 | ||||||||||||||
| Fee-Generating AUM based on gross/adjusted assets | 479,169 | 6,641 | 485,810 | ||||||||||||||
| Fee-Generating AUM based on NAV | 69,208 | 11,554 | 80,762 | ||||||||||||||
| Total Fee-Generating AUM | $ | 562,039 | $ | 76,269 | 1 |
$ | 638,308 | ||||||||||
1 The weighted average remaining life of the traditional private equity funds as of June 30, 2025 was 62 months.
| |||||||||||||||||
| June 30, 2024 | |||||||||||||||||
| (In millions) | Credit | Equity | Total | ||||||||||||||
| Fee-Generating AUM based on capital commitments | $ | 214 | $ | 27,408 | $ | 27,622 | |||||||||||
| Fee-Generating AUM based on invested capital | 11,255 | 29,973 | 41,228 | ||||||||||||||
| Fee-Generating AUM based on gross/adjusted assets | 385,269 | 5,260 | 390,529 | ||||||||||||||
| Fee-Generating AUM based on NAV | 54,554 | 8,230 | 62,784 | ||||||||||||||
| Total Fee-Generating AUM | $ | 451,292 | $ | 70,871 | 1 |
$ | 522,163 | ||||||||||
1 The weighted average remaining life of the traditional private equity funds at June 30, 2024 was 65 months.
| |||||||||||||||||
| December 31, 2024 | |||||||||||||||||
| (In millions) | Credit | Equity | Total | ||||||||||||||
| Fee-Generating AUM based on capital commitments | $ | — | $ | 24,678 | $ | 24,678 | |||||||||||
| Fee-Generating AUM based on invested capital | 12,462 | 33,271 | 45,733 | ||||||||||||||
| Fee-Generating AUM based on gross/adjusted assets | 421,421 | 5,547 | 426,968 | ||||||||||||||
| Fee-Generating AUM based on NAV | 61,960 | 9,327 | 71,287 | ||||||||||||||
| Total Fee-Generating AUM | $ | 495,843 | $ | 72,823 | 1 |
$ | 568,666 | ||||||||||
1 The weighted average remaining life of the traditional private equity funds as of December 31, 2024 was 60 months.
| |||||||||||||||||
Apollo, through its consolidated subsidiary, ISG, provides asset management services to Athene with respect to assets in the accounts owned by or related to Athene (“Athene Accounts”), including asset allocation services, direct asset management services, asset and liability matching management, mergers and acquisitions asset diligence, hedging and other asset management services and receives management fees for providing these services. The Company, through ISG, also provides sub-allocation services with respect to a portion of the assets in the Athene Accounts. Apollo, through its asset management business, managed or advised $366.8 billion, $331.5 billion and $304.4 billion of AUM on behalf of Athene as of June 30, 2025, December 31, 2024 and June 30, 2024, respectively.
Apollo, through ISGI, provides investment advisory services with respect to certain assets in certain portfolio companies of Apollo funds and sub-advises the Athora Accounts and broadly refers to “Athora Sub-Advised” assets as those assets in the Athora Accounts which the Company explicitly sub-advises as well as those assets in the Athora Accounts which are invested directly in funds and investment vehicles Apollo manages. The Company refers to the portion of the Athora AUM that is not Athora Sub-Advised AUM as “Athora Non-Sub Advised” AUM. See note 15 to the condensed consolidated financial statements for more details regarding the fee arrangements with respect to the assets in the Athora Accounts. Apollo managed or advised $58.7 billion, $52.4 billion and $50.3 billion of AUM on behalf of Athora as of June 30, 2025, December 31, 2024 and June 30, 2024, respectively.
125
The following tables summarize changes in total AUM for Apollo’s investing strategies within the Asset Management segment:
| Three months ended June 30, | |||||||||||||||||||||||||||||||||||
| 2025 | 2024 | ||||||||||||||||||||||||||||||||||
| (In millions) | Credit | Equity | Total | Credit | Equity | Total | |||||||||||||||||||||||||||||
Change in Total AUM1:
|
|||||||||||||||||||||||||||||||||||
| Beginning of Period | $ | 641,345 | $ | 143,813 | $ | 785,158 | $ | 536,264 | $ | 134,740 | $ | 671,004 | |||||||||||||||||||||||
| Inflows | 52,250 | 8,828 | 61,078 | 36,511 | 1,850 | 38,361 | |||||||||||||||||||||||||||||
Outflows2
|
(16,528) | (399) | (16,927) | (12,654) | (1,092) | (13,746) | |||||||||||||||||||||||||||||
| Net Flows | 35,722 | 8,429 | 44,151 | 23,857 | 758 | 24,615 | |||||||||||||||||||||||||||||
| Realizations | (1,548) | (3,881) | (5,429) | (2,005) | (2,303) | (4,308) | |||||||||||||||||||||||||||||
Market Activity3
|
14,054 | 1,671 | 15,725 | 3,496 | 1,446 | 4,942 | |||||||||||||||||||||||||||||
| End of Period | $ | 689,573 | $ | 150,032 | $ | 839,605 | $ | 561,612 | $ | 134,641 | $ | 696,253 | |||||||||||||||||||||||
1 At the individual segment level, inflows include new subscriptions, commitments, capital raised, other increases in available capital, purchases, acquisitions, and portfolio company appreciation. Outflows represent redemptions, other decreases in available capital and portfolio company depreciation. Realizations represent fund distributions of realized proceeds. Market activity represents gains (losses), the impact of foreign exchange rate fluctuations and other income.
| |||||||||||||||||||||||||||||||||||
2 Outflows for Total AUM include redemptions of $1.4 billion and $1.9 billion during the three months ended June 30, 2025 and 2024, respectively.
| |||||||||||||||||||||||||||||||||||
3 Includes foreign exchange impacts of $6.9 billion and $(0.6) billion during the three months ended June 30, 2025 and 2024, respectively.
| |||||||||||||||||||||||||||||||||||
| Six months ended June 30, | |||||||||||||||||||||||||||||||||||
| 2025 | 2024 | ||||||||||||||||||||||||||||||||||
| (In millions) | Credit | Equity | Total | Credit | Equity | Total | |||||||||||||||||||||||||||||
Change in Total AUM1:
|
|||||||||||||||||||||||||||||||||||
| Beginning of Period | $ | 616,387 | $ | 134,650 | $ | 751,037 | $ | 515,523 | $ | 135,253 | $ | 650,776 | |||||||||||||||||||||||
Inflows2
|
89,827 | 17,950 | 107,777 | 73,367 | 4,210 | 77,577 | |||||||||||||||||||||||||||||
Outflows2
|
(36,469) | (714) | (37,183) | (30,594) | (2,892) | (33,486) | |||||||||||||||||||||||||||||
| Net Flows | 53,358 | 17,236 | 70,594 | 42,773 | 1,318 | 44,091 | |||||||||||||||||||||||||||||
| Realizations | (2,898) | (5,981) | (8,879) | (7,061) | (4,889) | (11,950) | |||||||||||||||||||||||||||||
Market Activity3
|
22,726 | 4,127 | 26,853 | 10,377 | 2,959 | 13,336 | |||||||||||||||||||||||||||||
| End of Period | $ | 689,573 | $ | 150,032 | $ | 839,605 | $ | 561,612 | $ | 134,641 | $ | 696,253 | |||||||||||||||||||||||
1 At the individual strategy level, inflows include new subscriptions, commitments, capital raised, other increases in available capital, purchases, acquisitions and portfolio company appreciation. Outflows represent redemptions, other decreases in available capital and portfolio company depreciation. Realizations represent fund distributions of realized proceeds. Market activity represents gains (losses), the impact of foreign exchange rate fluctuations and other income.
| |||||||||||||||||||||||||||||||||||
2 Inflows and outflows reflected above include $3.4 billion for Total AUM related to a strategy realignment of certain funds from credit to equity as of January 1, 2025 with no impact to net flows presented for the six months ended June 30, 2025. Outflows for Total AUM include redemptions of $3.0 billion and $3.4 billion during the six months ended June 30, 2025 and 2024, respectively.
| |||||||||||||||||||||||||||||||||||
3 Includes foreign exchange impacts of $10.3 billion and $(2.3) billion during the six months ended June 30, 2025 and 2024, respectively.
| |||||||||||||||||||||||||||||||||||
Three Months Ended June 30, 2025
Total AUM was $839.6 billion at June 30, 2025, an increase of $54.4 billion, or 6.9%, compared to $785.2 billion at March 31, 2025. The net increase was primarily driven by subscriptions across the platform, market activity primarily in our credit strategy and the growth of our retirement services client assets, partially offset by normal course outflows at Athene as well as distributions. More specifically, the net increase was due to:
•Net flows of $44.2 billion primarily attributable to:
•a $35.7 billion increase related to the funds we manage in our credit strategy primarily consisting of (i) $13.7 billion related to the growth of our retirement services clients; (ii) $12.7 billion of subscriptions mostly related to the asset-backed finance and direct origination funds we manage; and (iii) $9.3 billion in inflows relating to Redding Ridge’s acquisition of Irradiant Partners LP, partially offset by $(1.1) billion of redemptions; and
•an $8.4 billion increase related to the funds we manage in our equity strategy, primarily due to $5.0 billion of subscriptions across the hybrid value and traditional private equity funds we manage.
126
•Market activity of $15.7 billion primarily attributable to:
•$14.1 billion related to the funds we manage in our credit strategy primarily consisting of $4.6 billion related to our retirement services clients, $3.0 billion related to clients of ISGI and $2.8 billion related to the direct origination funds; and
•$1.7 billion related to the funds we manage in our equity strategy.
•Realizations of $(5.4) billion primarily attributable to:
•$(3.9) billion related to the funds we manage in our equity strategy primarily consisting of distributions from the traditional private equity funds and hybrid value funds; and
•$(1.5) billion related to the funds we manage in our credit strategy, largely driven by distributions from the direct origination and asset-backed finance funds.
Six Months Ended June 30, 2025
Total AUM was $839.6 billion at June 30, 2025, an increase of $88.6 billion, or 11.8%, compared to $751.0 billion at December 31, 2024. The net increase was primarily driven by subscriptions across the platform, the growth of our retirement services client assets and market activity primarily in our credit strategy, partially offset by normal course outflows at Athene as well as distributions. More specifically, the net increase was due to:
•Net flows of $70.6 billion primarily attributable to:
•a $53.4 billion increase related to the funds we manage in our credit strategy primarily consisting of (i) $24.4 billion related to the growth of our retirement services clients; (ii) $19.5 billion of subscriptions mostly related to the direct origination, asset-backed finance, and multi-credit funds we manage; (iii) $9.3 billion in inflows relating to Redding Ridge’s acquisition of Irradiant Partners LP; and (iv) incremental leverage in the direct origination and asset-backed finance funds we manage, partially offset by $(2.4) billion of redemptions; and
•a $17.2 billion increase related to the funds we manage in our equity strategy, primarily due to $9.3 billion of subscriptions across the hybrid value, secondaries equity and traditional private equity funds we manage, and $4.6 billion of net transfer activity.
•Market activity of $26.9 billion primarily attributable to:
•$22.7 billion related to the funds we manage in our credit strategy primarily consisting of $9.2 billion related to our retirement services clients, $4.4 billion related to the direct origination funds we manage and $3.7 billion related to ISGI; and
•$4.1 billion related to the funds we manage in our equity strategy primarily driven by our traditional private equity funds.
•Realizations of $(8.9) billion primarily attributable to:
•$(6.0) billion related to the funds we manage in our equity strategy primarily consisting of distributions from the traditional private equity funds and hybrid value funds; and
•$(2.9) billion related to the funds we manage in our credit strategy, largely driven by distributions from the direct origination funds.
127
The following tables summarize changes in Fee-Generating AUM for Apollo’s investing strategies within the Asset Management segment:
| Three months ended June 30, | |||||||||||||||||||||||||||||||||||
| 2025 | 2024 | ||||||||||||||||||||||||||||||||||
| (In millions) | Credit | Equity | Total | Credit | Equity | Total | |||||||||||||||||||||||||||||
Change in Fee-Generating AUM1:
|
|||||||||||||||||||||||||||||||||||
| Beginning of Period | $ | 522,844 | $ | 72,314 | $ | 595,158 | $ | 435,288 | $ | 70,809 | $ | 506,097 | |||||||||||||||||||||||
| Inflows | 38,424 | 5,804 | 44,228 | 29,071 | 2,020 | 31,091 | |||||||||||||||||||||||||||||
Outflows2
|
(9,429) | (929) | (10,358) | (14,847) | (1,529) | (16,376) | |||||||||||||||||||||||||||||
| Net Flows | 28,995 | 4,875 | 33,870 | 14,224 | 491 | 14,715 | |||||||||||||||||||||||||||||
| Realizations | (1,132) | (1,359) | (2,491) | (1,330) | (439) | (1,769) | |||||||||||||||||||||||||||||
Market Activity3
|
11,332 | 439 | 11,771 | 3,110 | 10 | 3,120 | |||||||||||||||||||||||||||||
| End of Period | $ | 562,039 | $ | 76,269 | $ | 638,308 | $ | 451,292 | $ | 70,871 | $ | 522,163 | |||||||||||||||||||||||
1 At the individual strategy level, inflows include new subscriptions, commitments, capital raised, other increases in available capital, purchases, acquisitions and portfolio company appreciation. Outflows represent redemptions, other decreases in available capital and portfolio company depreciation. Realizations represent fund distributions of realized proceeds. Market activity represents gains (losses), the impact of foreign exchange rate fluctuations and other income.
| |||||||||||||||||||||||||||||||||||
2 Outflows for Fee-Generating AUM include redemptions of $1.0 billion and $1.9 billion during the three months ended June 30, 2025 and 2024, respectively.
| |||||||||||||||||||||||||||||||||||
3 Includes foreign exchange impacts of $5.4 billion and $(0.5) billion during the three months ended June 30, 2025 and 2024, respectively.
| |||||||||||||||||||||||||||||||||||
| Six months ended June 30, | |||||||||||||||||||||||||||||||||||
| 2025 | 2024 | ||||||||||||||||||||||||||||||||||
| (In millions) | Credit | Equity | Total | Credit | Equity | Total | |||||||||||||||||||||||||||||
Change in Fee-Generating AUM1:
|
|||||||||||||||||||||||||||||||||||
| Beginning of Period | $ | 495,843 | $ | 72,823 | $ | 568,666 | $ | 422,036 | $ | 70,916 | $ | 492,952 | |||||||||||||||||||||||
Inflows2
|
78,379 | 11,026 | 89,405 | 58,519 | 3,530 | 62,049 | |||||||||||||||||||||||||||||
Outflows2,3
|
(29,085) | (6,626) | (35,711) | (36,153) | (2,534) | (38,687) | |||||||||||||||||||||||||||||
| Net Flows | 49,294 | 4,400 | 53,694 | 22,366 | 996 | 23,362 | |||||||||||||||||||||||||||||
| Realizations | (1,980) | (1,647) | (3,627) | (2,478) | (957) | (3,435) | |||||||||||||||||||||||||||||
Market Activity4
|
18,882 | 693 | 19,575 | 9,368 | (84) | 9,284 | |||||||||||||||||||||||||||||
| End of Period | $ | 562,039 | $ | 76,269 | $ | 638,308 | $ | 451,292 | $ | 70,871 | $ | 522,163 | |||||||||||||||||||||||
1 At the individual strategy level, inflows include new subscriptions, commitments, capital raised, other increases in available capital, purchases, acquisitions and portfolio company appreciation. Outflows represent redemptions, other decreases in available capital and portfolio company depreciation. Realizations represent fund distributions of realized proceeds. Market activity represents gains (losses), the impact of foreign exchange rate fluctuations and other income.
| |||||||||||||||||||||||||||||||||||
2 Inflows and outflows reflected above include $2.0 billion for Fee-Generating AUM related to a strategy realignment of certain funds from credit to equity as of January 1, 2025 with no impact to net flows presented for the six months ended June 30, 2025. Outflows for Fee-Generating AUM include redemptions of $2.5 billion and $3.2 billion during the six months ended June 30, 2025 and 2024, respectively.
| |||||||||||||||||||||||||||||||||||
3 Included in the equity outflows for Fee-Generating AUM for the six months ended June 30, 2025 is $4.5 billion related to the expiration of Fund VIII's fee-paying period.
| |||||||||||||||||||||||||||||||||||
4 Includes foreign exchange impacts of $8.0 billion and $(1.8) billion during the six months ended June 30, 2025 and 2024, respectively.
| |||||||||||||||||||||||||||||||||||
Three Months Ended June 30, 2025
Total Fee-Generating AUM was $638.3 billion at June 30, 2025, an increase of $43.2 billion, or 7.3%, compared to $595.2 billion at March 31, 2025. The net increase was primarily due to the growth of our retirement services client assets, market activity primarily in our credit strategy and subscriptions across the platform, partially offset by distributions. More specifically, the net increase was due to:
•Net flows of $33.9 billion primarily attributable to a $29.0 billion increase related to the funds we manage in our credit strategy primarily consisting of (i) $13.7 billion related to the growth of our retirement services clients; (ii) $10.6 billion of other net fee-generating movements; and (iii) $4.2 billion of subscriptions primarily related to the direct origination and multi-credit funds we manage, partially offset by $0.7 billion of redemptions.
•Market activity of $11.8 billion primarily attributable to the funds we manage in our credit strategy, consisting of $4.6 billion related to our retirement services clients, $2.9 billion related to clients of ISGI, $1.6 billion related to the direct origination funds we manage and $1.3 billion related to the multi-credit funds we manage.
128
•Realizations of $(2.5) billion across the credit and equity strategies.
Six Months Ended June 30, 2025
Total Fee-Generating AUM was $638.3 billion at June 30, 2025, an increase of $69.6 billion, or 12.2%, compared to $568.7 billion at December 31, 2024. The net increase was primarily driven by the growth of our retirement services client assets, market activity primarily in our credit strategy, and subscriptions across the platform, partially offset by distributions. More specifically, the net increase was due to:
•Net flows of $53.7 billion primarily attributable to a $49.3 billion increase related to the funds we manage in our credit strategy primarily consisting of (i) $24.4 billion related to the growth of our retirement services client assets; (ii) $16.8 billion of other net fee-generating movements; and (iii) $8.6 billion of subscriptions primarily related to the direct origination and multi-credit funds we manage, partially offset by $(1.9) billion of redemptions.
•Market activity of $19.6 billion primarily attributable to the funds we manage in our credit strategy, consisting of $9.2 billion related to our retirement services clients, $3.7 billion related to clients of ISGI, $2.5 billion related to the direct origination funds we manage and $1.8 billion related to the multi-credit funds we manage.
•Realizations of $(3.6) billion across the credit and equity strategies.
Origination, Gross Capital Deployment and Uncalled Commitments
Origination represents (i) capital that has been invested in new equity, debt or debt-like investments by Apollo's equity and credit strategies (whether purchased by funds and accounts managed by Apollo, or syndicated to third parties) where Apollo or one of Apollo's origination platforms has sourced, negotiated, or significantly affected the commercial terms of the investment; (ii) new capital pools formed by debt issuances, including CLOs; and (iii) net purchases of certain assets by the funds and accounts we manage that we consider to be private, illiquid, and hard to access assets and which the funds and accounts otherwise may not be able to meaningfully access. Origination generally excludes any issuance of debt or debt-like investments by the portfolio companies of the funds we manage.
Gross capital deployment represents the gross capital that has been invested by the funds and accounts we manage during the relevant period, but excludes certain investment activities primarily related to hedging and cash management functions at the Company. Gross capital deployment is not reduced or netted down by sales or refinancings, and takes into account leverage used by the funds and accounts we manage in gaining exposure to the various investments that they have made.
Uncalled commitments, by contrast, represent unfunded capital commitments that certain of the funds we manage have received from fund investors to fund future or current fund investments and expenses.
Origination is indicative of our ability to originate assets for the funds we manage, through our origination platforms and our corporate solutions capabilities. Gross capital deployment and uncalled commitments are indicative of the pace and magnitude of fund capital that is deployed or will be deployed. Origination, gross capital deployment and uncalled commitments could result in future revenues that include management fees, capital solutions fees and performance fees to the extent they are fee-generating. They can also give rise to future costs that are related to the hiring of additional resources to manage and account for the additional origination activities and the capital that is deployed or will be deployed. Management uses origination, gross capital deployment and uncalled commitments as key operating metrics since we believe the results are measures of investment activities of the funds we manage.
129
The following presents origination, gross capital deployment and uncalled commitments (in billions):
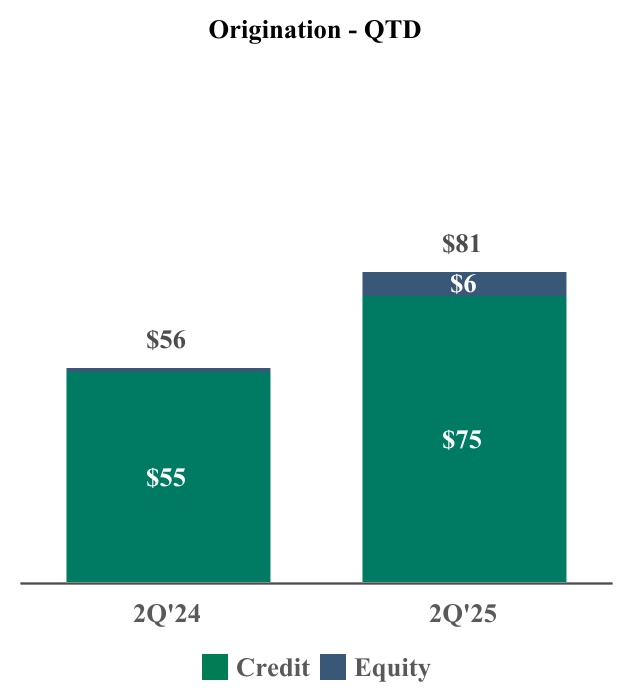
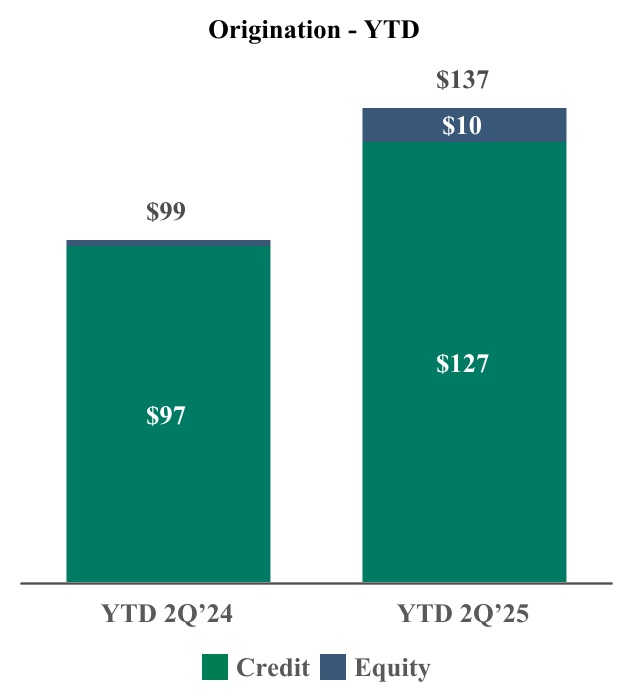
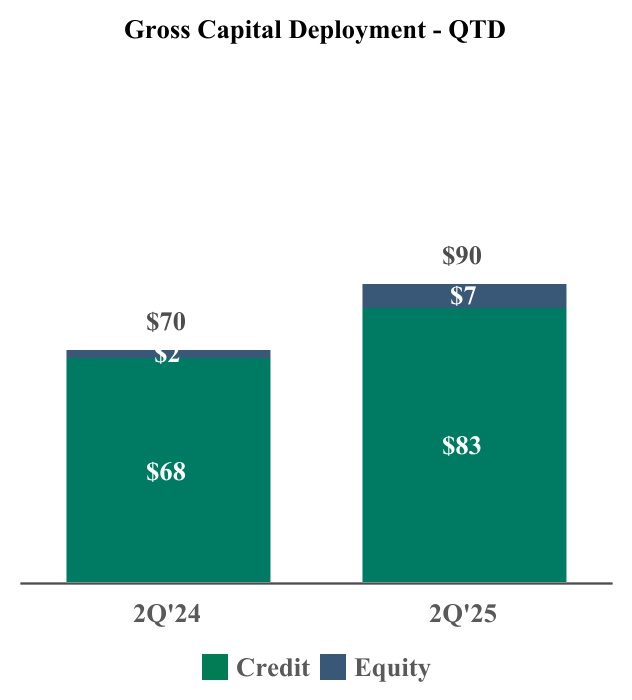
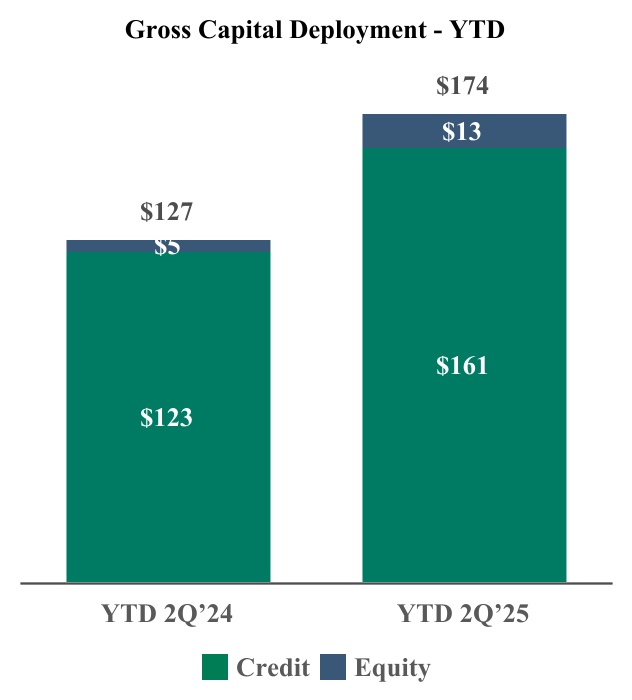
130
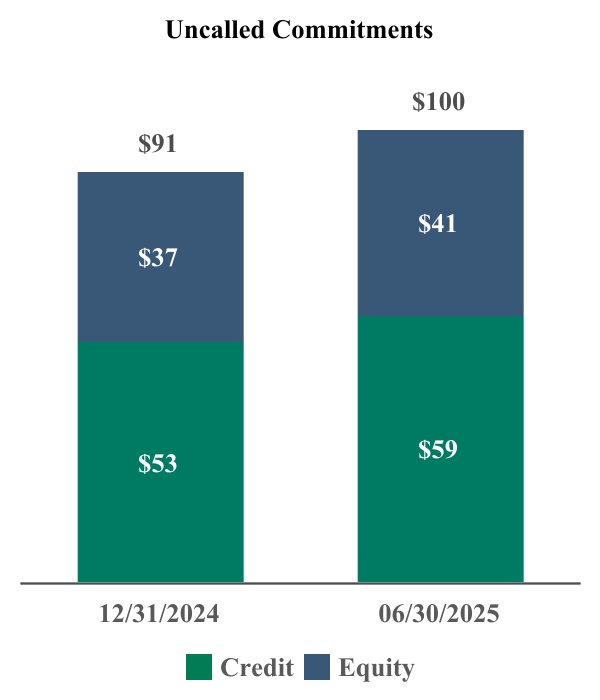
Note: Totals may not add due to rounding
As of June 30, 2025 and December 31, 2024, Apollo had $72 billion and $61 billion of dry powder, respectively, which represents the amount of capital available for investment or reinvestment subject to the provisions of the applicable limited partnership agreements or other governing agreements of the funds, partnerships and accounts we manage. These amounts exclude uncalled commitments which can only be called for fund fees and expenses and commitments from perpetual capital vehicles.
Retirement Services
The following table presents Spread Related Earnings, the performance measure of our Retirement Services segment:
| Three months ended June 30, | Total Change | Percentage Change |
Six months ended June 30, | Total Change |
Percentage Change |
||||||||||||||||||||||||||||||||||||||||||
| (In millions, except percentages) | 2025 | 2024 | 2025 | 2024 | |||||||||||||||||||||||||||||||||||||||||||
| Retirement Services: | |||||||||||||||||||||||||||||||||||||||||||||||
| Fixed income and other net investment income | $ | 3,179 | $ | 2,633 | $ | 546 | 20.7% | $ | 6,093 | $ | 5,087 | $ | 1,006 | 19.8% | |||||||||||||||||||||||||||||||||
| Alternative net investment income | 319 | 168 | 151 | 89.9 | 634 | 434 | 200 | 46.1 | |||||||||||||||||||||||||||||||||||||||
| Net investment earnings | 3,498 | 2,801 | 697 | 24.9 | 6,727 | 5,521 | 1,206 | 21.8 | |||||||||||||||||||||||||||||||||||||||
| Strategic capital management fees | 32 | 24 | 8 | 33.3 | 61 | 49 | 12 | 24.5 | |||||||||||||||||||||||||||||||||||||||
| Cost of funds | (2,470) | (1,880) | 590 | 31.4 | (4,680) | (3,603) | 1,077 | 29.9 | |||||||||||||||||||||||||||||||||||||||
| Net investment spread | 1,060 | 945 | 115 | 12.2 | 2,108 | 1,967 | 141 | 7.2 | |||||||||||||||||||||||||||||||||||||||
| Other operating expenses | (107) | (116) | (9) | (7.8) | (221) | (230) | (9) | (3.9) | |||||||||||||||||||||||||||||||||||||||
| Interest and other financing costs | (132) | (119) | 13 | 10.9 | (262) | (210) | 52 | 24.8 | |||||||||||||||||||||||||||||||||||||||
| Spread Related Earnings | $ | 821 | $ | 710 | $ | 111 | 15.6% | $ | 1,625 | $ | 1,527 | $ | 98 | 6.4% | |||||||||||||||||||||||||||||||||
131
Three Months Ended June 30, 2025 Compared to the Three Months Ended June 30, 2024
In this section, references to 2025 refer to the three months ended June 30, 2025 and references to 2024 refer to the three months ended June 30, 2024.
Spread Related Earnings
SRE was $821 million in 2025, an increase of $111 million, or 16%, compared to $710 million in 2024. The increase in SRE was primarily driven by an increase in net investment earnings and strategic capital management fees, partially offset by an increase in cost of funds and interest and other financing costs.
Net investment earnings were $3.5 billion in 2025, an increase of $697 million from $2.8 billion in 2024, primarily driven by $38.5 billion of growth in Athene’s average net invested assets, higher rates on new deployment compared to Athene’s existing portfolio related to the higher interest rate environment, earlier deployment into assets during the quarter compared to 2024 and an increase in alternative net investment income, partially offset by lower floating rate income. The increase in alternative net investment income compared to 2024 was primarily driven by more favorable performance within origination and retirement services platforms. The increase in income from origination platforms was mainly attributable to a valuation increase on Wheels in 2025, strong growth from origination partnerships within Aqua Finance, Inc. (“Aqua Finance”) compared to a valuation decrease in 2024, successful deployment following a capital raise within Apterra Infrastructure Capital, LLC (“Apterra”) and certain of Athene’s other origination platforms reaching scale in 2025. The increase in income from retirement services platforms was primarily related to a valuation increase on Venerable in 2025 related to the announcement of a reinsurance transaction with Corebridge Financial, Inc. (“Corebridge”), as well as unfavorable returns on Athene’s investment in Catalina in 2024 not recurring in 2025 due to the distribution of Athene’s Catalina common equity interests to AGM as a dividend in the third quarter of 2024.
Strategic capital management fees were $32 million in 2025, an increase of $8 million from $24 million in 2024 primarily driven by additional fees received from ADIP II attributable to strong net flows into ACRA 2 over the previous twelve months.
Cost of funds was $2.5 billion in 2025, an increase of $590 million from $1.9 billion in 2024, primarily driven by significant growth in deferred annuity and institutional business, higher rates on new business and runoff of lower rate business compared to existing blocks, earlier origination of new business within the quarter compared to 2024 and a shift in business mix to more institutional business at higher crediting rates. These impacts were partially offset by lower rates on floating rate funding agreements.
Interest and other financing costs were $132 million in 2025, an increase of $13 million from $119 million in 2024, primarily driven by higher interest expense related to additional issuances of long-term debt in the fourth quarter of 2024 and second quarter of 2025. This was partially offset by a lower average short-term repurchase agreement balance outstanding in 2025 compared to 2024.
Net Investment Spread
| Three months ended June 30, | |||||||||||||||||
| 2025 | 2024 | Change | |||||||||||||||
| Fixed income and other net investment earned rate | 4.97 | % | 4.82 | % | 15bps | ||||||||||||
| Alternative net investment earned rate | 9.86 | % | 5.73 | % | NM | ||||||||||||
| Net investment earned rate | 5.21 | % | 4.87 | % | 34bps | ||||||||||||
| Strategic capital management fees | 0.05 | % | 0.04 | % | 1bp | ||||||||||||
| Cost of funds | (3.68) | % | (3.27) | % | 41bps | ||||||||||||
| Net investment spread | 1.58 | % | 1.64 | % | (6)bps | ||||||||||||
Net investment spread was 1.58% in 2025, a decrease of 6 basis points compared to 1.64% in 2024, primarily driven by higher cost of funds, partially offset by a higher net investment earned rate.
Cost of funds was 3.68% in 2025, an increase of 41 basis points compared to 3.27% in 2024, primarily driven by higher rates on new business and runoff of lower rate business compared to existing blocks, earlier origination of new business within the
132
quarter compared to 2024 and a shift in business mix to more institutional business at higher crediting rates, partially offset by lower rates on floating rate funding agreements.
Net investment earned rate was 5.21% in 2025, an increase of 34 basis points compared to 4.87% in 2024, primarily driven by higher returns in both Athene’s fixed income and alternative investment portfolios. Fixed income and other net investment earned rate was 4.97% in 2025, an increase from 4.82% in 2024, primarily driven by higher rates on new deployment compared to Athene’s existing portfolio related to the higher interest rate environment and earlier deployment into assets during the quarter compared to 2024, partially offset by lower floating rate income. Alternative net investment earned rate was 9.86% in 2025, an increase from 5.73% in 2024, primarily driven by more favorable performance within origination and retirement services platforms. The higher returns from the origination platforms were mainly attributable to a valuation increase on Wheels in 2025, strong growth from origination partnerships within Aqua Finance compared to a valuation decrease in 2024, successful deployment following a capital raise within Apterra and certain of Athene’s other origination platforms reaching scale in 2025. The higher returns from retirement services platforms were primarily related to a valuation increase on Venerable in 2025 related to the announcement of a reinsurance transaction with Corebridge, as well as unfavorable returns on Athene’s investment in Catalina in 2024 not recurring in 2025 due to the distribution of Athene’s Catalina common equity interests to AGM as a dividend in the third quarter of 2024.
Six Months Ended June 30, 2025 Compared to Six Months Ended June 30, 2024
In this section, references to 2025 refer to the six months ended June 30, 2025 and references to 2024 refer to the six months ended June 30, 2024.
Spread Related Earnings
SRE was $1.6 billion in 2025, an increase of $98 million, or 6%, compared to $1.5 billion in 2024. The increase in SRE was primarily driven by an increase in net investment earnings and strategic capital management fees, partially offset by an increase in cost of funds and interest and other financing costs.
Net investment earnings were $6.7 billion in 2025, an increase of $1.2 billion from $5.5 billion in 2024, primarily driven by $36.1 billion of growth in Athene’s average net invested assets, higher rates on new deployment compared to Athene’s existing portfolio related to the higher interest rate environment, earlier deployment into assets during the year compared to 2024 and an increase in alternative net investment income, partially offset by lower floating rate income. The increase in alternative net investment income compared to 2024 was primarily driven by more favorable performance within origination and retirement services platforms, as well as within equity funds. The increase in income from origination platforms was mainly attributable to strong performance within other origination platforms, including an initial mark from cost to fair value on Atlas and certain other platforms reaching scale in 2025, a valuation increase on Wheels in the second quarter of 2025, strong growth from origination partnerships within Aqua Finance compared to a valuation decrease in 2024 and successful deployment following a capital raise within Apterra in 2025. The increase in income from retirement services platforms was primarily related to a valuation increase on Venerable in 2025 related to the announcement of a reinsurance transaction with Corebridge and unfavorable returns on Athene’s investment in Catalina in 2024 not recurring in 2025 due to the distribution of Athene’s Catalina common equity interests to AGM as a dividend in the third quarter of 2024, partially offset by increased capital requirements related to expanded solvency requirements impacting the valuation of Athora in 2025.
Strategic capital management fees were $61 million in 2025, an increase of $12 million from $49 million in 2024 primarily driven by additional fees received from ADIP II attributable to strong net flows into ACRA 2 over the previous twelve months.
Cost of funds was $4.7 billion in 2025, an increase of $1.1 billion from $3.6 billion in 2024, primarily driven by significant growth in deferred annuity and institutional business, higher rates on new business and runoff of lower rate business compared to existing blocks, earlier origination of new business within the year compared to 2024 and a shift in business mix to more institutional business at higher crediting rates. These impacts were partially offset by lower rates on floating rate funding agreements.
Interest and other financing costs were $262 million in 2025, an increase of $52 million from $210 million in 2024, primarily driven by higher interest expense related to additional issuances of long-term debt in the fourth quarter of 2024 and second quarter of 2025.
133
Net Investment Spread
| Six months ended June 30, | |||||||||||||||||
| 2025 | 2024 | Change | |||||||||||||||
| Fixed income and other net investment earned rate | 4.89 | % | 4.75 | % | 14bps | ||||||||||||
| Alternative net investment earned rate | 10.05 | % | 7.42 | % | 263bps | ||||||||||||
| Net investment earned rate | 5.14 | % | 4.89 | % | 25bps | ||||||||||||
| Strategic capital management fees | 0.05 | % | 0.04 | % | 1bp | ||||||||||||
| Cost of funds | (3.57) | % | (3.19) | % | 38bps | ||||||||||||
| Net investment spread | 1.62 | % | 1.74 | % | (12)bps | ||||||||||||
Net investment spread was 1.62% in 2025, a decrease of 12 basis points compared to 1.74% in 2024, primarily driven by higher cost of funds, partially offset by a higher net investment earned rate.
Cost of funds was 3.57% in 2025, an increase of 38 basis points compared to 3.19% in 2024, primarily driven by higher rates on new business and runoff of lower rate business compared to existing blocks, earlier origination of new business within the year compared to 2024 and a shift in business mix to more institutional business at higher crediting rates, partially offset by lower rates on floating rate funding agreements.
Net investment earned rate was 5.14% in 2025, an increase of 25 basis points compared to 4.89% in 2024, primarily driven by higher returns in both Athene’s fixed income and alternative investment portfolios. Fixed income and other net investment earned rate was 4.89% in 2025, an increase from 4.75% in 2024, primarily driven by higher rates on new deployment compared to Athene’s existing portfolio related to the higher interest rate environment and earlier deployment into assets during the year compared to 2024, partially offset by lower floating rate income. Alternative net investment earned rate was 10.05% in 2025, an increase from 7.42% in 2024, primarily driven by more favorable performance within origination and retirement services platforms, as well as within equity funds. The higher returns from origination platforms were mainly attributable to strong performance within other origination platforms, including an initial mark from cost to fair value on Atlas and certain other platforms reaching scale in 2025, a valuation increase on Wheels in the second quarter of 2025, strong growth from origination partnerships within Aqua Finance compared to a valuation decrease in 2024 and successful deployment following a capital raise within Apterra in 2025. The higher returns from retirement services platforms were primarily related to a valuation increase on Venerable in 2025 related to the announcement of a reinsurance transaction with Corebridge and unfavorable returns on Athene’s investment in Catalina in 2024 not recurring in 2025 due to the distribution of Athene’s Catalina common equity interests to AGM as a dividend in the third quarter of 2024, partially offset by increased capital requirements related to expanded solvency requirements impacting the valuation of Athora in 2025.
Investment Portfolio
Athene had total investments, including related parties and consolidated VIEs, of $355.8 billion and $314.6 billion as of June 30, 2025 and December 31, 2024, respectively. Athene’s investment strategy seeks to achieve sustainable risk-adjusted returns through the disciplined management of its investment portfolio against its long-duration liabilities, coupled with the diversification of risk. The investment strategies focus primarily on a buy and hold asset allocation strategy that may be adjusted periodically in response to changing market conditions and the nature of Athene’s liability profile. Athene takes advantage of its generally persistent liability profile by identifying investment opportunities with an emphasis on earning incremental yield by taking measured liquidity and complexity risk rather than assuming incremental credit risk. Athene has selected a diverse array of primarily high-grade fixed income assets including corporate bonds, structured securities and commercial and residential real estate loans, among others. Athene also maintains holdings in floating rate and less rate-sensitive instruments, including CLOs, non-agency RMBS and various types of structured products. In addition to its fixed income portfolio, Athene opportunistically allocates approximately 5% of its portfolio to alternative investments where it primarily focuses on fixed income-like, cash flow-based investments.
134
The following table presents the carrying values of Athene’s total investments, including related parties and consolidated VIEs:
| June 30, 2025 | December 31, 2024 | ||||||||||||||||||||||
| (In millions, except percentages) | Carrying Value | Percentage of Total | Carrying Value | Percentage of Total | |||||||||||||||||||
| Available-for-sale securities, at fair value | |||||||||||||||||||||||
| U.S. government and agencies | $ | 9,023 | 2.5 | % | $ | 7,151 | 2.3 | % | |||||||||||||||
| U.S. state, municipal and political subdivisions | 840 | 0.2 | % | 921 | 0.3 | % | |||||||||||||||||
| Foreign governments | 1,752 | 0.5 | % | 1,568 | 0.5 | % | |||||||||||||||||
| Corporate | 94,563 | 26.6 | % | 83,585 | 26.6 | % | |||||||||||||||||
| CLO | 31,388 | 8.8 | % | 29,182 | 9.3 | % | |||||||||||||||||
| ABS | 27,362 | 7.7 | % | 24,201 | 7.7 | % | |||||||||||||||||
| CMBS | 13,500 | 3.8 | % | 10,741 | 3.4 | % | |||||||||||||||||
| RMBS | 10,322 | 2.9 | % | 8,015 | 2.5 | % | |||||||||||||||||
| Total available-for-sale securities, at fair value | 188,750 | 53.0 | % | 165,364 | 52.6 | % | |||||||||||||||||
| Trading securities, at fair value | 4,060 | 1.2 | % | 1,583 | 0.5 | % | |||||||||||||||||
| Equity securities, at fair value | 1,150 | 0.3 | % | 1,290 | 0.4 | % | |||||||||||||||||
| Mortgage loans, at fair value | 77,289 | 21.7 | % | 63,239 | 20.1 | % | |||||||||||||||||
| Investment funds | 102 | — | % | 107 | — | % | |||||||||||||||||
| Policy loans | 310 | 0.1 | % | 318 | 0.1 | % | |||||||||||||||||
| Funds withheld at interest | 16,998 | 4.8 | % | 18,866 | 6.0 | % | |||||||||||||||||
| Derivative assets | 6,901 | 1.9 | % | 8,154 | 2.6 | % | |||||||||||||||||
| Short-term investments | 187 | 0.1 | % | 447 | 0.2 | % | |||||||||||||||||
| Other investments | 3,364 | 1.0 | % | 2,915 | 0.9 | % | |||||||||||||||||
| Total investments | 299,111 | 84.1 | % | 262,283 | 83.4 | % | |||||||||||||||||
| Investments in related parties | |||||||||||||||||||||||
| Available-for-sale securities, at fair value | |||||||||||||||||||||||
| Corporate | 2,192 | 0.6 | % | 2,137 | 0.7 | % | |||||||||||||||||
| CLO | 7,538 | 2.1 | % | 6,035 | 1.9 | % | |||||||||||||||||
| ABS | 11,809 | 3.3 | % | 10,631 | 3.4 | % | |||||||||||||||||
| Total available-for-sale securities, at fair value | 21,539 | 6.0 | % | 18,803 | 6.0 | % | |||||||||||||||||
| Trading securities, at fair value | 399 | 0.1 | % | 573 | 0.2 | % | |||||||||||||||||
| Equity securities, at fair value | 266 | 0.1 | % | 234 | 0.1 | % | |||||||||||||||||
| Mortgage loans, at fair value | 1,275 | 0.4 | % | 1,297 | 0.4 | % | |||||||||||||||||
| Investment funds | 2,062 | 0.6 | % | 1,853 | 0.6 | % | |||||||||||||||||
| Funds withheld at interest | 4,590 | 1.3 | % | 5,050 | 1.6 | % | |||||||||||||||||
| Short-term investments | 18 | — | % | 743 | 0.2 | % | |||||||||||||||||
| Other investments, at fair value | 339 | 0.1 | % | 331 | 0.1 | % | |||||||||||||||||
| Total related party investments | 30,488 | 8.6 | % | 28,884 | 9.2 | % | |||||||||||||||||
| Total investments, including related parties | 329,599 | 92.7 | % | 291,167 | 92.6 | % | |||||||||||||||||
| Investments of consolidated VIEs | |||||||||||||||||||||||
| Trading securities, at fair value | 3,265 | 0.9 | % | 2,301 | 0.7 | % | |||||||||||||||||
| Mortgage loans, at fair value | 2,544 | 0.7 | % | 2,579 | 0.8 | % | |||||||||||||||||
| Investment funds, at fair value | 19,175 | 5.4 | % | 17,660 | 5.6 | % | |||||||||||||||||
| Other investments | 1,204 | 0.3 | % | 884 | 0.3 | % | |||||||||||||||||
| Total investments of consolidated VIEs | 26,188 | 7.3 | % | 23,424 | 7.4 | % | |||||||||||||||||
| Total investments, including related parties and consolidated VIEs | $ | 355,787 | 100.0 | % | $ | 314,591 | 100.0 | % | |||||||||||||||
The $41.2 billion increase in Athene’s total investments, including related parties and consolidated VIEs, as of June 30, 2025 compared to December 31, 2024 was primarily driven by significant growth from gross organic inflows of $46.8 billion in excess of gross liability outflows of $15.6 billion, reinvestment of earnings and unrealized gains on AFS securities during the six months ended June 30, 2025 of $2.9 billion, as well as unrealized gains on mortgage loans, reinsurance assets and trading securities attributable to a decrease in U.S. Treasury rates, partially offset by credit spread widening in 2025. Additionally, total investments, including related parties and consolidated VIEs, increased due to unrealized foreign exchange impacts on foreign
135
denominated assets, the issuance of debt in 2025 and an increase in VIE investments primarily related to an increase in investment funds attributable to favorable performance of the underlying assets within AAA and net contributions from third-party investors into AAA in 2025, partially offset by the deconsolidation of certain VIEs. These impacts were partially offset by a decrease in short term repurchase agreements outstanding and a decrease in derivative assets primarily related to the market impacts on Athene’s derivative swaps and forward contracts.
Athene’s investment portfolio consists largely of high quality fixed maturity securities, loans and short-term investments, as well as additional opportunistic holdings in investment funds and other instruments, including equity holdings. Fixed maturity securities and loans include publicly issued corporate bonds, government and other sovereign bonds, privately placed corporate bonds and loans, mortgage loans, CMBS, RMBS, CLOs and ABS. A significant majority of Athene’s AFS portfolio, 96.9% and 97.1% as of June 30, 2025 and December 31, 2024, respectively, was invested in assets considered investment grade with an NAIC designation of 1 or 2.
Athene invests a portion of its investment portfolio in mortgage loans, which are generally comprised of high quality commercial first lien and mezzanine real estate loans. Athene has acquired mortgage loans through acquisitions and reinsurance arrangements, as well as through an active program to invest in new mortgage loans. It invests in CMLs on income producing properties including hotels, apartments, retail and office buildings, and other commercial and industrial properties. Athene’s RML portfolio primarily consists of first lien RMLs collateralized by properties located in the U.S.
Funds withheld at interest represent a receivable for amounts contractually withheld by ceding companies in accordance with modco and funds withheld reinsurance agreements in which Athene acts as the reinsurer. Generally, assets equal to statutory reserves are withheld and legally owned by the ceding company.
While the substantial majority of Athene’s investment portfolio has been allocated to corporate bonds and structured credit products, a key component of Athene’s investment strategy is the opportunistic acquisition of investment funds with attractive risk and return profiles. Athene’s investment fund portfolio consists of funds or similar equity structures that employ various strategies including equity and credit funds. Athene has a strong preference for alternative investments that have some or all of the following characteristics, among others: (1) investments with credit- or debt-like characteristics (for example, a stipulated maturity and par value), or alternatively, investments with reduced volatility when compared to pure equity; or (2) investments that Athene believes have less downside risk.
Athene holds derivatives for economic hedging purposes to reduce its exposure to the cash flow variability of assets and liabilities, equity market risk, foreign exchange risk and interest rate risk. Athene’s primary use of derivative instruments relates to providing the income needed to fund the annual index credits on its FIA products. Athene primarily uses fixed indexed options to economically hedge indexed annuity products that guarantee the return of principal to the policyholder and credit interest based on a percentage of the gain in a specific market index. Athene also uses derivative instruments, such as forward contracts and swaps, to hedge foreign currency exposure resulting from foreign denominated assets and liabilities and to help manage its net floating rate position.
136
Net Invested Assets
The following summarizes Athene’s net invested assets:
| June 30, 2025 | December 31, 2024 | ||||||||||||||||||||||
| (In millions, except percentages) |
Net Invested Asset Value1
|
Percentage of Total |
Net Invested Asset Value1
|
Percentage of Total | |||||||||||||||||||
| Corporate | $ | 92,073 | 33.5 | % | $ | 86,051 | 34.6 | % | |||||||||||||||
| CLO | 29,303 | 10.6 | % | 27,698 | 11.2 | % | |||||||||||||||||
| Credit | 121,376 | 44.1 | % | 113,749 | 45.8 | % | |||||||||||||||||
| CML | 30,955 | 11.2 | % | 28,055 | 11.3 | % | |||||||||||||||||
| RML | 34,263 | 12.5 | % | 27,848 | 11.2 | % | |||||||||||||||||
| RMBS | 8,879 | 3.2 | % | 7,635 | 3.1 | % | |||||||||||||||||
| CMBS | 10,007 | 3.6 | % | 8,243 | 3.3 | % | |||||||||||||||||
| Real estate | 84,104 | 30.5 | % | 71,781 | 28.9 | % | |||||||||||||||||
| ABS | 30,397 | 11.0 | % | 28,670 | 11.5 | % | |||||||||||||||||
| Alternative investments | 12,817 | 4.7 | % | 12,000 | 4.8 | % | |||||||||||||||||
| State, municipal, political subdivisions and foreign government | 3,217 | 1.2 | % | 3,237 | 1.3 | % | |||||||||||||||||
| Equity securities | 2,183 | 0.8 | % | 2,201 | 0.9 | % | |||||||||||||||||
| Short-term investments | 224 | 0.1 | % | 1,015 | 0.4 | % | |||||||||||||||||
| U.S. government and agencies | 7,105 | 2.6 | % | 5,531 | 2.2 | % | |||||||||||||||||
| Other investments | 55,943 | 20.4 | % | 52,654 | 21.1 | % | |||||||||||||||||
| Cash and cash equivalents | 9,265 | 3.4 | % | 6,794 | 2.7 | % | |||||||||||||||||
| Other | 4,352 | 1.6 | % | 3,665 | 1.5 | % | |||||||||||||||||
| Net invested assets | $ | 275,040 | 100.0 | % | $ | 248,643 | 100.0 | % | |||||||||||||||
1 See “Managing Business Performance - Key Segment and Non-U.S. GAAP Performance Measures” for the definition of net invested assets.
| |||||||||||||||||||||||
Athene’s net invested assets were $275.0 billion and $248.6 billion as of June 30, 2025 and December 31, 2024, respectively. The increase in net invested assets was primarily driven by growth from net organic inflows of $36.0 billion in excess of net liability outflows of $12.8 billion, the reinvestment of earnings, the issuance of $1.6 billion of long-term debt during the second quarter of 2025 and favorable alternative investment performance. These impacts were partially offset by a decrease in short-term repurchase agreements outstanding as of June 30, 2025, cash paid to redeem Athene’s Series C preferred stock and the payment of common and preferred stock dividends.
In managing its business, Athene utilizes net invested assets as presented in the above table. Net invested assets do not correspond to Athene’s total investments, including related parties, on the condensed consolidated statements of financial condition, as discussed previously in “Managing Business Performance — Key Segment and Non-U.S. GAAP Performance Measures.” Net invested assets represent Athene’s investments that directly back its net reserve liabilities and surplus assets. Athene believes this view of its portfolio provides a view of the assets for which it has economic exposure. Athene adjusts the presentation for assumed and ceded reinsurance transactions to include or exclude the underlying investments based upon the contractual transfer of economic exposure to such underlying investments. Athene also adjusts for VIEs to show the net investment in the funds, which are included in the alternative investments line above, as well as adjusting for the allowance for credit losses. Net invested assets include Athene’s proportionate share of ACRA investments, based on its economic ownership, but exclude the proportionate share of investments associated with the non-controlling interests.
Net invested assets is utilized by management to evaluate Athene’s investment portfolio. Net invested assets is used in the computation of net investment earned rate, which allows Athene to analyze the profitability of its investment portfolio. Net invested assets is also used in Athene’s risk management processes for asset purchases, product design and underwriting, stress scenarios, liquidity and ALM.
137
Principal Investing
The following table presents Principal Investing Income, the performance measure of our Principal Investing segment.
| Three months ended June 30, | Total Change | Percentage Change | Six months ended June 30, | Total Change | Percentage Change | ||||||||||||||||||||||||||||||||||||||||||
| (In millions, except percentages) | 2025 | 2024 | 2025 | 2024 | |||||||||||||||||||||||||||||||||||||||||||
| Principal Investing: | |||||||||||||||||||||||||||||||||||||||||||||||
| Realized performance fees | $ | 219 | $ | 175 | $ | 44 | 25.1% | $ | 409 | $ | 269 | $ | 140 | 52.0% | |||||||||||||||||||||||||||||||||
| Realized investment income (loss) | 13 | 11 | 2 | 18.2 | 41 | 25 | 16 | 64.0 | |||||||||||||||||||||||||||||||||||||||
| Principal investing compensation | (168) | (138) | 30 | 21.7 | (356) | (211) | 145 | 68.7 | |||||||||||||||||||||||||||||||||||||||
| Other operating expenses | (17) | (15) | 2 | 13.3 | (33) | (29) | 4 | 13.8 | |||||||||||||||||||||||||||||||||||||||
| Principal Investing Income (PII) | $ | 47 | $ | 33 | $ | 14 | 42.4% | $ | 61 | $ | 54 | $ | 7 | 13.0% | |||||||||||||||||||||||||||||||||
As described in “Item 2. Management’s Discussion and Analysis of Financial Condition and Results of Operations—General”, earnings from our Principal Investing segment are inherently more volatile in nature than earnings from our Asset Management segment due to the intrinsic cyclical nature of performance fees, one of the key drivers of PII performance.
Three Months Ended June 30, 2025 Compared to Three Months Ended June 30, 2024
In this section, references to 2025 refer to the three months ended June 30, 2025 and references to 2024 refer to the three months ended June 30, 2024.
PII was $47 million in 2025, an increase of $14 million, as compared to $33 million in 2024. This increase was primarily attributable to an increase in realized performance fees of $44 million, partially offset by an increase in principal investing compensation expense of $30 million.
The increase in realized performance fees of $44 million in 2025 was driven by a few sizable monetizations within traditional private equity, primarily Fund IX, the crystallization of performance fees generated from AAA Aviation Holdings, L.P., as well as realized performance fees generated from HVF II and ANRP III. Realized performance fees continue to be cyclically light as monetization activity remains prudently delayed amid an uncertain exit environment.
Principal investing compensation of $168 million in 2025 increased $30 million, as compared to $138 million in 2024. The increase in 2025 was primarily due to an increase in profit sharing expense corresponding to the increase in realized performance fees. In any period, the blended profit sharing percentage is impacted by the respective profit sharing ratios of the funds generating performance allocations in the period.
Six Months Ended June 30, 2025 Compared to Six Months Ended June 30, 2024
In this section, references to 2025 refer to the six months ended June 30, 2025 and references to 2024 refer to the six months ended June 30, 2024.
PII was $61 million in 2025, an increase of $7 million, as compared to $54 million in 2024. This increase was primarily attributable to increases in realized performance fees and realized investment income of $140 million and $16 million, respectively, partially offset by an increase in principal investing compensation expense of $145 million.
The increase in realized performance fees of $140 million in 2025 was primarily driven by an increase in realized performance fees generated from HVF II, Fund IX and ANRP III, as well as the crystallization of performance fees generated from AAA Aviation Holdings, L.P., partially offset by a decrease in realized performance fees earned from Fund VII.
The increase in realized investment income of $16 million in 2025 was primarily attributable to realized gains from the sale of the Company’s direct investment in Challenger Limited.
Principal investing compensation expense of $356 million in 2025 increased $145 million, as compared to $211 million in 2024. The increase in 2025 was primarily due to an increase in profit sharing expense corresponding to the increase in realized performance fees. In any period, the blended profit sharing percentage is impacted by the respective profit sharing ratios of the funds generating performance allocations in the period. The increase in 2025 was also driven by profit sharing expense
138
attributable to the Company’s incentive pool, a compensation program through which certain employees are allocated discretionary compensation based on realized performance fees in a given year, and is included within principal investing compensation. The incentive pool is separate from the fund related profit sharing expense and may result in greater variability in compensation and have a variable impact on the blended profit sharing percentage during a particular period.
The Historical Investment Performance of Our Funds
Below we present information relating to the historical performance of the funds we manage, including certain legacy Apollo funds that do not have a meaningful amount of unrealized investments, and in respect of which the general partner interest has not been contributed to us.
When considering the data presented below, you should note that the historical results of funds we manage are not indicative of the future results that you should expect from such funds, from any future funds we may raise or from your investment in our common stock.
An investment in our common stock is not an investment in any of the Apollo managed funds, and the assets and revenues of the funds we manage are not directly available to us. The historical and potential future returns of the funds we manage are not directly linked to returns on our common stock. Therefore, you should not conclude that continued positive performance of the funds we manage will necessarily result in positive returns on an investment in our common stock. However, poor performance of the funds that we manage would cause a decline in our revenue from such funds, and would therefore have a negative effect on our performance and in all likelihood the value of our common stock.
Moreover, the historical returns of funds we manage should not be considered indicative of the future results you should expect from such funds or from any future funds we may raise. There can be no assurance that any Apollo fund will continue to achieve the same results in the future.
Finally, our private equity IRRs have historically varied greatly from fund to fund. For example, Fund VI generated a 12% gross IRR and a 9% net IRR since its inception through June 30, 2025, while Fund V generated a 61% gross IRR and a 44% net IRR since its inception through its liquidation in 2023. Accordingly, the IRR going forward for any current or future fund may vary considerably from the historical IRR generated by any particular fund, or for our private equity funds as a whole. Future returns will also be affected by the applicable risks, including risks of the industries and businesses in which a particular fund invests. See “Item 1A. Risk Factors—Risks Relating to Our Asset Management Business—“Historical performance metrics are unreliable indicators of our current or future results of operations” in the 2024 Annual Report.
139
Investment Record
The following table summarizes the investment record by strategy of Apollo’s significant commitment-based funds that have a defined maturity date in which investors make a commitment to provide capital at the formation of such funds and deliver capital when called as investment opportunities become available. All amounts are as of June 30, 2025, unless otherwise noted.
| (In millions, except IRR) | Vintage Year |
Total AUM | Committed Capital |
Total Invested Capital | Realized Value | Remaining Cost | Unrealized Value | Total Value | Gross IRR |
Net IRR |
|||||||||||||||||||||||||||||||||||||||||||||||||
| Credit: | |||||||||||||||||||||||||||||||||||||||||||||||||||||||||||
Accord VI1
|
2024 | $ | 1,891 | $ | 1,701 | $ | 609 | $ | 494 | $ | 461 | $ | 461 | $ | 955 | 17 | % | 10 | % | ||||||||||||||||||||||||||||||||||||||||
Accord I, II, III, III B, IV & V1
|
Various | — | 7,992 | 6,795 | 7,251 | — | — | 7,251 | 18 | 13 | |||||||||||||||||||||||||||||||||||||||||||||||||
| Accord+ II | 2025 | 5,250 | 4,796 | 2,625 | 608 | 2,088 | 2,214 | 2,822 |
NM4
|
NM4
|
|||||||||||||||||||||||||||||||||||||||||||||||||
| Accord+ | 2021 | 3,074 | 2,370 | 7,009 | 5,735 | 2,027 | 2,169 | 7,904 | 15 | 12 | |||||||||||||||||||||||||||||||||||||||||||||||||
| ADIP II | 2024 | 6,856 | 6,016 | 2,729 | — | 2,729 | 3,293 | 3,293 | 19 | 14 | |||||||||||||||||||||||||||||||||||||||||||||||||
| ADIP I | 2020 | 5,285 | 3,254 | 2,620 | 1,760 | 2,597 | 3,065 | 4,825 | 23 | 19 | |||||||||||||||||||||||||||||||||||||||||||||||||
| EPF IV | 2023 | 3,276 | 3,151 | 1,328 | 666 | 834 | 947 | 1,613 | 17 | 10 | |||||||||||||||||||||||||||||||||||||||||||||||||
| EPF III | 2017 | 2,408 | 4,585 | 5,120 | 4,659 | 1,522 | 1,401 | 6,060 | 7 | 2 | |||||||||||||||||||||||||||||||||||||||||||||||||
| Total Credit | $ | 28,040 | $ | 33,865 | $ | 28,835 | $ | 21,173 | $ | 12,258 | $ | 13,550 | $ | 34,723 | |||||||||||||||||||||||||||||||||||||||||||||
| Equity: | |||||||||||||||||||||||||||||||||||||||||||||||||||||||||||
| Fund X | 2023 | $ | 21,378 | $ | 19,877 | $ | 8,738 | $ | 2,044 | $ | 7,563 | $ | 9,825 | $ | 11,869 | 40 | % | 23 | % | ||||||||||||||||||||||||||||||||||||||||
| Fund IX | 2018 | 29,205 | 24,729 | 23,050 | 16,057 | 15,877 | 24,402 | 40,459 | 24 | 16 | |||||||||||||||||||||||||||||||||||||||||||||||||
| Fund VIII | 2013 | 6,937 | 18,377 | 16,615 | 23,682 | 3,598 | 4,000 | 27,682 | 13 | 9 | |||||||||||||||||||||||||||||||||||||||||||||||||
| Fund VII | 2008 | — | 14,677 | 16,461 | 34,294 | — | — | 34,294 | 33 | 25 | |||||||||||||||||||||||||||||||||||||||||||||||||
| Fund VI | 2006 | 373 | 10,136 | 12,457 | 21,136 | 405 | — | 21,136 | 12 | 9 | |||||||||||||||||||||||||||||||||||||||||||||||||
| Fund V | 2001 | — | 3,742 | 5,192 | 12,724 | — | — | 12,724 | 61 | 44 | |||||||||||||||||||||||||||||||||||||||||||||||||
Fund I, II, III, IV & MIA2
|
Various | 9 | 7,320 | 8,753 | 17,400 | — | — | 17,400 | 39 | 26 | |||||||||||||||||||||||||||||||||||||||||||||||||
Traditional Private Equity Funds3
|
$ | 57,902 | $ | 98,858 | $ | 91,266 | $ | 127,337 | $ | 27,443 | $ | 38,227 | $ | 165,564 | 39 | 24 | |||||||||||||||||||||||||||||||||||||||||||
AIOF III5
|
N/A | 1,798 | 1,793 | 419 | — | 419 | 476 | 476 |
NM4
|
NM4
|
|||||||||||||||||||||||||||||||||||||||||||||||||
| AIOF II | 2021 | 2,849 | 2,542 | 2,120 | 1,126 | 1,351 | 1,700 | 2,826 | 15 | 10 | |||||||||||||||||||||||||||||||||||||||||||||||||
| AIOF I | 2018 | 37 | 897 | 803 | 1,280 | — | — | 1,280 | 22 | 16 | |||||||||||||||||||||||||||||||||||||||||||||||||
| HVF II | 2022 | 5,333 | 4,592 | 4,214 | 1,081 | 3,660 | 4,518 | 5,599 | 16 | 12 | |||||||||||||||||||||||||||||||||||||||||||||||||
| HVF I | 2019 | 1,910 | 3,238 | 3,698 | 4,478 | 820 | 1,317 | 5,795 | 22 | 17 | |||||||||||||||||||||||||||||||||||||||||||||||||
| Total Equity | $ | 69,829 | $ | 111,920 | $ | 102,520 | $ | 135,302 | $ | 33,693 | $ | 46,238 | $ | 181,540 | |||||||||||||||||||||||||||||||||||||||||||||
1 Accord funds have investment periods shorter than 24 months, therefore Gross and Net IRR are presented after 12 months of investing.
| |||||||||||||||||||||||||||||||||||||||||||||||||||||||||||
2 The general partners and managers of Funds I, II and MIA, as well as the general partner of Fund III, were excluded assets in connection with the reorganization of the Company that occurred in 2007. As a result, Apollo did not receive the economics associated with these entities. The investment performance of these funds, combined with Fund IV, is presented to illustrate fund performance associated with Apollo’s investment professionals.
| |||||||||||||||||||||||||||||||||||||||||||||||||||||||||||
3 Total IRR is calculated based on total cash flows for all funds presented.
| |||||||||||||||||||||||||||||||||||||||||||||||||||||||||||
4 Data has not been presented as the fund’s effective date is less than 24 months prior to the period indicated and such information was deemed not meaningful.
| |||||||||||||||||||||||||||||||||||||||||||||||||||||||||||
5 Vintage Year is not yet applicable as the fund has not had its final closing.
| |||||||||||||||||||||||||||||||||||||||||||||||||||||||||||
140
Equity
The following table summarizes the investment record for distressed investments made in our traditional private equity fund portfolios since the Company’s inception. All amounts are as of June 30, 2025.
| (In millions, except percentages) | Total Invested Capital | Total Value | Gross IRR | ||||||||||||||
| Distressed for Control | $ | 8,993 | $ | 20,149 | 29 | % | |||||||||||
| Non-Control Distressed | 6,374 | 12,587 | 71 | ||||||||||||||
| Total | 15,367 | 32,736 | 49 | ||||||||||||||
Corporate Carve-outs, Opportunistic Buyouts and Other Credit1
|
75,899 | 132,828 | 21 | ||||||||||||||
| Total | $ | 91,266 | $ | 165,564 | 39 | % | |||||||||||
1 Other Credit is defined as investments in debt securities of issuers other than portfolio companies that are not considered to be distressed.
| |||||||||||||||||
The following tables provide additional detail on the composition of the Fund X, Fund IX and Fund VIII private equity portfolios based on investment strategy. Amounts for Fund I, II, III, IV, V, VI and VII are included in the table above but not presented below as their remaining value is less than $100 million, the fund has been liquidated or the fund commenced investing capital less than 24 months prior to June 30, 2025 and such information was deemed not meaningful. All amounts are as of June 30, 2025.
Fund X
| (In millions) | Total Invested Capital | Total Value | |||||||||
| Corporate Carve-outs | $ | 720 | $ | 1,157 | |||||||
| Opportunistic Buyouts | 7,730 | 9,580 | |||||||||
Distressed1
|
288 | 1,132 | |||||||||
| Total | $ | 8,738 | $ | 11,869 | |||||||
Fund IX
| (In millions) | Total Invested Capital | Total Value | |||||||||
| Corporate Carve-outs | $ | 5,805 | $ | 11,842 | |||||||
| Opportunistic Buyouts | 15,460 | 24,283 | |||||||||
Distressed1
|
1,785 | 4,334 | |||||||||
| Total | $ | 23,050 | $ | 40,459 | |||||||
Fund VIII
| (In millions) | Total Invested Capital | Total Value | |||||||||
| Corporate Carve-outs | $ | 2,704 | $ | 7,060 | |||||||
| Opportunistic Buyouts | 13,344 | 19,868 | |||||||||
Distressed1
|
567 | 754 | |||||||||
| Total | $ | 16,615 | $ | 27,682 | |||||||
1 The distressed investment strategy includes distressed for control, non-control distressed and other credit. Other credit is defined as investments in debt securities of issuers other than portfolio companies that are not considered to be distressed.
| |||||||||||
141
Perpetual Capital
The following table summarizes the investment record for the perpetual capital vehicles we manage, excluding Athene and Athora-related assets.
| Total Returns | |||||||||||||||||||||||||||||||||||
| (In millions) |
IPO Year1
|
Total AUM | For the Three Months Ended June 30, 2025 | For the Three Months Ended June 30, 2024 | For the Six Months Ended June 30, 2025 | For the Six Months Ended June 30, 2024 | |||||||||||||||||||||||||||||
ADS2
|
N/A | $ | 22,510 | 2 | % | 3 | % | 4 | % | 6 | % | ||||||||||||||||||||||||
MidCap FinCo3
|
N/A | 13,009 | 4 | % | 4 | % | 8 | % | 8 | % | |||||||||||||||||||||||||
ARI4
|
2009 | 9,842 | 4 | % | (9) | % | 18 | % | (10) | % | |||||||||||||||||||||||||
MFIC4,5
|
2004 | 3,892 | 1 | % | 3 | % | (1) | % | 16 | % | |||||||||||||||||||||||||
ADREF6
|
N/A | 5,155 | — | % | 1 | % | — | % | (2) | % | |||||||||||||||||||||||||
ADCF6
|
N/A | 1,702 | 3 | % | 2 | % | 5 | % | 5 | % | |||||||||||||||||||||||||
ARIS6
|
N/A | 1,582 | 1 | % | 1 | % | 3 | % | 3 | % | |||||||||||||||||||||||||
Other7
|
N/A | 14,551 | N/A | N/A | N/A | N/A | |||||||||||||||||||||||||||||
| Total | $ | 72,243 | |||||||||||||||||||||||||||||||||
1 An initial public offering (“IPO”) year represents the year in which the vehicle commenced trading on a national securities exchange.
|
|||||||||||||||||||||||||||||||||||
2 ADS is not a publicly traded vehicle and therefore IPO year is not applicable. The returns presented are net returns based on NAV.
| |||||||||||||||||||||||||||||||||||
3 MidCap FinCo is not a publicly traded vehicle and therefore IPO year is not applicable. The returns presented are a gross return based on NAV. The net returns based on NAV were 3% and 3% for the three months ended June 30, 2025 and 2024, respectively. The net returns based on NAV were 7% and 6% for the six months ended June 30, 2025 and 2024, respectively.
|
|||||||||||||||||||||||||||||||||||
4 Total returns are based on the change in closing trading prices during the respective periods presented taking into account dividends and distributions, if any, as if they were reinvested without regard to commission.
|
|||||||||||||||||||||||||||||||||||
5 AUM is presented on a three-month lag, as of March 31, 2025, based upon the availability of the information.
| |||||||||||||||||||||||||||||||||||
6 ADREF, ADCF and ARIS are not publicly traded vehicles and therefore IPO years are not applicable. The returns presented are for their respective Class I shares and are net returns based on NAV.
|
|||||||||||||||||||||||||||||||||||
7 Other includes, among others, AUM of $1.9 billion related to a publicly traded business development company from which Apollo earns investment-related service fees, but for which Apollo does not provide management or advisory services, as of March 31, 2025. Returns and IPO year are not provided for this AUM. Other also includes AUM of $8.9 billion related to third-party capital within AAA.
|
|||||||||||||||||||||||||||||||||||
142
Summary of Non-U.S. GAAP Measures
The table below sets forth a reconciliation of net income attributable to Apollo Global Management, Inc. common stockholders to Segment Income and Adjusted Net Income:
| Three months ended June 30, | Six months ended June 30, | ||||||||||||||||||||||
| (In millions) | 2025 | 2024 | 2025 | 2024 | |||||||||||||||||||
| GAAP Net Income (Loss) Attributable to Apollo Global Management, Inc. | $ | 605 | $ | 828 | $ | 1,023 | $ | 2,231 | |||||||||||||||
| Preferred dividends | 25 | 25 | 49 | 49 | |||||||||||||||||||
| Net income (loss) attributable to non-controlling interests | 212 | 324 | 708 | 662 | |||||||||||||||||||
| GAAP Net Income (Loss) | $ | 842 | $ | 1,177 | $ | 1,780 | $ | 2,942 | |||||||||||||||
| Income tax provision (benefit) | 3 | 261 | 246 | 683 | |||||||||||||||||||
| GAAP Income (Loss) Before Income Tax Provision (Benefit) | $ | 845 | $ | 1,438 | $ | 2,026 | $ | 3,625 | |||||||||||||||
| Asset Management Adjustments: | |||||||||||||||||||||||
Equity-based profit sharing expense1
|
38 | 45 | 68 | 139 | |||||||||||||||||||
| Equity-based compensation | 102 | 84 | 201 | 158 | |||||||||||||||||||
| Net (income) loss attributable to non-controlling interests in consolidated entities | (266) | (323) | (815) | (700) | |||||||||||||||||||
| Unrealized performance fees | 28 | (86) | (91) | (354) | |||||||||||||||||||
| Unrealized profit sharing expense | (43) | 35 | 62 | 194 | |||||||||||||||||||
HoldCo interest and other financing costs2
|
36 | 15 | 70 | 30 | |||||||||||||||||||
| Unrealized principal investment (income) loss | (11) | 1 | (9) | (10) | |||||||||||||||||||
| Unrealized net (gains) losses from investment activities | 293 | 20 | 354 | 4 | |||||||||||||||||||
Transaction-related costs, restructuring and other non-operating expenses3
|
70 | 67 | 346 | 118 | |||||||||||||||||||
| Retirement Services Adjustments: | |||||||||||||||||||||||
| Investment (gains) losses, net of offsets | 509 | 124 | 358 | 146 | |||||||||||||||||||
Non-operating change in insurance liabilities and related derivatives4
|
(149) | (203) | 218 | (876) | |||||||||||||||||||
| Integration, restructuring and other non-operating expenses | 32 | 31 | 62 | 61 | |||||||||||||||||||
| Equity-based compensation | 11 | 11 | 22 | 24 | |||||||||||||||||||
| Segment Income | 1,495 | 1,259 | 2,872 | 2,559 | |||||||||||||||||||
HoldCo interest and other financing costs2
|
(36) | (15) | (70) | (30) | |||||||||||||||||||
| Taxes and related payables | (280) | (235) | (504) | (456) | |||||||||||||||||||
| Adjusted Net Income | $ | 1,179 | $ | 1,009 | $ | 2,298 | $ | 2,073 | |||||||||||||||
1 Equity-based profit sharing expense includes certain profit sharing arrangements in which a portion of performance fees distributed to the general partner are required to be used by employees of Apollo to purchase restricted shares of common stock or is delivered in the form of RSUs, which are granted under the Equity Plan. Equity-based profit sharing expense and other also includes performance grants which are tied to the Company’s receipt of performance fees, within prescribed periods, sufficient to cover the associated equity-based compensation expense.
| |||||||||||||||||||||||
2 Represents interest and other financing costs related to AGM not attributable to any specific segment.
| |||||||||||||||||||||||
3 Transaction-related costs, restructuring and other non-operating expenses includes; (a) contingent consideration, certain equity-based charges, amortization of intangible assets and certain other expenses associated with acquisitions; (b) gains (losses) from changes in the tax receivable agreement liability; (c) merger-related transaction and integration costs associated with the Company’s merger with Athene and (d) other non-operating expenses, including the issuance of shares of AGM common stock for charitable contributions. In the six months ended June 30, 2025, other non-operating expenses includes $200 million in charitable contributions related to the issuance of shares to the Apollo DAF in February 2025.
| |||||||||||||||||||||||
4 Includes change in fair values of derivatives and embedded derivatives, non-operating change in funding agreements, change in fair value of market risk benefits, and non-operating change in liability for future policy benefits.
| |||||||||||||||||||||||
143
The table below sets forth a reconciliation of common stock outstanding to our Adjusted Net Income Shares Outstanding:
| June 30, 2025 | December 31, 2024 | ||||||||||
| Total GAAP Common Stock Outstanding | 572,024,038 | 565,738,933 | |||||||||
| Non-GAAP Adjustments: | |||||||||||
Mandatory Convertible Preferred Stock1
|
14,547,261 | 14,536,019 | |||||||||
| Vested RSUs | 16,162,939 | 21,337,132 | |||||||||
| Unvested RSUs Eligible for Dividend Equivalents | 12,749,090 | 11,455,245 | |||||||||
| Adjusted Net Income Shares Outstanding | 615,483,328 | 613,067,329 | |||||||||
1 Reflects the number of shares of underlying common stock assumed to be issuable upon conversion of the Mandatory Convertible Preferred Stock during each period.
| |||||||||||
The table below sets forth a reconciliation of Athene’s total investments, including related parties, to net invested assets:
| (In millions) | June 30, 2025 | December 31, 2024 | |||||||||
| Total investments, including related parties | $ | 329,599 | $ | 291,167 | |||||||
| Derivative assets | (6,901) | (8,154) | |||||||||
| Cash and cash equivalents (including restricted cash) | 12,049 | 13,676 | |||||||||
| Accrued investment income | 3,176 | 2,816 | |||||||||
| Net receivable (payable) for collateral on derivatives | (1,682) | (4,602) | |||||||||
| Reinsurance impacts | (5,226) | (4,435) | |||||||||
| VIE and VOE assets, liabilities and non-controlling interests | 18,443 | 17,613 | |||||||||
| Unrealized (gains) losses | 12,202 | 18,320 | |||||||||
| Ceded policy loans | (162) | (167) | |||||||||
| Net investment receivables (payables) | (49) | 97 | |||||||||
| Allowance for credit losses | 774 | 720 | |||||||||
| Other investments | (428) | (87) | |||||||||
| Total adjustments to arrive at gross invested assets | 32,196 | 35,797 | |||||||||
| Gross invested assets | 361,795 | 326,964 | |||||||||
| ACRA non-controlling interests | (86,755) | (78,321) | |||||||||
| Net invested assets | $ | 275,040 | $ | 248,643 | |||||||
Liquidity and Capital Resources
Overview
The Company primarily derives revenues and cash flows from the assets it manages and the retirement savings products it issues, reinsures and acquires. Based on management’s experience, we believe the Company’s current liquidity position, together with the cash generated from revenues will be sufficient to meet the Company’s anticipated expenses and other working capital needs for at least the next 12 months. For the longer-term liquidity needs of the asset management business, we expect to continue to fund the asset management business’ operations through management fees and performance fees received. The principal sources of liquidity for the retirement services business, in the ordinary course of business, are operating cash flows and holdings of cash, cash equivalents and other readily marketable assets.
AGM is a holding company whose primary source of cash flow is distributions and other intercompany transfers from its subsidiaries, which are expected to be sufficient to fund cash flow requirements based on current estimates of future obligations. AGM’s primary liquidity needs include the cash-flow requirements relating to its corporate activities, including its day-to-day operations, common stock and preferred stock dividend payments and strategic transactions, such as acquisitions.
At June 30, 2025, the Company had $12.7 billion of unrestricted cash and cash equivalents, as well as $5.1 billion of available funds from the AGM credit facility, AHL credit facility and AHL liquidity facility.
144
Primary Uses of Cash
Over the next 12 months, we expect the Company’s primary liquidity needs will be to:
•support the future growth of Apollo’s businesses through strategic corporate investments;
•pay the Company’s operating expenses, including, compensation, general, administrative, and other expenses;
•make payments to policyholders for surrenders, withdrawals and payout benefits;
•make interest and principal payments on funding agreements;
•make payments to satisfy pension group annuity obligations and policy acquisition costs;
•make interest payments on the Company’s debt;
•pay taxes and tax related payments;
•pay cash dividends;
•repurchase common stock; and
•make payments under the tax receivable agreement.
Over the long term, we believe we will be able to (i) grow Apollo’s Assets Under Management and generate positive investment performance in the funds we manage, which we expect will allow us to grow the Company’s management fees and performance fees and (ii) grow the investment portfolio of retirement services, in each case in amounts sufficient to cover our long-term liquidity requirements, which may include:
•supporting the future growth of our businesses;
•creating new or enhancing existing products and investment platforms;
•making payments to policyholders;
•pursuing new strategic corporate investment opportunities;
•paying interest and principal on the Company’s financing arrangements;
•repurchasing common stock;
•making payments under the tax receivable agreement; and
•paying cash dividends.
Cash Flow Analysis
The section below discusses in more detail the Company’s primary sources and uses of cash and the primary drivers of cash flows within the Company’s condensed consolidated statements of cash flows:
| Six months ended June 30, | |||||||||||
| (In millions) | 2025 | 2024 | |||||||||
| Operating Activities | $ | 2,274 | $ | 1,403 | |||||||
| Investing Activities | (36,517) | (31,085) | |||||||||
| Financing Activities | 32,089 | 29,976 | |||||||||
| Effect of exchange rate changes on cash and cash equivalents | 13 | (2) | |||||||||
| Net increase (decrease) in cash and cash equivalents, restricted cash and cash held at consolidated variable interest entities | $ | (2,141) | $ | 292 | |||||||
145
The assets of our consolidated funds and VIEs, on a gross basis, could have a substantial effect on the accompanying statement of cash flows. Because our consolidated funds and VIEs are generally treated as investment companies for accounting purposes, their investing cash flow amounts are included in our cash flows from operating activities. The table below summarizes our condensed consolidated statements of cash flow by activity attributable to the Company and to our consolidated funds and VIEs.
| Six months ended June 30, | |||||||||||
| (In millions) | 2025 | 2024 | |||||||||
| Net cash provided by the Company's operating activities | $ | 2,441 | $ | 1,686 | |||||||
| Net cash used in the Consolidated Funds and VIEs operating activities | (167) | (283) | |||||||||
| Net cash provided by operating activities | 2,274 | 1,403 | |||||||||
| Net cash used in the Company's investing activities | (35,450) | (30,205) | |||||||||
| Net cash used in the Consolidated Funds and VIEs investing activities | (1,067) | (880) | |||||||||
| Net cash used in investing activities | (36,517) | (31,085) | |||||||||
| Net cash provided by the Company's financing activities | 31,392 | 27,943 | |||||||||
| Net cash provided by the Consolidated Funds and VIEs financing activities | 697 | 2,033 | |||||||||
| Net cash provided by financing activities | $ | 32,089 | $ | 29,976 | |||||||
Operating Activities
The Company’s operating activities support its Asset Management, Retirement Services and Principal Investing activities. The primary sources of cash within operating activities include: (a) management fees, (b) advisory and transaction fees, (c) realized performance revenues, (d) realized principal investment income, (e) investment sales from our consolidated funds and VIEs, (f) net investment income and (g) insurance premiums. The primary uses of cash within operating activities include: (a) compensation and non-compensation related expenses, (b) interest and taxes, (c) investment purchases from our consolidated funds and VIEs, (d) benefit payments and (e) other operating expenses.
•During the six months ended June 30, 2025, cash provided by operating activities reflects cash inflows of management fees, advisory and transaction fees, realized performance revenues, realized principal investment income, and net investment income, partially offset by pension group annuity benefit payments and cash paid for interest on funding agreements, policy acquisition expenses and other operating expenses. Net cash provided by operating activities includes net cash used by our consolidated funds and VIEs, which primarily includes net purchases of VIE’s investments, partially offset by proceeds from the sale of VIEs’ investments.
•During the six months ended June 30, 2024, cash provided by operating activities reflects cash inflows of management fees, advisory and transaction fees, realized performance revenues, realized principal investment income and net investment income, partially offset by pension group annuity benefit payments, net of cash inflows, and cash paid for policy acquisition and other operating expenses. Net cash provided by operating activities includes net cash used in our consolidated funds and VIEs, which primarily includes net payments for purchases of VIEs’ investments, partially offset by proceeds from the sale of VIEs’ investments.
Investing Activities
The Company’s investing activities support the growth of its business. The primary sources of cash within investing activities include: (a) distributions from investments and (b) sales, maturities and repayments of investments. The primary uses of cash within investing activities include: (a) capital expenditures, (b) purchases and acquisitions of new investments, including purchases of U.S. Treasury securities and (c) equity method investments in the funds we manage.
•During the six months ended June 30, 2025, cash used in investing activities primarily reflects the purchase of investments, mainly AFS and mortgage loans, due to the deployment of significant cash inflows from Athene’s organic growth and cash collateral posted by Athene for derivative transactions, partially offset by the sales, maturities and repayments of investments and an increase in net investment payables.
•During the six months ended June 30, 2024, cash used in investing activities primarily reflects the purchase of investments, mainly AFS and mortgage loans, due to the deployment of significant cash inflows from Athene’s
146
organic growth and cash collateral posted by Athene for derivative transactions, partially offset by the sales, maturities and repayments of investments.
Financing Activities
The Company’s financing activities reflect its capital market transactions and transactions with equity holders. The primary sources of cash within financing activities includes: (a) proceeds from debt and preferred equity issuances, (b) inflows on Athene’s investment-type policies and contracts, (c) changes of cash collateral for derivative transactions posted by counterparties, (d) capital contributions, and (e) proceeds from other borrowing activities. The primary uses of cash within financing activities include: (a) dividends, (b) payments under the tax receivable agreement, (c) share repurchases, (d) cash paid to settle tax withholding obligations in connection with net share settlements of equity-based awards, (e) repayments of debt, (f) withdrawals on Athene’s investment-type policies and contracts, (g) changes of cash collateral for derivative transactions posted by counterparties and (h) capital distributions.
•During the six months ended June 30, 2025, cash provided by financing activities primarily reflects cash received from deferred annuity and funding agreement inflows, net of cash outflows, cash proceeds from the issuance of long-term debt and net capital contributions from non-controlling interests, partially offset by a decrease in cash collateral posted by counterparties for derivative transactions, the repayment of outstanding short-term repurchase agreements, cash paid for the redemption of Athene’s Series C preferred stock and the payment of common and preferred stock dividends. Cash provided in financing activities of our consolidated funds and VIEs primarily includes proceeds from the issuance of debt and contributions from non-controlling interests, partially offset by repayment of debt and distributions to non-controlling interests.
•During the six months ended June 30, 2024, cash provided by financing activities primarily reflects cash received from the strong organic retail and funding agreement inflows, net of cash outflows, a favorable change in cash collateral for derivative transactions posted by counterparties related to the favorable equity market performance, issuances of debt by our subsidiary and net capital contributions from non-controlling interests, partially offset by repayment of debt and payment of common and preferred stock dividends. Cash provided by financing activities of our consolidated funds and VIEs primarily includes proceeds from the issuance of debt, offset by repayment of debt.
Contractual Obligations, Commitments and Contingencies
For a summary and a description of the nature of the Company’s commitments, contingencies and contractual obligations, see note 16 to the condensed consolidated financial statements and “—Contractual Obligations, Commitments and Contingencies.” The Company’s commitments are primarily fulfilled through cash flows from operations and financing activities.
Consolidated Funds and VIEs
The Company manages its liquidity needs by evaluating unconsolidated cash flows; however, the Company’s financial statements reflect the financial position of Apollo as well as Apollo’s consolidated funds and VIEs. The primary sources and uses of cash at Apollo’s consolidated funds and VIEs include: (a) raising capital from their investors, which have been reflected historically as non-controlling interests of the consolidated subsidiaries in our financial statements, (b) using capital to make investments, (c) generating cash flows from operations through distributions, interest and the realization of investments, (d) distributing cash flow to investors, and (e) issuing debt to finance investments (CLOs).
Dividends and Distributions
For information regarding the quarterly dividends that were made to common stockholders and distribution equivalents on participating securities, see note 13 to the condensed consolidated financial statements. Although the Company currently expects to pay dividends, we may not pay dividends if, among other things, we do not have the cash necessary to pay the dividends. To the extent we do not have cash on hand sufficient to pay dividends, we may have to borrow funds to pay dividends, or we may determine not to pay dividends. The declaration, payment and determination of the amount of our dividends are at the sole discretion of the AGM board of directors.
Because AGM is a holding company, the primary source of funds for AGM’s dividends is distributions and other intercompany transfers from its operating subsidiaries, AAM and AHL, which are expected to be adequate to fund AGM’s dividends and other cash flow requirements based on current estimates of future obligations. The ability of these operating subsidiaries to
147
make distributions to AGM will depend on satisfying applicable law with respect to such distributions, including surplus and minimum solvency requirements among others, as well as making prior distributions on AHL outstanding preferred stock. Moreover, the ability of AAM and AHL to receive distributions from their own respective subsidiaries will continue to depend on applicable law with respect to such distributions.
On August 5, 2025, AGM declared a cash dividend of $0.51 per share of its common stock, which will be paid on August 29, 2025 to holders of record at the close of business on August 18, 2025.
On August 5, 2025, the Company also declared and set aside a cash dividend of $0.8438 per share of its Mandatory Convertible Preferred Stock, which will be paid on October 31, 2025 to holders of record at the close of business on October 15, 2025.
Repurchase of Securities
Share Repurchase Program
For information regarding the Company’s share repurchase program, see note 13 to the condensed consolidated financial statements.
Repurchase of Other Securities
We may from time to time seek to retire or purchase our other outstanding debt or equity securities through cash purchases and/or exchanges for other securities, purchases in the open market, privately negotiated transactions or otherwise. Any such repurchases will be dependent upon several factors, including our liquidity requirements, contractual restrictions, general market conditions and applicable regulatory, legal and accounting factors. Whether or not we repurchase any of our other securities and the size and timing of any such repurchases will be determined at our discretion.
Mandatory Convertible Preferred Stock
On August 11, 2023, the Company issued 28,750,000 shares, or $1.4 billion aggregate liquidation preference, of its 6.75% Series A Mandatory Convertible Preferred Stock. There were 28,749,765 shares of Mandatory Convertible Preferred Stock issued and outstanding as of June 30, 2025. See note 13 to the condensed consolidated financial statements for further details.
Asset Management Liquidity
Our asset management business requires limited capital resources to support the working capital or operating needs of the business. For the asset management business’ longer-term liquidity needs, we expect to continue to fund the asset management business’ operations through management fees and performance fees received. Liquidity needs are also met (to a limited extent) through proceeds from borrowings and equity issuances as described in notes 11 and 13 to the condensed consolidated financial statements, respectively. From time to time, if the Company determines that market conditions are favorable after taking into account our liquidity requirements, we may seek to raise proceeds through the issuance of additional debt or equity instruments. AGM has a registration statement on Form S-3 to provide it with access to the capital markets, subject to market conditions and other factors.
At June 30, 2025, the asset management business had $2.4 billion of unrestricted cash and cash equivalents, as well as $1.25 billion of available funds from the AGM credit facility.
Future Debt Obligations
The asset management business had long-term debt of $4.3 billion at June 30, 2025, which includes notes with maturities in 2026, 2029, 2030, 2033, 2048, 2053 and 2054. See note 11 to the condensed consolidated financial statements for further information regarding the asset management business’ debt arrangements.
Future Cash Flows
Our ability to execute our business strategy, particularly our ability to increase our AUM, depends on our ability to establish new funds and to raise additional investor capital within such funds. Our liquidity will depend on a number of factors, such as our ability to project our financial performance, which is highly dependent on the funds we manage and our ability to manage
148
our projected costs, fund performance, access to credit facilities, compliance with existing credit agreements, as well as industry and market trends. Also during economic downturns the funds we manage might experience cash flow issues or liquidate entirely. In these situations we might be asked to reduce or eliminate the management fee and performance fees we charge, which could adversely impact our cash flow in the future.
An increase in the fair value of the investments of the funds we manage, by contrast, could favorably impact our liquidity through higher management fees where the management fees are calculated based on the net asset value, gross assets or adjusted assets. Additionally, higher performance fees not yet realized would generally result when investments appreciate over their cost basis which would not have an impact on the asset management business’ cash flow until realized.
Consideration of Financing Arrangements
As noted above, in limited circumstances, the asset management business may issue debt or equity to supplement its liquidity. The decision to enter into a particular financing arrangement is made after careful consideration of various factors, including the asset management business’ cash flows from operations, future cash needs, current sources of liquidity, demand for the asset management business’ debt or equity, and prevailing interest rates.
Revolver Facility
Under the AGM credit facility, AGM and AMH, as parent borrower and subsidiary borrower, respectively, may borrow in an aggregate amount not to exceed $1.25 billion and may incur incremental facilities in an aggregate amount not to exceed $250 million plus additional amounts so long as AGM and AMH are in compliance with a net leverage ratio not to exceed 4.00 to 1.00. Borrowings under the AGM credit facility may be used for working capital and general corporate purposes, including without limitation, permitted acquisitions. The AGM credit facility has a final maturity date of November 21, 2029.
Tax Receivable Agreement
The tax receivable agreement provides for the payment to the Former Managing Partners and Contributing Partners of 85% of the amount of cash savings, if any, in U.S. federal, state, local and foreign income taxes that AGM and its subsidiaries realize subject to the agreement. For more information regarding the tax receivable agreement, see note 15 to the condensed consolidated financial statements.
Athora
Athora is a strategic liabilities platform that acquires and reinsures traditional closed life insurance policies and provides capital and reinsurance solutions to insurers in Europe. In 2017, an AAM subsidiary made a €125 million commitment to Athora, which was fully drawn as of April 2020. An AAM subsidiary committed an incremental €58 million in 2020 to purchase new equity interests. Additionally, in 2021, an AAM subsidiary acquired approximately €21.9 million of new equity interests in Athora.
In December 2021, an AAM subsidiary committed an additional €250 million to purchase new equity interests to support Athora’s ongoing growth initiatives, of which €180 million was drawn as of June 30, 2025. On July 3, 2025, AAM made a conditional commitment to invest, or cause one or more of its affiliates to invest, in Athora for up to an additional $2.0 billion, in connection with the Athora transaction. The Athora transaction remains subject to closing conditions, including receipt of regulatory approvals. The amount ultimately funded pursuant to the conditional commitment, and sources of funding, are subject to change as a result of an anticipated capital raise by Athora between signing and closing of the Athora transaction.
An AAM subsidiary and Athene are minority investors in Athora with a long-term strategic relationship. Through its share ownership, the AAM subsidiary has approximately 19.9% of the total voting power in Athora, and Athene holds shares in Athora representing 10% of the total voting power in Athora. In addition, Athora shares held by funds and other accounts managed by Apollo represent, in the aggregate, approximately 15.1% of the total voting power in Athora. See note 15 to the condensed consolidated financial statements for additional details on AAM’s and Athene’s conditional commitments to Athora.
Fund Escrow
As of June 30, 2025, the remaining investments and escrow cash of Fund VIII was valued at 83% of the fund’s unreturned capital, which was below the required escrow ratio of 115%. As a result, the fund is required to place in escrow current and
149
future performance fee distributions to the general partner until the specified return ratio of 115% is met (at the time of a future distribution) or upon liquidation. Realized performance fees currently distributed to the general partner are limited to potential tax distributions and interest on escrow balances per the fund’s partnership agreement.
Clawback
Performance fees from certain of the funds we manage are subject to contingent repayment by the general partner in the event of future losses to the extent that the cumulative performance fees distributed from inception to date exceeds the amount computed as due to the general partner at the final distribution. See “—Overview of Results of Operations—Performance Fees” for the maximum performance fees subject to potential reversal by each fund.
Indemnification Liability
The asset management business recorded an indemnification liability in the event that the Former Managing Partners, Contributing Partners and certain investment professionals are required to pay amounts in connection with a general partner obligation to return previously distributed performance fees. See note 15 to the condensed consolidated financial statements for further information regarding the asset management business’ indemnification liability.
Retirement Services Liquidity
There are two forms of liquidity relevant to our retirement services business: funding liquidity and balance sheet liquidity. Funding liquidity relates to the ability to fund operations. Balance sheet liquidity relates to the ability to sell assets held in Athene’s investment portfolio without incurring significant costs from fees, bid-offer spreads, or market impact. Athene manages its liquidity position by matching projected cash demands with adequate sources of cash and other liquid assets. The principal sources of liquidity for our retirement services business, in the ordinary course of business, are operating cash flows and holdings of cash, cash equivalents and other readily marketable assets.
Athene’s investment portfolio is structured to ensure a strong liquidity position over time to permit timely payment of policy and contract benefits without requiring asset sales at inopportune times or at depressed prices. In general, liquid assets include cash and cash equivalents, highly rated bonds, short-term investments, unaffiliated preferred stock and public common stock, all of which generally have liquid markets with a large number of buyers, but exclude pledged assets, mainly associated with funding agreement and repurchase agreement liabilities. Assets included in modified coinsurance and funds withheld portfolios, including assets held in reinsurance trusts, are available to fund the benefits for the associated obligations but are restricted from other uses. Although the investment portfolio of our retirement services business does contain assets that are generally considered less liquid for liquidity monitoring purposes (primarily mortgage loans, policy loans, real estate and investment funds), there is some ability to raise cash from these assets if needed.
Athene has access to additional liquidity through its AHL credit facility and AHL liquidity facility. The AHL credit facility has a borrowing capacity of $1.25 billion, subject to being increased up to $1.75 billion in total on the terms described in the AHL credit facility. The AHL credit facility has a commitment termination date of June 30, 2028, subject to up to two one-year extensions, and was undrawn as of June 30, 2025. Athene entered into a new AHL liquidity facility on June 27, 2025, which replaced its previous agreement dated as of June 28, 2024. The AHL liquidity facility has a borrowing capacity of $2.6 billion, subject to being increased up to $3.1 billion in total on the terms described in the AHL liquidity facility. The AHL liquidity facility has a commitment termination date of June 26, 2026, subject to additional 364-day extensions, and was undrawn as of June 30, 2025. Athene also has access to $2.0 billion of committed repurchase facilities. Athene has a registration statement on Form S-3 to provide it with access to the capital markets, subject to market conditions and other factors. Athene is also the counterparty to repurchase agreements with several different financial institutions, pursuant to which it may obtain short-term liquidity, to the extent available. In addition, through Athene’s membership in the FHLB, it is eligible to borrow under variable rate short-term federal funds arrangements to provide additional liquidity.
Athene proactively manages its liquidity position to meet cash needs while minimizing adverse impacts on investment returns. Athene analyzes its cash-flow liquidity over the upcoming 12 months by modeling potential demands on liquidity under a variety of scenarios, taking into account the provisions of its policies and contracts in force, its cash flow position, and the volume of cash and readily marketable securities in its portfolio.
Liquidity risk is monitored, managed and mitigated through a number of stress tests and analyses to assess Athene’s ability to meet its cash flow requirements, as well as the ability of its reinsurance and insurance subsidiaries to meet their collateral
150
obligations, under various stress scenarios. Athene further seeks to mitigate liquidity risk by maintaining access to alternative, external sources of liquidity.
Insurance Subsidiaries’ Operating Liquidity
The primary cash flow sources for Athene’s insurance subsidiaries include retirement services product inflows (premiums and deposits), investment income, principal repayments on its investments, net transfers from separate accounts and financial product inflows. Uses of cash include investment purchases, payments to policyholders for surrenders, withdrawals and payout benefits, interest and principal payments on funding agreements and outstanding debt, payments to satisfy pension group annuity obligations, policy acquisition and general operating costs and payment of cash dividends.
Athene’s policyholder obligations are generally long-term in nature. However, policyholders may elect to withdraw some, or all, of their account value in amounts that exceed Athene’s estimates and assumptions over the life of an annuity contract. Athene includes provisions within its annuity policies, such as surrender charges and MVAs, which are intended to protect it from early withdrawals. As of June 30, 2025 and December 31, 2024, approximately 84% and 82%, respectively, of Athene’s deferred annuity liabilities were subject to penalty upon surrender. In addition, as of June 30, 2025 and December 31, 2024, approximately 68% and 66%, respectively, of policies contained MVAs that may also have the effect of limiting early withdrawals if interest rates increase but may encourage early withdrawals by effectively subsidizing a portion of surrender charges when interest rates decrease. As of June 30, 2025, approximately 36% of Athene’s net reserve liabilities were generally non-surrenderable, including buy-out pension group annuities other than those that can be withdrawn as lump sums, funding agreements and payout annuities, while 52% were subject to penalty upon surrender.
Membership in Federal Home Loan Bank
Through its membership in the FHLB, Athene is eligible to borrow under variable rate short-term federal funds arrangements to provide additional liquidity. The borrowings must be secured by eligible collateral such as mortgage loans, eligible CMBS or RMBS, government or agency securities and guaranteed loans. As of each of June 30, 2025 and December 31, 2024, Athene had no outstanding borrowings under these arrangements.
Athene has issued funding agreements to the FHLB. These funding agreements were issued in an investment spread strategy, consistent with other investment spread operations. As of June 30, 2025 and December 31, 2024, Athene had funding agreements outstanding with the FHLB in the aggregate principal amount of $21.0 billion and $15.6 billion, respectively.
The maximum FHLB indebtedness by a member is determined by the amount of collateral pledged and cannot exceed a specified percentage of the member’s total statutory assets dependent on the internal credit rating assigned to the member by the FHLB. As of June 30, 2025, Athene’s total maximum borrowing capacity under the FHLB facilities was limited to $58.6 billion. However, Athene’s ability to borrow under the facilities is constrained by the availability of assets that qualify as eligible collateral under the facilities and certain other limitations. Considering these limitations, as of June 30, 2025, Athene had the ability to draw up to an estimated $25.4 billion, inclusive of borrowings then outstanding. This estimate is based on Athene’s internal analysis and assumptions and may not accurately measure collateral which is ultimately acceptable to the FHLB.
Securities Repurchase Agreements
Athene engages in repurchase transactions whereby it sells fixed income securities to third parties, primarily major brokerage firms or commercial banks, with a concurrent agreement to repurchase such securities at a determined future date. Athene requires that, at all times during the term of the repurchase agreements, it maintains sufficient cash or other liquid assets to allow it to fund substantially all of the repurchase price. Proceeds received from the sale of securities pursuant to these arrangements are generally invested in short-term investments or maintained in cash, with the offsetting obligation to repurchase the security included within payables for collateral on derivatives and securities to repurchase on the condensed consolidated statements of financial condition. As per the terms of the repurchase agreements, Athene monitors the market value of the securities sold and may be required to deliver additional collateral (which may be in the form of cash or additional securities) to the extent that the value of the securities sold decreases prior to the repurchase date.
As of June 30, 2025 and December 31, 2024, the payables for repurchase agreements were $3.5 billion and $5.7 billion, respectively, while the fair value of securities and collateral held by counterparties backing the repurchase agreements was $3.7 billion and $5.9 billion, respectively. As of June 30, 2025, payables for repurchase agreements, based on original issuance, were
151
comprised of $790 million of short-term and $2.7 billion of long-term repurchase agreements. As of December 31, 2024, payables for repurchase agreements, based on original issuance, were comprised of $3.0 billion of short-term and $2.7 billion of long-term repurchase agreements.
Dividends from Insurance Subsidiaries
AHL is a holding company whose primary liquidity needs include the cash-flow requirements relating to its corporate activities, including its day-to-day operations, debt servicing, preferred and common stock dividend payments and strategic transactions, such as acquisitions. The primary sources of AHL’s cash flow are dividends from its subsidiaries, capital market issuances and inter-company borrowings, which are expected to be adequate to fund cash flow requirements based on current estimates of future obligations.
The ability of AHL’s insurance subsidiaries to pay dividends is limited by applicable laws and regulations of the jurisdictions where the subsidiaries are domiciled, as well as agreements entered into with regulators. These laws and regulations require, among other things, the insurance subsidiaries to maintain minimum solvency requirements and limit the amount of dividends these subsidiaries can pay.
Subject to these limitations and prior notification to the appropriate regulatory agency, Athene’s U.S. insurance subsidiaries are permitted to pay ordinary dividends based on calculations specified under insurance laws of the relevant state of domicile. Any distributions above the amount permitted by statute in any twelve-month period are considered to be extraordinary dividends, and require the approval of the appropriate regulator prior to payment. AHL does not currently plan on having the U.S. subsidiaries pay any dividends to their parents.
Dividends from AHL’s subsidiaries are projected to be the primary source of AHL’s liquidity. Under the Bermuda Insurance Act, each of Athene’s Bermuda insurance subsidiaries is prohibited from paying a dividend in an amount exceeding 25% of the prior year’s statutory capital and surplus, unless at least two members of the board of directors of the Bermuda insurance subsidiary and its principal representative in Bermuda sign and submit to the BMA an affidavit attesting that a dividend in excess of this amount would not cause the Bermuda insurance subsidiary to fail to meet its relevant margins. In certain instances, the Bermuda insurance subsidiary would also be required to provide prior notice to the BMA in advance of the payment of dividends. In the event that such an affidavit is submitted to the BMA in accordance with the Bermuda Insurance Act, and further subject to the Bermuda insurance subsidiary meeting its relevant margins, the Bermuda insurance subsidiary is permitted to distribute up to the sum of 100% of statutory surplus and an amount less than 15% of its total statutory capital. Distributions in excess of this amount require the approval of the BMA.
The maximum distribution permitted by law or contract is not necessarily indicative of the insurance subsidiaries’ actual ability to pay such distributions, which may be further restricted by business and other considerations, such as the impact of such distributions on surplus, which could affect Athene’s ratings or competitive position and the amount of premiums that can be written. Specifically, the level of capital needed to maintain desired financial strength ratings from rating agencies, including S&P, AM Best, Fitch and Moody’s, is of particular concern when determining the amount of capital available for distributions. AHL believes its insurance subsidiaries have sufficient statutory capital and surplus, combined with additional capital available to be provided by AHL, to meet their financial strength ratings objectives. Finally, state insurance laws and regulations require that the statutory surplus of Athene’s insurance subsidiaries following any dividend or distribution must be reasonable in relation to their outstanding liabilities and adequate for the insurance subsidiaries’ financial needs.
Other Sources of Funding
Athene may seek to secure additional funding at the AHL level by means other than dividends from subsidiaries, such as by drawing on its undrawn $1.25 billion AHL credit facility, drawing on its undrawn $2.6 billion AHL liquidity facility or by pursuing future issuances of debt or preferred stock to third-party investors. The AHL credit facility contains various standard covenants with which Athene must comply, including maintaining a consolidated debt-to-capitalization ratio of not greater than 35%, maintaining a minimum consolidated net worth of no less than $14.8 billion and restrictions on the ability to incur liens, with certain exceptions. Rates, ratios and terms are as defined in the AHL credit facility. The AHL liquidity facility also contains various standard covenants with which Athene must comply, including maintaining an AARe minimum consolidated net worth of no less than $23.2 billion and restrictions on the ability to incur liens, with certain exceptions. Rates and terms are as defined in the AHL liquidity facility.
152
Future Debt Obligations
Athene had long-term debt of $7.9 billion as of June 30, 2025, which includes notes with maturities in 2028, 2030, 2031, 2033, 2034, 2051, 2052, 2054, 2055 and 2064. See note 11 to the condensed consolidated financial statements for further information regarding Athene’s debt arrangements.
Capital
Athene believes it has a strong capital position and is well positioned to meet policyholder and other obligations. Athene measures capital sufficiency using various internal capital metrics which reflect management’s view on the various risks inherent to its business, the amount of capital required to support its core operating strategies and the amount of capital necessary to maintain its current ratings in a recessionary environment. The amount of capital required to support Athene’s core operating strategies is determined based upon internal modeling and analysis of economic risk, as well as inputs from rating agency capital models and consideration of both NAIC RBC and Bermuda capital requirements. Capital in excess of this required amount is considered excess equity capital, which is available to deploy. As of December 31, 2024 and December 31, 2023, Athene’s U.S. RBC ratio was 419% and 392%, respectively, its Bermuda RBC ratio was 450% and 400%, respectively, and its consolidated RBC ratio was 430% and 412%, respectively. The formulas for determining the amount of RBC specify various weighting factors that are applied to financial balances or various levels of activity based on the perceived degree of risk. The RBC of Athene’s Bermuda insurance companies presented herein excludes the impact of any deferred taxes that may be recorded on a statutory basis as a result of the Bermuda CIT. Athene is currently assessing deferred taxes that may be recorded on a statutory basis as a result of the Bermuda CIT, which could have a positive impact on the statutory capital and surplus of its Bermuda insurance companies.
ACRA
ACRA 1 provided Athene with access to on-demand capital to support its growth strategies and capital deployment opportunities. ACRA 1 provided a capital source to fund both Athene’s inorganic and organic channels. ALRe directly owns 37% of the economic interests in ACRA 1 and all of ACRA 1’s voting interests, with ADIP I owning the remaining 63% of the economic interests. The commitment period for ACRA 1 expired in August 2023.
Similar to ACRA 1, ACRA 2 was funded in December 2022 as another long-duration, on-demand capital vehicle. ALRe directly owns 37% of the economic interests in ACRA 2 and all of ACRA 2’s voting interests, with ADIP II owning the remaining 63% of the economic interests. ACRA 2 participates in certain transactions by drawing a portion of the required capital for such transactions from third-party investors equal to ADIP II’s proportionate economic interests in ACRA 2.
These strategic capital solutions allow Athene the flexibility to simultaneously deploy capital across multiple accretive avenues, while maintaining a strong financial position.
Critical Accounting Estimates and Policies
This Management’s Discussion and Analysis of Financial Condition and Results of Operations is based upon the condensed consolidated financial statements, which have been prepared in accordance with U.S. GAAP. The preparation of financial statements in accordance with U.S. GAAP requires the use of estimates and assumptions that could affect the reported amounts of assets and liabilities, the disclosure of contingent assets and liabilities and the reported amounts of revenues and expenses and should be read in conjunction with our significant accounting policies described in note 2 of our consolidated financial statements in our 2024 Annual Report. Actual results could differ from these estimates.
The following is a summary of our accounting policies that are affected most by judgments, estimates and assumptions.
•Consolidation of VIEs
•Revenue Recognition
◦Performance Fees within Investment Income
◦Management Fees
•Investments, at fair value
•Fair value of financial instruments
•Equity-based compensation
•Profit sharing expense
153
•Income taxes
•Valuation of Fixed Maturity Securities, Equity Securities and Mortgage Loans
•Impairment of investments and allowances for expected credit losses
•Derivatives valuation, including embedded derivatives
•Future policy benefits
•Market risk benefits
The above critical accounting estimates and judgments are discussed in detail in “Item 7. Management’s Discussion and Analysis of Financial Condition and Results of Operations—Critical Accounting Estimates and Policies” of our 2024 Annual Report.
Recent Accounting Pronouncements
A list of recent accounting pronouncements that are relevant to Apollo and its industries is included in note 2 to our condensed consolidated financial statements.
Contractual Obligations, Commitments and Contingencies
Fixed and determinable payments due in connection with the Company’s material contractual obligations are as follows as of June 30, 2025:
| (In millions) | 2025 |
2026 - 2027
|
2028 - 2029
|
2030 and Thereafter | Total | ||||||||||||||||||||||||
| Asset Management | |||||||||||||||||||||||||||||
Operating lease obligations1
|
$ | 41 | $ | 170 | $ | 170 | $ | 561 | $ | 942 | |||||||||||||||||||
Other long-term obligations2
|
26 | 6 | — | — | 32 | ||||||||||||||||||||||||
AGM credit facility3
|
1 | 2 | 2 | — | 5 | ||||||||||||||||||||||||
Debt obligations3
|
117 | 934 | 1,071 | 6,446 | 8,568 | ||||||||||||||||||||||||
| 185 | 1,112 | 1,243 | 7,007 | 9,547 | |||||||||||||||||||||||||
| Retirement Services | |||||||||||||||||||||||||||||
| Interest sensitive contract liabilities | 16,500 | 65,310 | 86,632 | 123,796 | 292,238 | ||||||||||||||||||||||||
| Future policy benefits | 1,569 | 5,938 | 5,397 | 36,496 | 49,400 | ||||||||||||||||||||||||
| Market risk benefits | — | — | — | 6,651 | 6,651 | ||||||||||||||||||||||||
| Other policy claims and benefits | 108 | — | — | — | 108 | ||||||||||||||||||||||||
| Dividends payable to policyholders | 4 | 16 | 13 | 56 | 89 | ||||||||||||||||||||||||
Debt obligations3
|
220 | 879 | 1,818 | 14,575 | 17,492 | ||||||||||||||||||||||||
Securities to repurchase4
|
872 | 1,822 | 492 | 797 | 3,983 | ||||||||||||||||||||||||
| 19,273 | 73,965 | 94,352 | 182,371 | 369,961 | |||||||||||||||||||||||||
| Obligations | $ | 19,458 | $ | 75,077 | $ | 95,595 | $ | 189,378 | $ | 379,508 | |||||||||||||||||||
1 Operating lease obligations excludes $148 million of other operating expenses associated with operating leases.
| |||||||||||||||||||||||||||||
2 Includes (i) payments on management service agreements related to certain assets and (ii) payments with respect to certain consulting agreements entered into by the Company. Note that a significant portion of these costs are reimbursable by funds.
| |||||||||||||||||||||||||||||
3 The obligations for debt payments include contractual maturities of principal and estimated future interest payments based on the terms of the debt agreements. See note 11 of the condensed consolidated financial statements for further discussion of these debt obligations.
| |||||||||||||||||||||||||||||
4 The obligations for securities to repurchase payments include contractual maturities of principal and estimated future interest payments based on the terms of the agreements. Future interest payments on floating rate repurchase agreements were calculated using the June 30, 2025 interest rate.
| |||||||||||||||||||||||||||||
Note: Due to the fact that the timing of certain amounts to be paid cannot be determined or for other reasons discussed below, the following contractual commitments have not been presented in the table above.
(i)As noted previously, the tax receivable agreement requires us to pay to our Former Managing Partners and Contributing Partners 85% of any tax savings received by AGM and its subsidiaries from our step-up in tax basis. The tax savings achieved may not ensure that we have sufficient cash available to pay this liability and we might be required to incur additional debt to satisfy this liability.
(ii)Debt amounts related to the consolidated VIEs are not presented in the table above as the Company is not a guarantor of these non-recourse liabilities.
(iii)In connection with the Stone Tower acquisition, Apollo agreed to pay the former owners of Stone Tower a specified percentage of any future performance fees earned from certain of the Stone Tower funds, CLOs and strategic investment accounts. These contingent consideration liabilities are remeasured to fair value at each reporting period until the obligations are satisfied. See note 16 to the condensed consolidated financial statements for further information regarding the contingent consideration liabilities.
(iv)Commitments from certain of our subsidiaries to contribute to the funds we manage and certain related parties.
154
Atlas
In connection with the Company and CS’s previously announced transaction, certain subsidiaries of Atlas acquired certain assets of the CS Securitized Products Group (the “Transaction”). Under the terms of the Transaction, Atlas originally agreed to pay CS an amount of $3.3 billion by February 8, 2028. This deferred purchase price is an obligation first of Atlas, second of AAA, third of AAM, fourth of AHL and fifth of AARe. Each of AARe and AAM issued an assurance letter to CS for the full deferred purchase obligation amount of $3.3 billion. In March 2024, in connection with Atlas concluding its investment management agreement with CS, Atlas will no longer receive $0.8 billion of fees and the deferred purchase price obligation is reduced by a corresponding amount from $3.3 billion to $2.5 billion. In addition, certain strategic investors have made equity commitments to Atlas which therefore obligates these investors for a portion of the deferred purchase price obligation.
In exchange for the purchase price, Atlas originally received approximately $0.4 billion in cash and a portfolio of senior secured warehouse assets, subject to debt, with approximately $1 billion of tangible equity value. These warehouse assets are senior secured assets at industry standard loan-to-value ratios, structured to investment grade-equivalent criteria, and were approved by Atlas in connection with this Transaction. Atlas also benefits generally from the net spread earned on these assets in excess of its cost of financing. Finally, Atlas will earn total fees of $0.4 billion under the terms of the investment management agreement with CS, including management fees and transition and termination payments. As a result, the guarantee related to the Company’s aforementioned assurance letter is not probable of payment and, therefore, a liability has not been reflected on the condensed consolidated financial statements.
Supplemental Guarantor Financial Information
The 2033 Senior Notes and the 2054 Senior Notes issued by AGM are each guaranteed on a senior, unsecured basis, and the 2053 Subordinated Notes and the 2054 Subordinated Notes issued by AGM are guaranteed on a junior, unsecured basis, by AAM, together with certain Apollo intermediary holding companies (collectively, the “Guarantors”). The Guarantors fully and unconditionally guarantee payments of principal, premium, if any, and interest (i) on the 2033 Senior Notes and the 2054 Senior Notes on a senior, unsecured basis and (ii) on the 2053 Subordinated Notes and the 2054 Subordinated Notes on a subordinated, unsecured basis. See note 11 of the condensed consolidated financial statements for further discussion on these debt obligations.
AGM, as issuer, and the Guarantors are holding companies. The primary sources of cash flow are dependent upon distributions from their respective subsidiaries to meet their future obligations under the notes and the guarantees, respectively. The 2033 Senior Notes, the 2054 Senior Notes, the 2053 Subordinated Notes and the 2054 Subordinated Notes are not guaranteed by any fee generating businesses, Apollo-managed funds, or Athene and its direct and indirect subsidiaries. Holders of the guaranteed registered debt securities will have a direct claim only against AGM as issuer.
The following tables present summarized financial information of AGM, as the issuer of the debt securities, and the Guarantors on a combined basis after elimination of intercompany transactions and balances within the Guarantors and equity in the earnings from and investments in any non-guarantor subsidiary. As used herein, “obligor group” means AGM, as the issuer of the debt securities, and the Guarantors on a combined basis. The summarized financial information is provided in accordance with the reporting requirements of Rule 13-01 under SEC Regulation S-X for the obligor group and is not intended to present the financial position or results of operations of the obligor group in accordance with generally accepted accounting principles as such principles are in effect in the United States.
| (In millions) | June 30, 2025 | December 31, 2024 | |||||||||
Summarized Statements of Financial Condition |
|||||||||||
| Current assets, less receivables from non-guarantor subsidiaries | $ | 2,143 | $ | 2,545 | |||||||
| Non-current assets | 8,832 | 8,897 | |||||||||
| Due from related parties, excluding non-guarantor subsidiaries | 787 | 598 | |||||||||
| Current liabilities, less payables to non-guarantor subsidiaries | 894 | 521 | |||||||||
| Non-current liabilities | 7,385 | 7,122 | |||||||||
| Due to related parties, excluding non-guarantor subsidiaries | 355 | 305 | |||||||||
| Non-controlling interests | 15 | 11 | |||||||||
155
| Six Months Ended June 30, | |||||
| (In millions) | 2025 | ||||
Summarized Statements of Operations |
|||||
| Revenues | $ | 1,939 | |||
| Net income (loss) | (293) | ||||
| Net income (loss) attributable to obligor group | (346) | ||||
The following are transactions of the obligor group with non-guarantor subsidiaries.
| (In millions) | June 30, 2025 | December 31, 2024 | |||||||||
| Due from non-guarantor subsidiaries | $ | 724 | $ | 160 | |||||||
| Due to non-guarantor subsidiaries | 1,182 | 1,193 | |||||||||
| Six Months Ended June 30, | |||||||||||
| (In millions) | 2025 | ||||||||||
| Intercompany revenue | 719 | ||||||||||
| Intercompany expense | 268 | ||||||||||
ITEM 3. QUANTITATIVE AND QUALITATIVE DISCLOSURES ABOUT MARKET RISK
Market risk is the risk of incurring losses due to adverse changes in market rates and prices. Included in market risk are potential losses in value due to credit and counterparty risk, interest rate risk, currency risk, commodity price risk, equity price risk and inflation risk.
In our asset management business, our predominant exposure to market risk is related to our role as investment manager and general partner for the funds we manage and the sensitivity to movements in the fair value of their investments and resulting impact on performance fees and management fee revenues. Our direct investments in the funds we manage also expose us to market risk whereby movements in the fair values of the underlying investments will increase or decrease both net gains (losses) from investment activities and income (loss) from equity method investments.
Our retirement services business is exposed to market risk through its investment portfolio, its counterparty exposures and its hedging and reinsurance activities. Athene’s primary market risk exposures are to credit risk, interest rate risk, equity price risk and inflation risk.
For a discussion of our market risk exposures in general, please see “Part II—Item 7A. Quantitative and Qualitative Disclosures About Market Risk” in the 2024 Annual Report, which is accessible on the SEC’s website at www.sec.gov.
There have been no material changes to our market risk exposures from those previously disclosed in the 2024 Annual Report.
ITEM 4. CONTROLS AND PROCEDURES
We maintain “disclosure controls and procedures”, as such term is defined in Rules 13a-15(e) and 15d-15(e) under the Exchange Act, that are designed to ensure that information required to be disclosed by us in reports that we file or submit under the Exchange Act is recorded, processed, summarized and reported within the time periods specified in SEC rules and forms, and that such information is accumulated and communicated to our management, including our Chief Executive Officer and Chief Financial Officer, as appropriate, to allow timely decisions regarding required disclosure. In designing disclosure controls and procedures, our management necessarily was required to apply its judgment in evaluating the cost-benefit relationship of possible disclosure controls and procedures. The design of any disclosure controls and procedures also is based in part upon certain assumptions about the likelihood of future events, and there can be no assurance that any design will succeed in achieving its stated goals under all potential future conditions. Any controls and procedures, no matter how well designed and operated, can provide only reasonable assurance of achieving the desired objectives.
Our management, including our Chief Executive Officer and Chief Financial Officer, evaluated the effectiveness of our disclosure controls and procedures pursuant to Rule 13a-15 under the Exchange Act as of the end of the period covered by this
156
report. Based on that evaluation, our Chief Executive Officer and Chief Financial Officer have concluded that, as of the end of the period covered by this report, our disclosure controls and procedures (as defined in Rule 13a-15(e) under the Exchange Act) are effective at the reasonable assurance level to accomplish their objectives of ensuring that information we are required to disclose in reports that we file or submit under the Exchange Act is recorded, processed, summarized and reported within the time periods specified in SEC rules and forms, and that such information is accumulated and communicated to our management, including our Chief Executive Officer and Chief Financial Officer as appropriate, to allow timely decisions regarding required disclosure.
No changes in our internal control over financial reporting (as such term is defined in Rules 13a–15(f) and 15d–15(f) under the Exchange Act) occurred during our most recent quarter, that have materially affected, or are reasonably likely to materially affect, our internal control over financial reporting.
157
PART II - OTHER INFORMATION
ITEM 1. LEGAL PROCEEDINGS
See a summary of the Company’s legal proceedings set forth in note 16 to our condensed consolidated financial statements, which is incorporated by reference herein.
ITEM 1A. RISK FACTORS
For a discussion of our potential risks and uncertainties, see the information under the heading "Item 1A. Risk Factors" in the 2024 Annual Report, which is accessible on the SEC's website at www.sec.gov. There have been no material changes to the risk factors disclosed in the 2024 Annual Report.
The risks described in the 2024 Annual Report are not the only risks facing us. Additional risks and uncertainties not currently known to us or that we currently deem to be immaterial also may materially adversely affect our business, financial condition and/or operating results.
ITEM 2. UNREGISTERED SALES OF EQUITY SECURITIES AND USE OF PROCEEDS
Unregistered Sales of Equity Securities
On May 14, 2025, the Company issued 15,974 restricted shares under the 2019 Omnibus Equity Incentive Plan for Estate Planning Vehicles and 2,400 restricted shares under the 2019 Omnibus Equity Incentive Plan to certain holders of vested performance fee rights. The shares were issued in private placements in reliance on Regulation D or Section 4(a)(2) of the Securities Act.
158
Purchases of Equity Securities by the Issuer and Affiliated Purchasers
The following table sets forth information regarding repurchases of shares of common stock during the fiscal quarter ended June 30, 2025.
| Period | Total number of shares of common stock purchased | Average price paid per share |
Total number of shares of common stock purchased as part of publicly announced plans or programs1
|
Approximate dollar value of common stock that may yet be purchased under the plans or programs | ||||||||||||||||||||||
| April 1, 2025 through April 30, 2025 | ||||||||||||||||||||||||||
| Opportunistic repurchases | — | — | ||||||||||||||||||||||||
Equity award-related repurchases2
|
160 | 160 | ||||||||||||||||||||||||
| Total | 160 | $ | 149.27 | 160 | $ | 1,050,330,659 | ||||||||||||||||||||
| May 1, 2025 through May 31, 2025 | ||||||||||||||||||||||||||
| Opportunistic repurchases | — | — | ||||||||||||||||||||||||
Equity award-related repurchases2
|
112,051 | 112,051 | ||||||||||||||||||||||||
| Total | 112,051 | $ | 139.72 | 112,051 | $ | 1,034,674,472 | ||||||||||||||||||||
| June 1, 2025 through June 30, 2025 | ||||||||||||||||||||||||||
| Opportunistic repurchases | — | — | ||||||||||||||||||||||||
Equity award-related repurchases2
|
— | — | ||||||||||||||||||||||||
| Total | — | $ | — | — | $ | 1,034,674,472 | ||||||||||||||||||||
| Total | ||||||||||||||||||||||||||
| Opportunistic repurchases | — | — | ||||||||||||||||||||||||
Equity award-related repurchases2
|
112,211 | 112,211 | ||||||||||||||||||||||||
| Total | 112,211 | 112,211 | ||||||||||||||||||||||||
1 On February 8, 2024, the AGM board of directors terminated the Company’s prior share repurchase program and approved a new share repurchase program, pursuant to which, the Company is authorized to repurchase up to $3.0 billion of shares of its common stock to opportunistically reduce the Company’s share count or offset the dilutive impact of share issuances under the Company’s equity incentive plans. Under the share repurchase program, repurchases may be of outstanding shares of common stock occurring from time to time in open market transactions, in privately negotiated transactions, pursuant to a trading plan adopted in accordance with Rule 10b5-1 of the Exchange Act, or otherwise, as well as through reductions of shares that otherwise would have been issued to participants under the Company’s Equity Plan in order to satisfy associated tax obligations. The share repurchase program does not obligate the Company to make any repurchases at any specific time. The program is effective until the aggregate repurchase amount that has been approved by the AGM board of directors has been expended. The program may be suspended, extended, modified or discontinued at any time.
| ||||||||||||||||||||||||||
2 Represents repurchases of shares of common stock in order to offset the dilutive impact of share issuances under the Equity Plan including reductions of shares of common stock that otherwise would have been issued to participants under the Company’s Equity Plan in order to satisfy associated tax obligations.
| ||||||||||||||||||||||||||
ITEM 3. DEFAULTS UPON SENIOR SECURITIES
Not applicable.
ITEM 4. MINE SAFETY DISCLOSURES
Not applicable.
ITEM 5. OTHER INFORMATION
During the three months ended June 30, 2025, no director or officer (as defined in Rule 16a-1(f) under the Exchange Act) of AGM adopted terminated
159
ITEM 6. EXHIBITS
| Exhibit Number |
Exhibit Description | |||||||
| 2.1 | ||||||||
| 3.1 | ||||||||
| 3.2 | ||||||||
| 3.3 | ||||||||
| 3.4 | ||||||||
| 4.1 | ||||||||
| 4.2 | ||||||||
| 4.3 | ||||||||
| 4.4 | ||||||||
| 4.5 | ||||||||
| 4.6 | ||||||||
| 4.7 | ||||||||
| 4.8 | ||||||||
160
| 4.9 | ||||||||
| 4.10 | Certain instruments defining the rights of holders of long-term debt securities of the Registrant and its subsidiaries are omitted pursuant to Item 601(b)(4)(iii) of Regulation S-K. The Registrant hereby undertakes to furnish to the Securities and Exchange Commission, upon request, copies of any such instruments. | |||||||
| *10.1 | ||||||||
| *31.1 | ||||||||
| *31.2 | ||||||||
| *32.1 | ||||||||
| *32.2 | ||||||||
| 101 | Interactive data files pursuant to Rule 405 of Regulation S-T, formatted in Inline XBRL (eXtensible Business Reporting Language): (i) the Condensed Consolidated Statements of Financial Condition as of June 30, 2025 and December 31, 2024, (ii) the Condensed Consolidated Statements of Operations for the three and six months ended June 30, 2025 and June 30, 2024, (iii) the Condensed Consolidated Statements of Comprehensive Income (Loss) for the three and six months ended June 30, 2025 and June 30, 2024, (iv) the Condensed Consolidated Statements of Equity for the three and six months ended June 30, 2025 and June 30, 2024, (v) the Condensed Consolidated Statements of Cash Flows for the six months ended June 30, 2025 and June 30, 2024, and (vi) the Notes to the Condensed Consolidated Financial Statements. |
|||||||
| 104 | Cover Page Interactive Data File (formatted in Inline XBRL in Exhibit 101). | |||||||
| * | Filed herewith. | ||||
The agreements and other documents filed as exhibits to this report are not intended to provide factual information or other disclosure other than with respect to the terms of the agreements or other documents themselves, and you should not rely on them for that purpose. In particular, any representations and warranties made by us in these agreements or other documents were made solely within the specific context of the relevant agreement or document and may not describe the actual state of affairs as of the date they were made or at any other time.
161
SIGNATURES
Pursuant to the requirements of the Securities Exchange Act of 1934, the registrant has duly caused this report to be signed on its behalf by the undersigned, thereunto duly authorized.
| Apollo Global Management, Inc. | |||||||||||
| (Registrant) | |||||||||||
| Date: August 7, 2025 | By: | /s/ Martin Kelly | |||||||||
| Name: | Martin Kelly | ||||||||||
| Title: | Chief Financial Officer (principal financial officer and authorized signatory) |
||||||||||
162