10-K: Annual report pursuant to Section 13 and 15(d)
Published on March 1, 2023
UNITED STATES
SECURITIES AND EXCHANGE COMMISSION
WASHINGTON, D.C. 20549
Form 10-K
(Mark One)
ANNUAL REPORT PURSUANT TO SECTION 13 OR 15(d) OF THE SECURITIES EXCHANGE ACT OF 1934 |
|||||
FOR THE FISCAL YEAR ENDED DECEMBER 31 , 2022
| TRANSITION REPORT PURSUANT TO SECTION 13 OR 15(d) OF THE SECURITIES EXCHANGE ACT OF 1934 | |||||
FOR THE TRANSITION PERIOD FROM TO
Commission File Number: 001-41197
(Exact name of Registrant as specified in its charter)
| (State or other jurisdiction of incorporation or organization) | (I.R.S. Employer Identification No.) | |||||||
(Address of principal executive offices) (Zip Code)
(212 ) 515-3200
(Registrant’s telephone number, including area code)
Securities registered pursuant to Section 12(b) of the Act:
| Title of each class | Trading Symbol(s) | Name of each exchange on which registered | ||||||||||||
Securities registered pursuant to Section 12(g) of the Act: None
Indicate by check mark if the Registrant is a well-known seasoned issuer, as defined in Rule 405 of the Securities Act.
Indicate by check mark if the Registrant is not required to file reports pursuant to Section 13 or Section 15(d) of the Act.
Yes ¨ No x
Indicate by check mark whether the Registrant (1) has filed all reports required to be filed by Section 13 or 15(d) of the Securities Exchange Act of 1934 during the preceding 12 months (or for such shorter period that the Registrant was required to file such reports), and (2) has been subject to such filing requirements for the past 90 days. Yes x No ☐
Indicate by check mark whether the registrant has submitted electronically every Interactive Data File required to be submitted pursuant to Rule 405 of Regulation S-T (§232.405 of this chapter) during the preceding 12 months (or for such shorter period that the registrant was required to submit such files). Yes x No ☐
Indicate by check mark whether the Registrant is a large accelerated filer, an accelerated filer, a non-accelerated filer, a smaller reporting company or an emerging growth company. See the definitions of “large accelerated filer”, “accelerated filer”, “smaller reporting company” and “emerging growth company” in Rule 12b-2 of the Exchange Act.
| Accelerated filer ☐ | Non-accelerated filer ☐ | Smaller reporting company | Emerging growth company | ||||||||||||||||||||||||||||||||||||||
Indicate by check mark whether the Registrant has filed a report on and attestation to its management’s assessment of the effectiveness of its internal control over financial reporting under Section 404(b) of the Sarbanes-Oxley Act (15 U.S.C.7262(b)) by the registered public accounting firm that prepared or issued its audit report. x
If securities are registered pursuant to Section 12(b) of the Act, indicate by check mark whether the financial statements of the registrant included in the filing reflect the correction of an error to previously issued financial statements. ☐
Indicate by check mark whether any of those error corrections are restatements that required a recovery analysis of incentive-based compensation received by any of the registrant’s executive officers during the relevant recovery period pursuant to §240.10D-1(b). ☐
Indicate by check mark whether the Registrant is a shell company (as defined in Rule 12b-2 of the Exchange Act). Yes ☐ No x
The aggregate market value of the common stock of the Registrant held by non-affiliates as of June 30, 2022 was approximately $20,894,310,263 .
As of February 24, 2023, there were 570,652,389 shares of the Registrant’s common stock outstanding.
1
| TABLE OF CONTENTS | ||||||||
| Page | ||||||||
| PART I | ||||||||
| Item 1. | ||||||||
| Item 1A. | ||||||||
| Item 1B. | ||||||||
| Item 2. | ||||||||
| Item 3. | ||||||||
| Item 4. | ||||||||
| PART II | ||||||||
| Item 5. | ||||||||
| Item 6. | ||||||||
| Item 7. | ||||||||
| Item 7A. | ||||||||
| Item 8. | ||||||||
| Item 8A. | ||||||||
| Item 9. | ||||||||
| Item 9A. | ||||||||
| Item 9B. | ||||||||
| Item 9C. | ||||||||
| PART III | ||||||||
| Item 10. | ||||||||
| Item 11. | ||||||||
| Item 12. | ||||||||
| Item 13. | ||||||||
| Item 14. | ||||||||
| PART IV | ||||||||
| Item 15. | ||||||||
| Item 16. | ||||||||
2
Forward-Looking Statements
This report may contain forward-looking statements that are within the meaning of Section 27A of the Securities Act of 1933, as amended (the “Securities Act”), and Section 21E of the Securities Exchange Act of 1934, as amended (the “Exchange Act”). These statements include, but are not limited to, discussions related to Apollo’s expectations regarding the performance of its business, its liquidity and capital resources and the other non-historical statements in the discussion and analysis. These forward-looking statements are based on management’s beliefs, as well as assumptions made by, and information currently available to, management. When used in this report, the words “believe,” “anticipate,” “estimate,” “expect,” “intend,” “target” or future or conditional verbs, such as “will,” “should,” “could,” or “may,” and variations of such words or similar expressions are intended to identify forward-looking statements. Although management believes that the expectations reflected in these forward-looking statements are reasonable, it can give no assurance that these expectations will prove to have been correct. These statements are subject to certain risks, uncertainties and assumptions, including risks relating to inflation, market conditions and interest rate fluctuations generally, the impact of COVID-19, the impact of energy market dislocation, our ability to manage our growth, our ability to operate in highly competitive environments, the performance of the funds we manage, our ability to raise new funds, the variability of our revenues, earnings and cash flow, the accuracy of management’s assumptions and estimates, our dependence on certain key personnel, our use of leverage to finance our businesses and investments by the funds we manage, Athene’s ability to maintain or improve financial strength ratings, the impact of Athene’s reinsurers failing to meet their assumed obligations, Athene’s ability to manage its business in a highly regulated industry, changes in our regulatory environment and tax status, and litigation risks, among others. We believe these factors include but are not limited to those described under the section entitled “Risk Factors” in this Annual Report on Form 10-K, as such factors may be updated from time to time in our periodic filings with the SEC, which are accessible on the SEC’s website at www.sec.gov. These factors should not be construed as exhaustive and should be read in conjunction with the other cautionary statements that are included in this report and in our other filings with the SEC. We undertake no obligation to publicly update or review any forward-looking statements, whether as a result of new information, future developments or otherwise, except as required by applicable law.
Risk Factors Summary
The following is only a summary of the principal risks that could materially and adversely affect our business, financial condition, results of operations and cash flows, which should be read in conjunction with the detailed description of these risks in “Item 1A. Risk Factors.” Some of the factors that could materially and adversely affect our business, financial condition, results of operations and cash flows include, but are not limited to, the following:
•Difficult political, market or economic conditions;
•The effects of the COVID-19 pandemic;
•Climate change and regulatory and other efforts to reduce climate change;
•The variability in our revenues, earnings and cash flow;
•Our ability to expand into new investment strategies, markets and businesses;
•Our operations in highly competitive industries;
•Our dependence on certain key personnel;
•Harm caused by misconduct by our current and former employees, directors, or others affiliated with us;
•Our reliance on technology and information systems;
•Our dependence on management’s assumptions and estimates;
•Investments by us and the funds we manage in illiquid assets;
•Reliance by us and the funds we manage on the debt financing markets;
•Changes to and replacement of the London Interbank Offered Rate (“LIBOR”);
•Our reliance on our asset management business;
•Our dependence on our retirement services business;
•Our ability to deal appropriately with conflicts of interest;
•Our ability to comply with the extensive regulation of our businesses;
•Increased regulatory focus on our businesses or legislative or regulatory changes;
•Our exposure to third-party litigation;
•Our structure involving complex provisions of tax law; and
•Our ability to react to changes in U.S. and foreign tax law.
3
Terms Used in This Report
In this report, references to “Apollo,” “we,” “us,” “our,” and the “Company” for periods (i) on or before December 31, 2021 refer to Apollo Asset Management, Inc. (f/k/a Apollo Global Management, Inc.) (“AAM”) and its subsidiaries unless the context requires otherwise and (ii) subsequent to December 31, 2021, refer to Apollo Global Management, Inc. (f/k/a Tango Holdings, Inc.) (“AGM”) and its subsidiaries unless the context requires otherwise. Moreover, references to “Class A shares” refers to the Class A common stock, $0.00001 par value per share, of AAM prior to the Mergers; “Class B share” refers to the Class B common stock, $0.00001 par value per share, of AAM prior to the Mergers (as defined below); “Class C share” refers to the Class C common stock, $0.00001 par value per share, of AAM prior to the Mergers; “Series A Preferred shares” refers to the 6.375% Series A preferred stock of AAM both prior to and following the Mergers; “Series B Preferred shares” refers to the 6.375% Series B preferred stock of AAM both prior to and following the Mergers; and “Preferred shares” refers to the Series A Preferred shares and the Series B Preferred shares, collectively, both prior to and following the Mergers. In addition, for periods on or before December 31, 2021, references to “AGM common stock” or “common stock” of the Company refer to Class A shares unless the context otherwise requires, and for periods subsequent to December 31, 2021 refer to shares of common stock, par value $0.00001 per share, of AGM.
The use of any defined term in this report to mean more than one entity, person, security or other item collectively is solely for convenience of reference and in no way implies that such entities, persons, securities or other items are one indistinguishable group. For example, notwithstanding the use of the defined terms “Apollo,” “we,” “us,” “our,” and the “Company” in this report to refer to AGM and its subsidiaries, each subsidiary of AGM is a standalone legal entity that is separate and distinct from AGM and any of its other subsidiaries. Any AGM entity (including any Athene entity) referenced herein is responsible for its own financial, contractual and legal obligations.
| Term or Acronym | Definition | ||||
| AAA | Apollo Aligned Alternatives, L.P., together with its parallel funds and alternative investment vehicles | ||||
| AADE | Athene Annuity & Life Assurance Company | ||||
| AAIA | Athene Annuity and Life Company | ||||
| AARe | Athene Annuity Re Ltd., a Bermuda reinsurance subsidiary | ||||
| ABS | Asset-backed securities | ||||
| Accord+ | Apollo Accord+ Fund, L.P., together with its parallel funds and alternative investment vehicles | ||||
| Accord I | Apollo Accord Master Fund, L.P., together with its feeder funds | ||||
| Accord II | Apollo Accord Master Fund II, L.P., together with its feeder funds | ||||
| Accord III | Apollo Accord Master Fund III, L.P., together with its feeder funds | ||||
| Accord III B | Apollo Accord Master Fund III B, L.P., together with its feeder funds | ||||
| Accord IV | Apollo Accord Fund IV, L.P., together with its parallel funds and alternative investment vehicles | ||||
| Accord V | Apollo Accord Fund V, L.P., together with its parallel funds and alternative investment vehicles | ||||
| ACRA | Athene Co-Invest Reinsurance Affiliate Holding Ltd., together with its subsidiaries | ||||
| ADIP | Apollo/Athene Dedicated Investment Program (A), L.P., together with its parallel funds, a series of funds managed by Apollo including third-party capital that invests alongside Athene in certain investments | ||||
| ADS | Apollo Debt Solutions BDC, a non-traded business development company managed by Apollo | ||||
| AFS | Available-for-sale | ||||
| AIOF I | Apollo Infra Equity US Fund, L.P., Apollo Infra Equity Feeder Fund (TE), L.P., Apollo Infra Equity International Fund, L.P., and Apollo Infra Equity Feeder Fund (Non-US), L.P. and their alternative investment vehicles | ||||
| AIOF II | Apollo Infrastructure Opportunities Fund II, L.P., together with its parallel funds and alternative investment vehicles | ||||
| ALRe | Athene Life Re Ltd., a Bermuda reinsurance subsidiary | ||||
| Alternative investments | Alternative investments, including investment funds, CLO and ABS equity positions and certain other debt instruments considered to be equity-like | ||||
| AmeriHome | AmeriHome Mortgage Company, LLC | ||||
| AMH | Apollo Management Holdings, L.P., a Delaware limited partnership, that is an indirect subsidiary of AGM | ||||
| ANRP I | Apollo Natural Resources Partners, L.P., together with its alternative investment vehicles | ||||
| ANRP II | Apollo Natural Resources Partners II, L.P., together with its alternative investment vehicles | ||||
| ANRP III | Apollo Natural Resources Partners III, L.P., together with its parallel funds and alternative investment vehicles | ||||
4
| AOCI | Accumulated other comprehensive income (loss) | ||||
| AOG Unit Payment | On December 31, 2021, holders of units of the Apollo Operating Group (“AOG Units”) (other than Athene and the Company) sold and transferred a portion of such AOG Units to APO Corp., a wholly-owned consolidated subsidiary of the Company, in exchange for an amount equal to $3.66 multiplied by the total number of AOG Units held by such holders immediately prior to such transaction. | ||||
| Apollo funds, our funds and references to the funds we manage | The funds (including the parallel funds and alternative investment vehicles of such funds), partnerships, accounts, including strategic investment accounts or “SIAs,” alternative asset companies and other entities for which subsidiaries of Apollo provide investment management or advisory services. | ||||
| Apollo Operating Group | (i) The entities through which we currently operate our asset management business and (ii) one or more entities formed for the purpose of, among other activities, holding certain of our gains or losses on our principal investments in the funds, which we refer to as our “principal investments.” | ||||
| Apollo Origination Partners | Apollo Origination Partnership, L.P., together with its parallel funds and alternative investment vehicles | ||||
| APSG I | Apollo Strategic Growth Capital | ||||
| APSG II | Apollo Strategic Growth Capital II | ||||
| ARI | Apollo Commercial Real Estate Finance, Inc. | ||||
| Assets Under Management, or AUM | The assets of the funds, partnerships and accounts to which Apollo provides investment management, advisory, or certain other investment-related services, including, without limitation, capital that such funds, partnerships and accounts have the right to call from investors pursuant to capital commitments. Our AUM equals the sum of: 1. the NAV, plus used or available leverage and/or capital commitments, or gross assets plus capital commitments, of the yield and certain hybrid funds, partnerships and accounts for which we provide investment management or advisory services, other than certain CLOs, CDOs, and certain perpetual capital vehicles, which have a fee-generating basis other than the mark-to-market value of the underlying assets; for certain perpetual capital vehicles in yield, gross asset value plus available financing capacity; 2. the fair value of the investments of the equity and certain hybrid funds, partnerships and accounts Apollo manages or advises, plus the capital that such funds, partnerships and accounts are entitled to call from investors pursuant to capital commitments, plus portfolio level financings; 3. the gross asset value associated with the reinsurance investments of the portfolio company assets Apollo manages or advises; and 4. the fair value of any other assets that Apollo manages or advises for the funds, partnerships and accounts to which Apollo provides investment management, advisory, or certain other investment-related services, plus unused credit facilities, including capital commitments to such funds, partnerships and accounts for investments that may require pre-qualification or other conditions before investment plus any other capital commitments to such funds, partnerships and accounts available for investment that are not otherwise included in the clauses above. Apollo’s AUM measure includes Assets Under Management for which Apollo charges either nominal or zero fees. Apollo’s AUM measure also includes assets for which Apollo does not have investment discretion, including certain assets for which Apollo earns only investment-related service fees, rather than management or advisory fees. Apollo’s definition of AUM is not based on any definition of Assets Under Management contained in its governing documents or in any management agreements of the funds Apollo manages. Apollo considers multiple factors for determining what should be included in its definition of AUM. Such factors include but are not limited to (1) Apollo’s ability to influence the investment decisions for existing and available assets; (2) Apollo’s ability to generate income from the underlying assets in the funds it manages; and (3) the AUM measures that Apollo uses internally or believe are used by other investment managers. Given the differences in the investment strategies and structures among other alternative investment managers, Apollo’s calculation of AUM may differ from the calculations employed by other investment managers and, as a result, this measure may not be directly comparable to similar measures presented by other investment managers. Apollo’s calculation also differs from the manner in which its affiliates registered with the SEC report “Regulatory Assets Under Management” on Form ADV and Form PF in various ways. Apollo uses AUM, Gross capital deployment and Dry powder as performance measurements of its investment activities, as well as to monitor fund size in relation to professional resource and infrastructure needs. |
||||
| Athene | Athene Holding Ltd. (“Athene Holding” or “AHL” together with its subsidiaries), a leading financial services company specializing in retirement services that issues, reinsures and acquires retirement savings products designed for the increasing number of individuals and institutions seeking to fund retirement needs, and to which Apollo, through its consolidated subsidiary ISG, provides asset management and advisory services. | ||||
| Athora | Athora Holding, Ltd. (“Athora Holding”, together with its subsidiaries), a strategic liabilities platform that acquires or reinsures blocks of insurance business in the German and broader European life insurance market (collectively, the “Athora Accounts”). Apollo, through ISGI, provides investment advisory services to Athora. Athora Non-Sub-Advised Assets includes the Athora assets which are managed by Apollo but not sub-advised by Apollo nor invested in Apollo funds or investment vehicles. Athora Sub-Advised includes assets which the Company explicitly sub-advises as well as those assets in the Athora Accounts which are invested directly in funds and investment vehicles Apollo manages. | ||||
| Atlas | An equity investment of AAA and refers to certain subsidiaries of Atlas Securitized Products Holdings LP | ||||
5
| AUM with Future Management Fee Potential | The committed uninvested capital portion of total AUM not currently earning management fees. The amount depends on the specific terms and conditions of each fund. | ||||
| AUSA | Athene USA Corporation | ||||
| Bermuda RBC | The risk-based capital ratio of Athene's non-US reinsurance subsidiaries by applying NAIC risk-based capital factors to the statutory financial statements on an aggregate basis. Adjustments are made to (1) exclude US subsidiaries which are included within Athene's US RBC Ratio, (2) exclude interests in other non-insurance subsidiary holding companies from its capital base and (3) limit RBC concentration charges such that when they are applied to determine target capital, the charges do not exceed 100% of the asset’s carrying value. | ||||
| BMA | Bermuda Monetary Authority | ||||
| BSCR | Bermuda Solvency Capital Requirement | ||||
| Capital solutions fees and other, net | Primarily includes transaction fees earned by our capital solutions business which we refer to as Apollo Capital Solutions ("ACS") related to underwriting, structuring, arrangement and placement of debt and equity securities, and syndication for funds managed by Apollo, portfolio companies of funds managed by Apollo, and third parties. Capital solutions fees and other, net also includes advisory fees for the ongoing monitoring of portfolio operations and director's fees. These fees also include certain offsetting amounts including reductions in management fees related to a percentage of these fees recognized ("management fee offset") and other additional revenue sharing arrangements. | ||||
| CDI | California Department of Insurance | ||||
| CDO | Collateralized debt obligation | ||||
| CLO | Collateralized loan obligation | ||||
| CMBS | Commercial mortgage-backed securities | ||||
| CML | Commercial mortgage loans | ||||
| Contributing Partners | Partners and their related parties (other than Messrs. Leon Black, Joshua Harris and Marc Rowan, our co-founders) who indirectly beneficially owned Apollo Operating Group units. | ||||
| Consolidated RBC | The consolidated risk-based capital ratio of Athene's non-US reinsurance and US insurance subsidiaries calculated by applying NAIC risk-based capital factors to the statutory financial statements on an aggregate basis, including interests in other non-insurance subsidiary holding companies; with an adjustment in Bermuda and non-insurance holding companies to limit RBC concentration charges such that when they are applied to determine target capital, the charges do not exceed 100% of the asset’s carrying value. | ||||
| Cost of funds | Cost of funds includes liability costs related to cost of crediting on both deferred annuities, including, with respect to our fixed indexed annuities, option costs, and institutional costs related to institutional products, as well as other liability costs, but does not include the proportionate share of the ACRA cost of funds associated with the noncontrolling interest. Other liability costs include DAC, DSI and VOBA amortization, change in rider reserves, the cost of liabilities on products other than deferred annuities and institutional products, as well as offsets for premiums, product charges and other revenues. Costs related to business that we have exited through ceded reinsurance transactions are excluded. Cost of funds is computed as the total liability costs divided by the average net invested assets for the relevant period, presented on an annualized basis for interim periods. | ||||
| CS | Credit Suisse AG | ||||
| DAC | Deferred acquisition costs | ||||
| Deferred annuities | Fixed indexed annuities, annual reset annuities, multi-year guaranteed annuities and registered index-linked annuities | ||||
| Dry Powder | The amount of capital available for investment or reinvestment subject to the provisions of the applicable limited partnership agreements or other governing agreements of the funds, partnerships and accounts we manage. Dry powder excludes uncalled commitments which can only be called for fund fees and expenses and commitments from perpetual capital vehicles. | ||||
| DSI | Deferred sales inducement | ||||
| ECR | Enhanced Capital Requirement | ||||
| EPF I | Apollo European Principal Finance Fund, L.P., together with its parallel funds and alternative investment vehicles | ||||
| EPF II | Apollo European Principal Finance Fund II (Dollar A), L.P., together with its parallel funds and alternative investment vehicles | ||||
| EPF III | Apollo European Principal Finance Fund III (Dollar A), L.P., together with its parallel funds and alternative investment vehicles | ||||
| EPF IV | Apollo European Principal Finance Fund IV (Dollar A), L.P., together with its parallel funds and alternative investment vehicles | ||||
| Equity Plan | Refers collectively to the Company’s 2019 Omnibus Equity Incentive Plan and the Company’s 2019 Omnibus Equity Incentive Plan for Estate Planning Vehicles. | ||||
| FABN | Funding agreement backed notes | ||||
| FABR | Funding agreement backed repurchase agreement | ||||
6
| Fee-Generating AUM | Fee-Generating AUM consists of assets of the funds, partnerships and accounts to which we provide investment management, advisory, or certain other investment-related services and on which we earn management fees, monitoring fees or other investment-related fees pursuant to management or other fee agreements on a basis that varies among the Apollo funds, partnerships and accounts. Management fees are normally based on “net asset value,” “gross assets,” “adjusted par asset value,” “adjusted cost of all unrealized portfolio investments,” “capital commitments,” “adjusted assets,” “stockholders’ equity,” “invested capital” or “capital contributions,” each as defined in the applicable management agreement. Monitoring fees, also referred to as advisory fees, with respect to the structured portfolio company investments of the funds, partnerships and accounts we manage or advise, are generally based on the total value of such structured portfolio company investments, which normally includes leverage, less any portion of such total value that is already considered in Fee-Generating AUM. | ||||
| Fee Related Earnings, or FRE | Component of Adjusted Segment Income that is used to assess the performance of the Asset Management segment. FRE is the sum of (i) management fees, (ii) advisory and transaction fees, (iii) fee-related performance fees from indefinite term vehicles, that are measured and received on a recurring basis and not dependent on realization events of the underlying investments and (iv) other income, net, less (a) fee-related compensation, excluding equity-based compensation, (b) non-compensation expenses incurred in the normal course of business, (c) placement fees and (d) non-controlling interests in the management companies of certain funds the Company manages. |
||||
| FIA | Fixed indexed annuity, which is an insurance contract that earns interest at a crediting rate based on a specified index on a tax-deferred basis | ||||
| Fixed annuities | FIAs together with fixed rate annuities | ||||
| Former Managing Partners | Messrs. Leon Black, Joshua Harris and Marc Rowan collectively and, when used in reference to holdings of interests in Apollo or AP Professional Holdings, L.P. includes certain related parties of such individuals | ||||
Gross capital deployment |
The gross capital that has been invested in investments by the funds and accounts we manage during the relevant period, but excludes certain investment activities primarily related to hedging and cash management functions at the firm. Gross capital deployment is not reduced or netted down by sales or refinancings, and takes into account leverage used by the funds and accounts we manage in gaining exposure to the various investments that they have made. |
||||
| GLWB | Guaranteed lifetime withdrawal benefit | ||||
| GMDB | Guaranteed minimum death benefit | ||||
| Gross IRR of accord series and the European principal finance funds | The annualized return of a fund based on the actual timing of all cumulative fund cash flows before management fees, performance fees allocated to the general partner and certain other expenses. Calculations may include certain investors that do not pay fees. The terminal value is the net asset value as of the reporting date. Non-U.S. dollar denominated (“USD”) fund cash flows and residual values are converted to USD using the spot rate as of the reporting date. In addition, gross IRRs at the fund level will differ from those at the individual investor level as a result of, among other factors, timing of investor-level inflows and outflows. Gross IRR does not represent the return to any fund investor. | ||||
| Gross IRR of a traditional private equity or hybrid value fund | The cumulative investment-related cash flows (i) for a given investment for the fund or funds which made such investment, and (ii) for a given fund, in the relevant fund itself (and not any one investor in the fund), in each case, on the basis of the actual timing of investment inflows and outflows (for unrealized investments assuming disposition on December 31, 2022 or other date specified) aggregated on a gross basis quarterly, and the return is annualized and compounded before management fees, performance fees and certain other expenses (including interest incurred by the fund itself) and measures the returns on the fund’s investments as a whole without regard to whether all of the returns would, if distributed, be payable to the fund’s investors. In addition, gross IRRs at the fund level will differ from those at the individual investor level as a result of, among other factors, timing of investor-level inflows and outflows. Gross IRR does not represent the return to any fund investor. | ||||
| Gross IRR of infrastructure funds | The cumulative investment-related cash flows in the fund itself (and not any one investor in the fund), on the basis of the actual timing of cash inflows and outflows (for unrealized investments assuming disposition on December 31, 2022 or other date specified) starting on the date that each investment closes, and the return is annualized and compounded before management fees, performance fees, and certain other expenses (including interest incurred by the fund itself) and measures the returns on the fund’s investments as a whole without regard to whether all of the returns would, if distributed, be payable to the fund’s investors. Non-USD fund cash flows and residual values are converted to USD using the spot rate as of the reporting date. In addition, gross IRRs at the fund level will differ from those at the individual investor level as a result of, among other factors, timing of investor-level inflows and outflows. Gross IRR does not represent the return to any fund investor. | ||||
| Gross Return or Gross ROE of a total return yield fund or the hybrid credit hedge fund | The monthly or quarterly time-weighted return that is equal to the percentage change in the value of a fund’s portfolio, adjusted for all contributions and withdrawals (cash flows) before the effects of management fees, incentive fees allocated to the general partner, or other fees and expenses. Returns for these categories are calculated for all funds and accounts in the respective strategies. Returns over multiple periods are calculated by geometrically linking each period’s return over time. Gross return and gross ROE do not represent the return to any fund investor. |
||||
| HoldCo | Apollo Global Management, Inc. (f/k/a Tango Holdings, Inc.) | ||||
| HVF I | Apollo Hybrid Value Fund, L.P., together with its parallel funds and alternative investment vehicles | ||||
| HVF II | Apollo Hybrid Value Fund II, L.P., together with its parallel funds and alternative investment vehicles | ||||
7
| Inflows | (i) At the individual strategy level, subscriptions, commitments, and other increases in available capital, such as acquisitions or leverage, net of inter-strategy transfers, and (ii) on an aggregate basis, the sum of inflows across the yield, hybrid and equity investing strategies. | ||||
| IPO | Initial Public Offering | ||||
| ISG | Apollo Insurance Solutions Group LP | ||||
| ISGI | Refers collectively to Apollo Asset Management Europe LLP, a subsidiary of Apollo ("AAME") and Apollo Asset Management PC LLP, a wholly-owned subsidiary of AAME ("AAME PC") | ||||
| Management Fee Offset | Under the terms of the limited partnership agreements for certain funds, the management fee payable by the funds may be subject to a reduction based on a certain percentage of such advisory and transaction fees, net of applicable broken deal costs. | ||||
| Merger Agreement | The Agreement and Plan of Merger dated as of March 8, 2021 by and among AAM, AGM, AHL, Blue Merger Sub, Ltd., a Bermuda exempted company, and Green Merger Sub, Inc., a Delaware corporation. | ||||
| Merger Date | January 1, 2022 | ||||
| MFIC | MidCap Financial Investment Corporation (f/k/a Apollo Investment Corporation or "AINV") | ||||
| MidCap | MidCap FinCo Designated Activity Company | ||||
| MMS | Minimum margin of solvency | ||||
| Modco | Modified coinsurance | ||||
| NAIC | National Association of Insurance Commissioners | ||||
| NAV | Net Asset Value | ||||
| Net invested assets | The sum of Athene’s (a) total investments on the consolidated statements of financial condition with available-for-sale securities at amortized cost, excluding derivatives, (b) cash and cash equivalents and restricted cash, (c) investments in related parties, (d) accrued investment income, (e) consolidated VIE and VOE assets, liabilities and noncontrolling interest, (f) net investment payables and receivables, (g) policy loans ceded (which offset the direct policy loans in total investments) and (h) an adjustment for the allowance for credit losses. Net invested assets includes investments supporting assumed funds withheld and modco agreements and excludes assets associated with funds withheld liabilities related to business exited through reinsurance agreements and derivative collateral (offsetting the related cash positions). Net invested assets includes our economic ownership of ACRA investments but does not include the investments associated with the noncontrolling interest. | ||||
| Net investment earned rate | Income from Athene’s net invested assets, excluding the proportionate share of the ACRA net investment income associated with the noncontrolling interest, divided by the average net invested assets for the relevant period, presented on an annualized basis for interim periods | ||||
| Net investment spread | Net investment spread measures Athene’s investment performance plus its strategic capital management fees less total cost of funds, presented on an annualized basis for interim periods | ||||
| Net IRR of accord series and the European principal finance funds | The annualized return of a fund after management fees, performance fees allocated to the general partner and certain other expenses, calculated on investors that pay such fees. The terminal value is the net asset value as of the reporting date. Non-USD fund cash flows and residual values are converted to USD using the spot rate as of the reporting date. In addition, net IRR at the fund level will differ from that at the individual investor level as a result of, among other factors, timing of investor-level inflows and outflows. Net IRR does not represent the return to any fund investor. | ||||
| Net IRR of a traditional private equity or the hybrid value funds | The gross IRR applicable to the fund, including returns for related parties which may not pay fees or performance fees, net of management fees, certain expenses (including interest incurred or earned by the fund itself) and realized performance fees all offset to the extent of interest income, and measures returns at the fund level on amounts that, if distributed, would be paid to investors of the fund. The timing of cash flows applicable to investments, management fees and certain expenses, may be adjusted for the usage of a fund’s subscription facility. To the extent that a fund exceeds all requirements detailed within the applicable fund agreement, the estimated unrealized value is adjusted such that a percentage of up to 20.0% of the unrealized gain is allocated to the general partner of such fund, thereby reducing the balance attributable to fund investors. In addition, net IRR at the fund level will differ from that at the individual investor level as a result of, among other factors, timing of investor-level inflows and outflows. Net IRR does not represent the return to any fund investor. | ||||
| Net IRR of infrastructure funds | The cumulative cash flows in the fund (and not any one investor in the fund), on the basis of the actual timing of cash inflows received from and outflows paid to investors of the fund (assuming the ending net asset value as of the reporting date or other date specified is paid to investors), excluding certain non-fee and non-performance fee bearing parties, and the return is annualized and compounded after management fees, performance fees, and certain other expenses (including interest incurred by the fund itself) and measures the returns to investors of the fund as a whole. Non-USD fund cash flows and residual values are converted to USD using the spot rate as of the reporting date. In addition, net IRR at the fund level will differ from that at the individual investor level as a result of, among other factors, timing of investor-level inflows and outflows. Net IRR does not represent the return to any fund investor. | ||||
8
| Net reserve liabilities | The sum of (a) interest sensitive contract liabilities, (b) future policy benefits, (c) long-term repurchase obligations, (d) dividends payable to policyholders, and (e) other policy claims and benefits, offset by reinsurance recoverable, excluding policy loans ceded. Net reserve liabilities also includes the reserves related to assumed modco agreements in order to appropriately match the costs incurred in the consolidated statements of operations with the liabilities. Net reserve liabilities is net of the ceded liabilities to third-party reinsurers as the costs of the liabilities are passed to such reinsurers and therefore we have no net economic exposure to such liabilities, assuming our reinsurance counterparties perform under our agreements. Net reserve liabilities includes our economic ownership of ACRA reserve liabilities but does not include the reserve liabilities associated with the noncontrolling interest. | ||||
| Net Return or Net ROE of a total return yield fund or the hybrid credit hedge fund | The gross return after management fees, performance fees allocated to the general partner, or other fees and expenses. Returns over multiple periods are calculated by geometrically linking each period’s return over time. Net return and net ROE do not represent the return to any fund investor. |
||||
| Non-Fee-Generating AUM | AUM that does not produce management fees or monitoring fees. This measure generally includes the following: (i) fair value above invested capital for those funds that earn management fees based on invested capital; (ii) net asset values related to general partner and co-investment interests; (iii) unused credit facilities; (iv) available commitments on those funds that generate management fees on invested capital; (v) structured portfolio company investments that do not generate monitoring fees; and (vi) the difference between gross asset and net asset value for those funds that earn management fees based on net asset value. |
||||
| NYC UBT | New York City Unincorporated Business Tax | ||||
| NYSDFS | New York State Department of Financial Services | ||||
| Other operating expenses within the Principal Investing segment | Expenses incurred in the normal course of business and includes allocations of non-compensation expenses related to managing the business. | ||||
| Other operating expenses within the Retirement Services segment | Expenses incurred in the normal course of business inclusive of compensation and non-compensation expenses. | ||||
| Payout annuities | Annuities with a current cash payment component, which consist primarily of single premium immediate annuities, supplemental contracts and structured settlements. | ||||
| PCD | Purchased Credit Deteriorated Investments | ||||
| Performance allocations, Performance fees, Performance revenues, Incentive fees and Incentive income | The interests granted to Apollo by a fund managed by Apollo that entitle Apollo to receive allocations, distributions or fees which are based on the performance of such fund or its underlying investments. | ||||
| Performance Fee-Eligible AUM | AUM that may eventually produce performance fees. All funds for which we are entitled to receive a performance fee allocation or incentive fee are included in Performance Fee-Eligible AUM, which consists of the following: (i) “Performance Fee-Generating AUM”, which refers to invested capital of the funds, partnerships and accounts we manage, advise, or to which we provide certain other investment-related services, that is currently above its hurdle rate or preferred return, and profit of such funds, partnerships and accounts is being allocated to, or earned by, the general partner in accordance with the applicable limited partnership agreements or other governing agreements; (ii) “AUM Not Currently Generating Performance Fees”, which refers to invested capital of the funds, partnerships and accounts we manage, advise, or to which we provide certain other investment-related services, that is currently below its hurdle rate or preferred return; and (iii) “Uninvested Performance Fee-Eligible AUM”, which refers to capital of the funds, partnerships and accounts we manage, advise, or to which we provide certain other investment-related services, that is available for investment or reinvestment subject to the provisions of applicable limited partnership agreements or other governing agreements, which capital is not currently part of the NAV or fair value of investments that may eventually produce performance fees allocable to, or earned by, the general partner. |
||||
| Perpetual capital | Assets under management of indefinite duration, that may only be withdrawn under certain conditions or subject to certain limitations, including but not limited to satisfying required hold periods or percentage limits on the amounts that may be redeemed over a particular period. The investment management, advisory or other service agreements with our perpetual capital vehicles may be terminated under certain circumstances. |
||||
| Principal Investing Income, or PII | Component of Adjusted Segment Income that is used to assess the performance of the Principal Investing segment. For the Principal Investing segment, PII is the sum of (i) realized performance fees, excluding realizations received in the form of shares, (ii) realized investment income, less (x) realized principal investing compensation expense, excluding expense related to equity-based compensation, and (y) certain corporate compensation and non-compensation expenses. | ||||
| Principal investing compensation | Realized performance compensation, distributions related to investment income and dividends, and includes allocations of certain compensation expenses related to managing the business. | ||||
| Policy loan | A loan to a policyholder under the terms of, and which is secured by, a policyholder’s policy | ||||
| Realized value | All cash investment proceeds received by the relevant Apollo fund, including interest and dividends, but does not give effect to management fees, expenses, incentive compensation or performance fees to be paid by such Apollo fund. | ||||
9
| Redding Ridge | Redding Ridge Asset Management, LLC and its subsidiaries, which is a standalone, self-managed asset management business established in connection with risk retention rules that manages CLOs and retains the required risk retention interests. | ||||
| Redding Ridge Holdings | Redding Ridge Holdings LP | ||||
| Remaining Cost | The initial investment of a fund in a portfolio investment, reduced for any return of capital distributed to date on such portfolio investment | ||||
| Rider reserves | Guaranteed lifetime withdrawal benefits and guaranteed minimum death benefits reserves | ||||
| RMBS | Residential mortgage-backed securities | ||||
| RML | Residential mortgage loan | ||||
| RSUs | Restricted share units | ||||
| SIA | Strategic investment account | ||||
| SPACs | Special purpose acquisition companies | ||||
| Spread Related Earnings, or SRE | Component of Adjusted Segment Income that is used to assess the performance of the Retirement Services segment, excluding certain market volatility and certain expenses related to integration, restructuring, equity-based compensation, and other expenses. For the Retirement Services segment, SRE equals the sum of (i) the net investment earnings on Athene’s net invested assets and (ii) management fees received on business managed for others, primarily the ADIP portion of Athene's business ceded to ACRA, less (x) cost of funds, (y) operating expenses excluding equity-based compensation and (z) financing costs including interest expense and preferred dividends, if any, paid to Athene preferred stockholders. | ||||
| Surplus assets | Assets in excess of policyholder obligations, determined in accordance with the applicable domiciliary jurisdiction’s statutory accounting principles. | ||||
| Tax receivable agreement | The tax receivable agreement entered into by and among APO Corp., the Former Managing Partners, the Contributing Partners, and other parties thereto | ||||
| TDI | Texas Department of Insurance | ||||
| Total Invested Capital | The aggregate cash invested by the relevant Apollo fund and includes capitalized costs relating to investment activities, if any, but does not give effect to cash pending investment or available for reserves and excludes amounts, if any, invested on a financed basis with leverage facilities | ||||
| Total Value | The sum of the total Realized Value and Unrealized Value of investments | ||||
| Traditional private equity funds | Apollo Investment Fund I, L.P. (“Fund I”), AIF II, L.P. (“Fund II”), a mirrored investment account established to mirror Fund I and Fund II for investments in debt securities (“MIA”), Apollo Investment Fund III, L.P. (together with its parallel funds, “Fund III”), Apollo Investment Fund IV, L.P. (together with its parallel fund, “Fund IV”), Apollo Investment Fund V, L.P. (together with its parallel funds and alternative investment vehicles, “Fund V”), Apollo Investment Fund VI, L.P. (together with its parallel funds and alternative investment vehicles, “Fund VI”), Apollo Investment Fund VII, L.P. (together with its parallel funds and alternative investment vehicles, “Fund VII”), Apollo Investment Fund VIII, L.P. (together with its parallel funds and alternative investment vehicles, “Fund VIII”) and Apollo Investment Fund IX, L.P. (together with its parallel funds and alternative investment vehicles, “Fund IX”). |
||||
| U.S. GAAP | Generally accepted accounting principles in the United States of America | ||||
| U.S. RBC | The CAL RBC ratio for AADE, Athene's parent US insurance company | ||||
| U.S. Treasury | United States Department of the Treasury | ||||
| Unrealized Value | The fair value consistent with valuations determined in accordance with GAAP, for investments not yet realized and may include payments in kind, accrued interest and dividends receivable, if any, and before the effect of certain taxes. In addition, amounts include committed and funded amounts for certain investments. | ||||
| Venerable | Venerable Holdings, Inc., together with its subsidiaries | ||||
| VIAC | Venerable Insurance and Annuity Company, formerly Voya Insurance and Annuity Company | ||||
| VIE | Variable interest entity | ||||
| Vintage Year | The year in which a fund’s final capital raise occurred, or, for certain funds, the year of a fund’s effective date or the year in which a fund’s investment period commences pursuant to its governing agreements. | ||||
| VIVAT N.V. | Athora Netherlands N.V. (formerly known as: VIVAT N.V.) | ||||
| VOBA | Value of business acquired | ||||
| VOE | Voting interest entity | ||||
| WACC | Weighted average cost of capital | ||||
10
PART I
ITEM 1. BUSINESS
Index to Business
Overview
Founded in 1990, Apollo is a high-growth, global alternative asset manager and a retirement services provider. Apollo conducts its business primarily in the United States through the following three reportable segments: Asset Management, Retirement Services and Principal Investing. These business segments are differentiated based on the investment services they provide as well as varying investing strategies.
Our Businesses
Asset Management
Our Asset Management segment focuses on three investing strategies: yield, hybrid and equity. These strategies reflect the range of investment capabilities across our platform based on relative risk and return. As an asset manager, we earn fees for providing investment management services and expertise to our client base. The amount of fees charged for managing these assets depends on the underlying investment strategy, liquidity profile, and, ultimately our ability to generate returns for our clients. We also earn capital solutions fees as part of our growing capital solutions business and as part of monitoring and deployment activity alongside our sizable private equity franchise. After expenses, we call the resulting earning stream “Fee Related Earnings” or “FRE”, which represents the primary performance measure for the Asset Management segment. As of December 31, 2022, we had total AUM of $547.6 billion.
Our Asset Management segment had a team of 2,540 employees as of December 31, 2022, with offices throughout the world. This team possesses a broad range of transaction, financial, managerial and investment skills. We operate our asset management business in a highly integrated manner, which we believe distinguishes us from other alternative asset managers. Our investment teams frequently collaborate across disciplines and we believe that this collaboration enables our clients to more successfully invest across a company’s capital structure. Our objective is to achieve superior long-term risk-adjusted returns for our clients. The majority of the investment funds we manage are designed to invest capital over a period of several years from inception, thereby allowing us to seek to generate attractive long-term returns throughout economic cycles. We have a contrarian, value-oriented investment approach, emphasizing downside protection, and the preservation of capital. We believe our contrarian investment approach is reflected in a number of ways, including:
•our willingness to pursue investments in industries that our competitors typically avoid;
•the often complex structures employed in some of the investments of our funds;
•our experience investing during periods of uncertainty or distress in the economy or financial markets; and
•our willingness to undertake transactions that have substantial business, regulatory or legal complexity.
11
We have applied this investment philosophy to identify what we believe are attractive investment opportunities, deploy capital across the balance sheet of industry leading, or “franchise,” businesses and create value throughout economic cycles.
Yield
Yield is our largest asset management strategy with $392.5 billion of AUM as of December 31, 2022. Our yield strategy focuses on generating excess returns through high-quality credit underwriting and origination. Beyond participation in the traditional issuance and secondary credit markets, through our affiliated origination platforms and corporate solutions capabilities we seek to originate attractive and safe-yielding assets for the investors in the funds we manage. Within our yield strategy, we target 4% to 10% returns for our clients. Since inception, the total return yield fund has generated a 5% gross Return on Equity (“ROE”) and 4% net ROE annualized through December 31, 2022. The investment portfolios of the yield-oriented funds Apollo manages include several asset classes, as described below:
•Corporate Fixed Income ($100.9 billion of AUM), which generally includes investment grade corporate bonds, emerging markets investments and investment grade private placement investments;
•Corporate Credit ($76.7 billion of AUM), which includes performing credit investments, including income-oriented, senior loan and bond investments involving issuers primarily domiciled in the U.S. and in Europe as well as investment grade asset-backed securities;
•Structured Credit ($78.5 billion of AUM), which includes corporate structured and asset-backed securities as well as consumer and residential real estate credit investments;
•Real Estate Debt ($38.9 billion of AUM), including debt investments across a broad spectrum of property types and at various points within a property’s capital structure, including first mortgage and mezzanine financing and preferred equity; and
•Direct Origination ($35.5 billion of AUM), which includes originations (both directly with sponsors and through banks) and investments in loans primarily related to middle market lending and aviation finance.
Hybrid
Our hybrid strategy, with $56.4 billion of AUM as of December 31, 2022, brings together our capabilities across debt and equity to seek to offer a differentiated risk-adjusted return with an emphasis on structured downside protected opportunities across asset classes. We target 8% to 15% returns within our hybrid strategy by pursuing investments in all market environments, deploying capital during both periods of dislocation and market strength, and focusing on different investing strategies and asset classes. The flagship hybrid credit hedge fund we manage has generated an 11% gross ROE and a 7% net ROE annualized and the hybrid value funds we manage have generated a 21% gross IRR and a 16% net IRR from inception through December 31, 2022. The investing strategies and asset classes within our hybrid strategy are described below:
•Accord and Credit Strategies ($10.8 billion of AUM), which refers to the investment strategy of certain funds managed by Apollo that invest opportunistically in both the primary and secondary markets in order to seek to capitalize on both near- and longer-term relative value across market cycles. The investment portfolios of these funds include credit investments in a broad array of primary and secondary opportunities encompassing stressed and distressed public and private securities, including senior loans (secured and unsecured), large corporate investment grade loan origination and structured capital solutions, high yield, mezzanine, derivative securities, debtor in possession financings, rescue or bridge financings, and other debt investments.
•Hybrid Value ($10.3 billion of AUM), which refers to the investment strategy of certain funds managed by Apollo that focus on providing companies with, among other things, rescue financing or customized capital solutions, including senior secured and unsecured debt or preferred equity securities, often with equity-linked or equity-like upside, as well as structured equity investments.
•Infrastructure Equity ($5.4 billion of AUM), which refers to the investment strategy of certain funds managed by Apollo that focus on investing in a broad range of infrastructure assets, including communications, midstream energy, power and renewables, and transportation related assets.
12
•Hybrid Real Estate ($5.1 billion of AUM), which includes our real estate income focused strategies, including core, core plus and net lease investments. Our hybrid real estate strategy consists of public and private funds that focus on investing in substantially stabilized commercial real estate properties across property types and geographies, both in the United States and in Europe.
Equity
Our equity strategy represents $98.8 billion of AUM as of December 31, 2022. Our equity strategy emphasizes flexibility, complexity, and purchase price discipline to drive opportunistic-like returns for our clients throughout market cycles. Apollo’s equity team has experience across sectors, industries, and geographies in both private equity and real estate equity. Our control equity transactions are principally buyouts, corporate carveouts and distressed investments, while the real estate funds we manage generally transact in single asset, portfolio and platform acquisitions. Within our equity strategy, we target upwards of 15% returns in the funds we manage. We have consistently produced attractive long-term investment returns in the traditional private equity funds we manage, generating a 39% gross IRR and a 24% net IRR on a compound annual basis from inception through December 31, 2022. Our equity strategy focuses on several investing strategies as described below:
•Flagship Private Equity ($69.1 billion of AUM), which refers to our investment strategy focused on creating investment opportunities with attractive risk-adjusted returns across industries and geographies and throughout market cycles, utilizing our value-oriented investment approach. Through this strategy, we seek to build portfolios of investments that are created at meaningful discounts to comparable market multiples of adjusted cash flow, thereby resulting in what we believe are portfolios focused on capital preservation. The transactions in this strategy include opportunistic buyouts, corporate carveouts and distressed investments. After their acquisition by an Apollo-managed fund, Apollo works with the portfolio companies of the funds it manages to seek to accelerate growth and execute a value creation strategy.
Included within flagship private equity are assets related to our impact investment strategy, which pursues private equity-like investment opportunities with the intention of generating a positive, measurable, social and/or environmental impact while also seeking to generate attractive risk-adjusted returns. The impact investment strategy targets investment opportunities across five core impact-aligned investment themes: (i) economic opportunity, (ii) education; (iii) health, safety and wellness; (iv) industry 4.0; and (v) climate and sustainability.
•European Principal Finance (“EPF”) ($8.0 billion of AUM), which refers to our investment strategy focused on European commercial and residential real estate, performing loans, non-performing loans, and unsecured consumer loans, as well as acquiring assets as a result of distressed market situations. Certain of the European Principal Finance vehicles we manage also own captive pan-European financial institutions, loan servicing and property management platforms that perform banking and lending activities and manage and service consumer credit receivables and loans secured by commercial and residential properties.
•Real Estate Equity ($5.6 billion of AUM), which refers to our value add and opportunistic investment strategies that target investments in real estate and real estate-related assets, portfolios and platforms located across various real estate asset classes in regionally focused private funds in both the United States and Asia.
Perpetual Capital
Included within our investing strategies above is $321.4 billion of perpetual capital, out of the $547.6 billion of AUM as of December 31, 2022. As of December 31, 2022, perpetual capital includes, without limitation, certain assets in our yield strategy, including assets relating to publicly traded and non-traded vehicles, certain origination platform assets and assets managed for certain of our retirement services clients. Perpetual capital assets may be withdrawn under certain circumstances and utilize a range of investment strategies, including those described previously.
Athene
Apollo’s asset management business, through its consolidated subsidiary, ISG, provides a full suite of services for Athene’s investment portfolio, including direct investment management, asset allocation, merger and acquisition asset diligence, and certain operational support services, including investment compliance, tax, legal and risk management support. See “Item 1. Business—Our Businesses—Retirement Services” for further details regarding Athene’s retirement services business. As of
13
December 31, 2022, Apollo managed or advised $236.0 billion of AUM, of which $234.8 billion was Fee-Generating AUM, in accounts owned by or related to Athene (“Athene Accounts”).
Athora
Apollo’s asset management business, through its consolidated subsidiary, ISGI, provides investment advisory services to certain portfolio companies of Apollo funds and Athora, a strategic liabilities platform that acquires or reinsures blocks of insurance business in the German and broader European life insurance market (collectively, the “Athora Accounts”). As of December 31, 2022, Apollo, through its subsidiaries, managed or advised $52.6 billion of AUM and $49.8 billion of Fee-Generating AUM in Athora Accounts. See note 17 to our consolidated financial statements for details regarding the fee arrangements between the Company and Athora.
Athora Non-Sub-Advised Assets
This category includes the Athora assets which are managed by Apollo but not sub-advised by Apollo nor invested in Apollo funds or investment vehicles. We refer to these assets collectively as “Athora Non-Sub-Advised Assets.” Our AUM within the Athora Non-Sub-Advised category totaled $35.8 billion as of December 31, 2022, of which $32.9 billion was Fee-Generating AUM.
Fundraising and Investor Relations
Within the asset management business, our fundraising strategy consists of the yield, hybrid, and equity strategies. We raise private capital from prominent institutional investors, and from public market investors, as in the case of MFIC, AFT, AIF and ARI. In our equity strategy and certain funds in our hybrid strategy, fundraising activities for new funds begin once the investor capital commitments for the current fund are largely invested or committed to be invested. The investor base includes new investors and investors from prior funds, which in many instances have increased their commitments to subsequent funds. During the fundraising effort for Fund IX, investors representing over 85% of Fund VIII’s third party capital committed to Fund IX. The single largest unaffiliated investor in Fund IX represents 4% of Fund IX’s total fund size. In addition, many of our investment professionals commit their own capital to each flagship equity fund.
We maintain a rigorous investment process for yield, hybrid, and equity investments, and have in place procedures to allocate investment opportunities among the funds we manage. We have professionals responsible for selecting, evaluating, structuring, performing due diligence on, negotiating, executing, monitoring and exiting investments for our traditional equity funds, and yield and hybrid funds we manage, respectively, as well as for pursuing operational improvements in the funds’ portfolio companies through management consulting arrangements in case of equity funds. Our investment committees for relevant funds review the analyses of prospective investments, and ultimately approve recommended investments and dispositions.
The processes by which our funds receive and invest capital vary by investing strategy and type of fund. However, in all types of funds we manage, investors deliver capital when called by us as investment opportunities become available. We also have several perpetual capital vehicles with unlimited duration that raise capital by issuing equity securities in the public markets and can also issue debt. Our hedge fund style yield funds, generally structured as limited partnerships with customary redemption rights, continuously offer and sell shares or limited partner interests via private placements through monthly subscriptions, which are payable in full upon a fund’s acceptance of an investor’s subscription. The general partner’s capital commitment is determined through negotiation with the fund’s underlying investor base, and commitments are generally available for approximately six years. Generally, as each investment is realized, these funds first return the capital and expenses related to that investment and any previously realized investments to fund investors and then distribute any profits (which are typically shared 80% to the investors in equity funds and 20% to us, so long as the investors receive at least an 8% compounded annual return on their investment). Allocation of profits between fund investors and us, and the amount of the preferred return, among other provisions, varies for hybrid funds as well as many yield funds. Ownership interests in equity funds and are not subject to redemption prior to termination of the funds.
Our aim has been to build value in the portfolio companies of the hybrid and equity funds we manage. We are actively engaged with the management teams of these portfolio companies to maximize the underlying value of the business, by taking a holistic approach to value-creation and concentrating on both the asset side and liability side of the balance sheet of a company. These portfolio companies seek to capture discounts on publicly traded debt securities through exchange offers and potential debt buybacks. Our established group purchasing program helps the funds' portfolio companies leverage the combined corporate
14
spending among Apollo and portfolio companies of the funds it manages in order to seek to reduce costs, optimize payment terms and improve service levels for all program participants.
The value of the investments that have been made by funds are typically realized through either an initial public offering of common stock on a nationally recognized exchange or through the private sale of the companies in which funds have invested.
General Partner and Professionals Investments and Co-Investments
General Partner Investments
Certain management companies, general partners and co-invest vehicles are committed to contribute to the funds we manage and their affiliates. As a limited partner, general partner and manager of the Apollo funds, Apollo had unfunded capital commitments as of December 31, 2022 of $0.6 billion.
Professionals Investments
To further align our interests with those of investors in the funds we manage, certain of our professionals have invested their own capital in the funds. Our professionals will either re-invest their performance fees to fund these investments or use cash on hand or funds borrowed from third parties. We generally have not historically charged management fees or performance fees on capital invested by our professionals directly in the funds.
Co-Investments
Investors in many of the funds we manage, as well as certain other investors, may have the opportunity to make co-investments with the funds. Co-investments are investments in portfolio companies or other fund assets generally on the same terms and conditions as those to which the applicable fund is subject.
Retirement Services
Our retirement services business is conducted by Athene, a leading financial services company that specializes in issuing, reinsuring and acquiring retirement savings products designed for the increasing number of individuals and institutions seeking to fund retirement needs. Athene is led by a highly skilled management team with extensive industry experience and is based in Bermuda with its U.S. subsidiaries’ headquarters located in Iowa. Our asset management business provides a full suite of services for Athene’s investment portfolio, including direct investment management, asset allocation, merger and acquisition asset diligence and certain operational support services, including investment compliance, tax, legal and risk management support. As of December 31, 2022, Athene had 1,718 employees.
Our retirement services business focuses on generating spread income by combining the two core competencies of (1) sourcing long-term, persistent liabilities and (2) using the global scale and reach of our asset management business to actively source or originate assets with Athene’s preferred risk and return characteristics. Athene’s investment philosophy is to invest a portion of its assets in securities that earn an incremental yield by taking measured liquidity and complexity risk and capitalizing on its long-dated funding profile to prudently achieve higher net investment earned rates, rather than assuming incremental credit risk. A cornerstone of Athene’s investment philosophy is that given the operating leverage inherent in its business, modest investment outperformance can translate to outsized return performance. Because Athene maintains discipline in underwriting attractively priced liabilities, it has the ability to invest in a broad range of high-quality assets to generate attractive earnings.
Our asset management expertise supports the sourcing and underwriting of assets for Athene’s portfolio. Athene is invested in a diverse array of primarily high-grade fixed income assets, including corporate bonds, structured securities and commercial and residential real estate loans, among others. Athene establishes risk thresholds which in turn define risk tolerance across a wide range of factors, including credit risk, liquidity risk, concentration risk and caps on specific asset classes. In addition to other efforts, Athene partially mitigates the risk of rising interest rates by strategically allocating a meaningful portion of its investment portfolio into floating rate securities. Athene also maintains holdings in less interest rate-sensitive investments, including collateralized loan obligations (“CLO”), commercial mortgage loans (“CML”), residential mortgage loans (“RML”), non-agency residential mortgage-backed securities (“RMBS”) and various types of structured products, consistent with its strategy of pursuing incremental yield by assuming liquidity risk and complexity risk, rather than assuming incremental credit risk.
15
Rather than increase its allocation to higher risk securities to increase yield, Athene pursues the direct origination of high-quality, predominantly senior secured assets, which it believes possess greater alpha-generating qualities than securities that would otherwise be readily available in public markets. These direct origination strategies include investments sourced by (1) affiliated platforms that originate loans to third parties and in which Athene gains exposure directly to the loan or indirectly through its ownership of the origination platform and/or securitizations of assets originated by the origination platform, and (2) our asset management team’s extensive network of direct relationships with predominantly investment-grade counterparties.
Athene uses, and may continue to use, derivatives, including swaps, options, futures and forward contracts, and reinsurance contracts to hedge risks such as current or future changes in the fair value of its assets and liabilities, current or future changes in cash flows, changes in interest rates, equity markets, currency fluctuations and changes in longevity.
Products
Athene principally offers two product lines: annuities and funding agreements.
Annuities
Athene’s primary product line is annuities, which include Fixed Indexed Annuities (“FIA”), Fixed Rate Annuities, Registered Index-Linked Annuities (“RILAs”), Payout Annuities and Group Annuities.
Fixed Indexed Annuities. FIAs are the majority of Athene’s net reserve liabilities. FIAs are a type of insurance contract in which the policyholder makes one or more premium deposits which earn interest, on a tax deferred basis, at a crediting rate based on a specified market index, subject to a specified cap, spread or participation rate. FIAs allow policyholders the possibility of earning interest without significant risk to principal, unless the contract is surrendered during a surrender charge period. A market index tracks the performance of a specific group of stocks or other assets representing a particular segment of the market, or in some cases, an entire market. Athene generally buys options on the indices to which the FIAs are tied to hedge the associated market risk. The cost of the option is priced into the overall economics of the product as an option budget.
Athene generates income on FIA products by earning an investment spread, based on the difference between (1) income earned on the investments supporting the liabilities and (2) the cost of funds, including fixed interest credited to customers, option costs, the cost of providing guarantees (net of rider fees), policy issuance and maintenance costs, and commission costs.
Fixed Rate Annuities. Fixed rate annuities include annual reset annuities and multi-year guaranteed annuities (“MYGA”). Unlike FIAs, fixed rate annuities earn interest at a set rate (or declared crediting rate), rather than a rate that may vary based on an index. Fixed rate annual reset annuities have a crediting rate that is typically guaranteed for one year. After such period, Athene has the ability to change the crediting rate at its discretion, generally once annually, to any rate at or above a guaranteed minimum rate. MYGAs are similar to annual reset annuities except that the initial crediting rate is guaranteed for a specified number of years, rather than just one year, before it may be changed at Athene’s discretion. After the initial crediting period, MYGAs can generally be reset annually.
Registered Index-Linked Annuities. RILAs are similar to FIAs in offering the policyholder the opportunity for tax-deferred growth based in part on the performance of a market index. Compared to an FIA, RILAs have the potential for higher returns but also have the potential for risk of loss to principal and related earnings. RILAs provide the ability for the policyholder to participate in the positive performance of certain market indices during a term, limited by a cap or adjusted for a participation rate. Negative performance of the market indices during a term can result in negative policyholder returns, with downside protection typically provided in the form of either a “buffer” or a “floor” to limit the policyholder’s exposure to market loss. A “buffer” is protection from negative exposure up to a certain percentage, typically 10 or 20 percent. A “floor” is protection from negative exposure less than a stated percentage (i.e., the policyholder risks exposure of loss up to the “floor,” but is protected against any loss in excess of this amount).
Income Riders to Fixed Annuity Products. The income riders on Athene’s deferred annuities can be broadly categorized as either guaranteed or participating. Guaranteed income riders provide policyholders with a guaranteed lifetime withdrawal benefit, which permits policyholders to elect to receive guaranteed payments for life from their contract without having to annuitize their policies. Participating income riders tend to have lower levels of guaranteed income than guaranteed income riders but provide policyholders the opportunity to receive greater levels of income if the policies’ indexed crediting strategies perform well. As of December 31, 2022, 32% of Athene’s deferred annuity account value had rider benefits.
16
Withdrawal Options for Deferred Annuities. After the first year following the issuance of a deferred annuity, the policyholder is typically permitted to make withdrawals up to 5% or 10% (depending on the contract) of the prior year’s value without a surrender charge or market value adjustment (“MVA”), subject to certain limitations. Withdrawals in excess of the allowable amounts are assessed a surrender charge and MVA if such withdrawals are made during the surrender charge period of the policy, which generally ranges from 3 to 20 years. The surrender charge for most Athene products at contract inception is generally between 5% and 15% of the contract value and decreases by approximately one percentage point per year during the surrender charge period. The average surrender charge (excluding the impact of MVAs) was 6% for Athene’s deferred annuities as of December 31, 2022.
At maturity, the policyholder may elect to receive proceeds in the form of a single payment or an annuity. If the annuity option is selected, the policyholder will receive a series of payments either over the policyholder’s lifetime or over a fixed number of years, depending upon the terms of the contract. Some contracts permit annuitization prior to maturity.
Payout Annuities. Payout annuities primarily consist of single premium immediate annuities (“SPIA”), supplemental contracts and structured settlements. Payout annuities provide a series of periodic payments for a fixed period of time or for the life of the policyholder, based upon the policyholder’s election at the time of issuance. The amounts, frequency and length of time of the payments are fixed at the outset of the annuity contract. SPIAs are often purchased by persons at or near retirement age who desire a steady stream of payments over a future period of years. Supplemental contracts are typically created upon the conversion of a death claim or the annuitization of a deferred annuity. Structured settlements generally relate to legal settlements.
Group Annuities. Group annuities issued in connection with pension group annuity transactions usually involve a single premium group annuity contract issued to discharge certain pension plan liabilities. The group annuities that Athene issues are non-participating contracts. The assets supporting the guaranteed benefits for each contract may be held in a separate account. Group annuity benefits may be purchased for current, retired and/or terminated employees and their beneficiaries covered under terminating or continuing pension plans. Both immediate and deferred annuity certificates may be issued pursuant to a single group annuity contract. Immediate annuity certificates cover those retirees and beneficiaries currently receiving payments, whereas deferred annuity certificates cover those participants who have not yet begun receiving benefit payments. Immediate annuity certificates have no cash surrender rights, whereas deferred annuity certificates may include an election to receive a lump sum payment, exercisable by the participant upon either the participant achieving a specified age or the occurrence of a specified event, such as termination of the participant’s employment.
Athene earns income on group annuities based upon the spread between the return on the assets received in connection with the pension group annuity transaction and the cost of the pension obligations assumed. Group annuities expose Athene to longevity risk, which would be realized if plan participants live longer than assumed in underwriting the transaction, resulting in aggregate payments that exceed Athene’s expectations. However, Athene’s conservative underwriting process makes use of a wealth of pre- and post-selection participant data, including mortality experience data, particularly for mid to large size transactions, to mitigate this risk.
Funding Agreements
Funding agreements include those issued to institutions and to special-purpose unaffiliated trusts in connection with Athene’s funding agreement backed notes (“FABN”) and secured funding agreement backed repurchase agreement (“FABR”) programs. Funding agreements are issued opportunistically to institutional investors at attractive risk-adjusted funding costs. Funding agreements are negotiated privately between an investor and an insurance company. They are designed to provide an agreement holder with a guaranteed return of principal and periodic interest payments, while offering competitive yields and predictable returns. The interest rate can be fixed or floating. Athene also includes repurchase agreements with a term that exceeds one year at the time of execution within the funding agreement product category.
Distribution Channels
Athene has developed four dedicated distribution channels to address the retirement services market: retail, flow reinsurance, institutional and acquisitions and block reinsurance, which support opportunistic origination across differing market environments. Additionally, Athene believes these distribution channels enable it to achieve stable asset growth while maintaining attractive returns.
17
Retail
Athene has built a scalable platform that allows it to originate and rapidly grow its business in deferred annuity products. Athene has developed a suite of retirement savings products, distributed through its network of approximately 54 independent marketing organizations (“IMOs”); approximately 78,000 independent agents in all 50 states; and a growing network of 16 banks and 127 regional broker-dealers. Athene is focused in every aspect of its retail channel on providing high quality products and service to its policyholders and maintaining appropriate financial protection over the life of their policies.
Flow Reinsurance
Flow reinsurance provides another channel for Athene to source liabilities with attractive cost of funds and offers insurance companies the opportunity to improve their product offerings and enhance their financial results. As in the retail channel, Athene does not pursue flow volume growth at the expense of profitability, and therefore tends to respond rapidly to adjust pricing for changes in asset yields.
Reinsurance is an arrangement under which an insurance company, the reinsurer, agrees to indemnify another insurance company, the ceding company or cedant, for all or a portion of certain insurance risks underwritten by the ceding company. Reinsurance is designed to (1) reduce the net amount at risk on individual risks, thereby enabling the ceding company to increase the volume of business it can underwrite, as well as increase the maximum risk it can underwrite on a single risk, (2) stabilize operating results by reducing volatility in the ceding company’s loss experience, (3) assist the ceding company in meeting applicable regulatory requirements and (4) enhance the ceding company’s financial strength and surplus position.
Within its flow reinsurance channel, Athene conducts third-party flow reinsurance transactions primarily through its subsidiary, Athene Life Re Ltd. (“ALRe”). As a fixed annuity reinsurer, ALRe partners with insurance companies to develop solutions to their capital requirements, enhance their presence in the retirement market and improve their financial results. The specific liabilities that ALRe targets to reinsure include FIAs, MYGAs, traditional one-year guarantee fixed deferred annuities, immediate annuities and institutional products.
Institutional
Athene’s institutional channel includes funding agreements and pension group annuities.
Funding Agreements. Athene participates in an FABN program through which it may issue funding agreements to a special-purpose trust, that issues senior secured medium-term notes. The notes are underwritten and marketed by major investment banks’ broker-dealer operations and are sold to institutional investors. The proceeds of the issuance of notes are used by the trust to purchase one or more funding agreements from Athene subsidiaries with matching interest and maturity payment terms. Athene also established a secured FABR program, in which a special-purpose, unaffiliated entity may enter into a repurchase agreement with a bank and the proceeds of the repurchase agreement are used by the special-purpose entity to purchase funding agreements from Athene subsidiaries. Athene is also a member of the Federal Home Loan Bank of Des Moines (“FHLB”) and, through membership, has issued funding agreements to the FHLB in exchange for cash advances. Athene is required to provide collateral in excess of the funding agreement amounts outstanding, considering any discounts to the securities posted and prepayment penalties. Finally, repurchase agreements with an original maturity exceeding one year at the time of execution are also included within the funding agreement product category.
Pension Group Annuities. Athene partners with institutions seeking to transfer and thereby reduce their obligation to pay future pension benefits to retirees and deferred participants through pension group annuities. Athene works with advisors, brokers and consultants to source pension group annuity transactions and design solutions that meet the needs of prospective pension group annuity counterparties.
Acquisitions and Block Reinsurance
Acquisitions. Acquisitions are a complementary source of growth in our retirement services business. Athene has a proven ability to acquire businesses in complex transactions at favorable terms, manage the liabilities acquired and reinvest the associated assets.
Block Reinsurance. Through block reinsurance transactions, Athene partners with life and annuity companies to decrease their exposure to one or more products or to divest of lower-margin or non-core segments of their businesses. Unlike acquisitions in
18
which Athene acquires the assets or stock of a target company, block reinsurance allows Athene to contractually assume assets and liabilities associated with a certain book of business. In doing so, Athene contractually assumes responsibility for only that portion of the business that it deems desirable, without assuming additional liabilities.
Capital
Athene believes it has a strong capital position and is well positioned to meet policyholder and other obligations. Athene measures capital sufficiency using an internal capital model which reflects management’s view on the various risks inherent to its business, the amount of capital required to support its core operating strategies and the amount of capital necessary to maintain its current ratings in a recessionary environment. The amount of capital required to support Athene’s core operating strategies is determined based upon internal modeling and analysis of economic risk, as well as inputs from rating agency capital models and consideration of both National Association of Insurance Commissioners (“NAIC”) risk-based capital (“RBC”) and Bermuda capital requirements. Capital in excess of this required amount is considered excess equity capital, which is available to deploy.
Deployable Capital
Athene’s deployable capital is comprised of capital from three sources: excess equity capital, untapped debt capacity and available undrawn capital commitments from ACRA. As of December 31, 2022, Athene estimates that it had approximately $5.2 billion in capital available to deploy, consisting of approximately $2.3 billion in excess equity capital, $2.7 billion in untapped debt capacity (assuming a peer average adjusted debt to capitalization ratio of 25%) and $0.2 billion in available undrawn capital at ACRA, subject, in the case of debt capacity, to market conditions and general availability.
ACRA
In order to support growth strategies and capital deployment opportunities, Athene established ACRA as a long-duration, on-demand capital vehicle. Athene owns 36.55% of ACRA’s economic interests and all of ACRA’s voting interests, with the remaining 63.45% of the economic interests being owned by Apollo/Athene Dedicated Investment Program (“ADIP”), a series of funds managed by Apollo. ACRA participates in certain transactions by drawing a portion of the required capital for such transactions from third-party investors equal to ADIP’s proportionate economic interest in ACRA. This strategic capital solution is designed to provide Athene the flexibility to simultaneously deploy capital across multiple accretive avenues and sustain a profitable growth strategy at scale in a capital efficient manner, while maintaining a strong financial position.
Uses of Capital
Athene’s capital deployment includes the payment for a business opportunity, such as the payment of a ceding commission to enter into a block reinsurance transaction, and the retention of capital based on Athene’s internal capital model. Currently, Athene deploys capital in four primary ways: (1) supporting organic growth, (2) supporting inorganic growth, (3) making dividend payments to AGM, and (4) retaining capital to support financial strength ratings upgrades. Athene generally seeks mid-teen or higher returns on its capital deployment.
Internal Reinsurance
Subject to quota shares generally ranging from 80% to 100%, substantially all of the existing deposits held and new deposits generated by Athene’s U.S. insurance subsidiaries are reinsured to its Bermuda reinsurance subsidiaries. Athene maintains the same reserving standards for its Bermuda reinsurance subsidiaries as it does for its U.S. insurance subsidiaries. Athene also retrocedes certain inorganic transactions, pension group annuity transactions, funding agreement transactions and retail business to ACRA. Athene’s internal reinsurance structure provides it with several strategic and operational advantages, including the aggregation of regulatory capital, which makes the aggregate capital of its Bermuda reinsurance subsidiaries available to support the risks assumed by each entity, and enhanced operating efficiencies. As a result of its internal reinsurance structure and third-party direct to Bermuda business, a significant majority of Athene’s aggregate capital is held by its Bermuda reinsurance subsidiaries.
Ratings
As of December 31, 2022, each of Athene’s significant insurance subsidiaries is rated “A+”, “A1” or “A” by the four rating agencies that evaluate the financial strength of such subsidiaries. To achieve financial strength ratings aspirations in the
19
Retirement Services segment, Athene may choose to retain additional capital above the level required by the rating agencies to support operating needs. Athene believes there are numerous benefits to achieving stronger ratings over time, including increased recognition of and confidence in its financial strength by prospective business partners, particularly within product distribution, as well as potential profitability improvements in certain organic channels through lower funding costs.
Principal Investing
Our Principal Investing segment is comprised of our realized performance fee income, realized investment income from our balance sheet investments, and certain allocable expenses related to corporate functions supporting the entire company. The Principal Investing segment also includes our growth capital and liquidity resources at AGM. We expect to deploy capital into strategic investments over time that will help accelerate the growth of our Asset Management segment, by broadening our investment management and/or product distribution capabilities or increasing the efficiency of our operations. We believe these investments will translate into greater compounded annual growth of Fee Related Earnings.
Given the cyclical nature of performance fees, earnings from our Principal Investing segment, or Principal Investing Income (“PII”), is inherently more volatile in nature than earnings from the Asset Management and Retirement Services segments. We earn fees based on the investment performance of the funds we manage and compensate our employees, primarily investment professionals, with a meaningful portion of these proceeds to align our team with the investors in the funds we manage and incentivize them to deliver strong investment performance over time. We expect to increase the proportion of performance fee income we pay to our employees over time, and as such proportion increases, we expect PII to represent a relatively smaller portion of our total earnings.
Competition
Asset Management
Within the asset management business, Apollo operates in an intensely competitive industry, and expects it to remain so. We compete globally and on a regional, industry and niche basis.
We face competition both in the pursuit of outside investors for the funds we manage and in such funds acquiring investments in attractive portfolio companies and making other fund investments. We compete for outside investors for the funds we manage based on a variety of factors, including:
•investment performance;
•investor perception of investment managers’ drive, focus and alignment of interest;
•quality of service provided to and duration of relationship with investors;
•business reputation; and
•the level of fees and expenses charged for services.
Competition is also intense for the attraction and retention of qualified employees. Our ability to continue to compete effectively in our businesses will depend upon our ability to attract new employees and retain and motivate our existing employees.
For additional information concerning the competitive risks that we face, see “Item 1A. Risk Factors—Operating Risks—We operate in highly competitive industries, which could limit our ability to achieve our growth strategies and could materially and adversely affect our businesses, financial condition, results of operations, cash flows and prospects.”
Retirement Services
Athene operates in highly competitive markets. It faces a variety of large and small industry participants, including diversified financial institutions and insurance and reinsurance companies. These companies compete in one form or another for the growing pool of retirement assets driven by a number of external factors such as the continued aging of the population and the reduction in safety nets provided by governments and private employers. In the markets in which Athene operates, scale and the ability to provide value-added services and build long-term relationships are important factors to compete effectively. Athene believes that its leading presence in the retirement market, diverse range of capabilities and broad distribution network uniquely position it to effectively serve consumers’ increasing demand for retirement solutions, particularly in the FIA market.
20
Athene faces competition in the FIA market from traditional insurance carriers such as Allianz Life Insurance Company of North America (“Allianz”) and Corebridge Financial (formerly AIG Life & Retirement). Principal competitive factors for FIAs are initial crediting rates, reputation for renewal crediting action, product features, brand recognition, customer service, distribution capabilities and financial strength ratings of the provider. Competition may affect, among other matters, both business growth and the pricing of products and services.
Reinsurance markets are highly competitive, as well as cyclical by product and market. As a reinsurer, ALRe competes on the basis of many factors, including, among other things, financial strength, pricing and other terms and conditions of reinsurance agreements, reputation, service and experience in the types of business underwritten. The impact of these and other factors is generally not consistent across lines of business, domestic and international geographical areas and distribution channels. ALRe’s competition includes other insurance and reinsurance companies, such as Resolution Life Group Holdings LP and Global Atlantic Financial Group Limited (together with its subsidiaries, Global Atlantic).
Athene faces strong competition within its institutional channel. With respect to funding agreements, namely those issued in connection with its FABN program, Athene competes with other insurers that have active FABN programs, such as MetLife, Inc. (“MetLife”) and New York Life Insurance Company. Within the funding agreement market, it competes primarily on the basis of perceived financial strength, interest rates and term. With respect to group annuities, Athene competes with other insurers that offer such annuities, such as MetLife and Prudential Financial, Inc. Within the pension group annuities market, it competes primarily on the basis of price, underwriting, investment capabilities and its ability to provide quality service to the corporate sponsor’s pension participants.
Finally, Athene faces competition in the market for acquisition targets and profitable blocks of insurance. Such competition is likely to intensify as insurance businesses become more attractive acquisition targets for both other insurance companies and financial and other institutions and as the already substantial consolidation in the financial services industry continues. Athene competes for potential acquisition and block reinsurance opportunities based on a number of factors, including perceived financial strength, brand recognition, reputation and the pricing it is able to offer, which, to the extent Athene determines to finance a transaction, is in turn dependent on its ability to do so on suitable terms. Athene believes its demonstrated ability to source and consummate large and complex transactions is a competitive advantage over other potential acquirers.
Human Capital
We believe that investing in opportunities, communities and our people helps us to achieve exceptional outcomes for our shareholders and fund investors and a positive social impact. Apollo’s talent is instrumental to our success as a global alternative asset manager and retirement services provider, and investing in and fostering a high-performing, diverse and inclusive workforce is a key pillar of operating our business. We believe this commitment to diversity, equity and inclusion is central to the Apollo business model, an integrated platform which fosters strong collaboration across businesses and functions. Rooted in our core values, we strive to build a culture where our talent can excel and grow in their careers.
Diversity, Equity, and Inclusion
At Apollo, we feel strongly that building a diverse and inclusive workforce is a strategic imperative.
We are approaching our diversity, equity and inclusion strategy through the positioning of our “expanding opportunity” initiative. Expanding opportunity focuses on three specific areas – workplace, marketplace and community. In collaboration with our employees, we are seeking to empower our entire organization to expand opportunity for underrepresented groups in the work we do, every day. We are keenly focused on how we attract, retain, develop and advance talent at Apollo. We believe that an engaged, diverse workforce is one that will bring its best ideas to innovate and drive value for the firm. To grow a more diverse workforce, we have established arrangements with several organizations to identify diverse talent. We are also committed to development of our existing talent through various opportunities including internal mobility, leadership development programs, and our employee affinity networks. Across the organization, from our team dedicated to citizenship initiatives to our employee affinity networks, we are committed to advancing a shared goal of building a more inclusive, modern high-performance culture.
21
Talent Development
We believe that ongoing professional development is a critical part of our culture at Apollo and an important enabler of our investment process. Because of our entrepreneurial culture, the breadth of our integrated platform, and our reputation for strong investment performance, we believe we can attract, develop and retain top talent. We have development programs in place at the associate, principal, managing director and partner levels which demonstrate our commitment to developing, engaging and retaining our employees. In addition to our training and annual review programs, we have instituted annual employee surveys that measure employee satisfaction and engagement, and help evaluate and guide human capital decision-making. We work in partnership with our employees to build ongoing culture and diversity, equity and inclusion initiatives that advance our goal of being a great place to work.
Compensation and Benefits
We work to offer a compelling employee value proposition to support our employees’ well-being and reward strong performance. Our pay for performance compensation philosophy is designed to reward employees for performance and to align employee interests with the firm’s long-term growth and with our shareholders. All of our employees are granted stock through a range of equity-based compensation programs, including our One Apollo stock program. A central component of our value proposition is engaging our people at all levels as leaders in building our culture and engaging in our communities. Our benefits programs are intended to support our employees and their families, and include healthcare, wellness initiatives, retirement programs, paid time off and family leave.
Citizenship
Apollo seeks to actively invest in our communities and engage our employees and other stakeholders in meaningful and impactful Citizenship Programs. Apollo offers its employees philanthropic, volunteer, and other forms of engagement to strengthen communities and expand opportunity around the globe. To empower employees to give back, Apollo hosts volunteer events and provides Citizenship Grants for matching gifts and volunteer rewards each year. Apollo is proud to amplify the efforts of employees, supporting the communities in which they live and the causes and organizations of greatest importance to them.
Apollo Opportunity Foundation
The Apollo Opportunity Foundation was launched in February 2022 to invest in non-profit organizations working to expand opportunity for underrepresented individuals. The Apollo Opportunity Foundation’s mission is to expand opportunity in communities where our employees live and work around the globe by deploying our capital and engaging our people to invest in career education, workforce development and economic empowerment for all. The Apollo Opportunity Foundation seeks to partner with organizations that are championed by our people to advance economic prosperity and expand opportunity for underrepresented individuals.
Environmental, Social and Governance
At Apollo, we believe that taking Sustainability and Environmental, Social and Governance (“ESG”) factors into account can help drive value creation, and we recognize the unique opportunity to do well by doing good through investments.
We understand the potential financial, social and operational benefits of implementing ESG factors into our investment processes and have invested across industries aligned with the United Nation’s Sustainable Development Goals, including healthcare, education, and energy transition.
For more than 14 years, Apollo’s ESG program has committed extensive resources, time, and capital to incorporate ESG factors into our investment analysis and investment decision-making, consistent with fiduciary obligations to deliver superior risk-adjusted returns for investors. We strive to engage with portfolio companies and issuers on ESG issues across investment portfolios, seek appropriate and applicable disclosures, report on our ESG activities and progress, and the ESG activities and progress of portfolio companies of the funds we manage, to fund investors, shareholders, and stakeholders alike, and support the implementation of ESG best practices across the alternative asset management and retirement services industries.
22
In 2022, as part of Apollo’s effort to create an industry-leading corporate governance model, AGM’s board of directors established a sustainability and corporate responsibility committee of the board of directors. This committee assists the board of directors in overseeing AGM’s corporate responsibility and sustainability matters, including environmental sustainability and climate change, human rights, social impact, employee health and safety, and diversity, equity and inclusion. Apollo also took several steps in 2022 to support climate-related financial transparency and strengthen our internal capabilities.
Regulatory and Compliance Matters
Our businesses, as well as the financial services and insurance industries generally, are subject to extensive regulation in the United States and around the world. Virtually all aspects of our business are subject to various laws and regulations, some of which are summarized below. Under these laws and regulations, agencies that regulate investment advisers, investment funds, insurance companies, broker-dealers and other individuals and entities have broad administrative powers, including the power to limit, restrict or prohibit the regulated entity or person from carrying on business if it fails to comply with such laws and regulations.
Failure to comply with applicable regulatory and compliance requirements may result in a variety of consequences, including fines, administrative measures, suspension of voting rights, suspension of individual employees, limitations on engaging in certain lines of business for specified periods of time or mandatory disposal of interests in any affected regulated entity, revocation of investment adviser, insurance, broker-dealer and other registrations, licenses or charters, censures and other regulatory sanctions.
The legal and regulatory requirements applicable to our business are ever evolving and may become more restrictive, which may make compliance with applicable requirements more difficult or expensive or otherwise restrict our ability to conduct our business activities in the manner in which they are now conducted. Our businesses have operated for many years within a legal framework that requires our being able to monitor and comply with a broad range of legal and regulatory developments that affect our activities. However, additional legislation, changes in rules promulgated by self-regulatory organizations or changes in the interpretation or enforcement of existing laws and rules, either in the United States or elsewhere, may directly affect our mode of operation and profitability.
The complex regulatory frameworks governing financial institutions, insurance companies, insurance distributors and their respective holding companies and subsidiaries, as well as those with investments in them, are very detailed and technical. Accordingly, the discussion below is general in nature, does not purport to be complete and is current only as of the date of this report.
Financial Services Regulation
Our financial services businesses, subsidiaries and/or affiliates are regulated under, among others, the Investment Advisers Act; the Investment Company Act; the Dodd-Frank Wall Street Reform and Consumer Protection Act (the “Dodd-Frank Act”); the EU Alternative Investment Fund Managers Directive; the EU Markets in Financial Instruments Directive; the Regulation on OTC Derivatives, Central Counterparties and Trade Repositories; the Financial Stability Oversight Council; the Federal Reserve; the SEC; FINRA; the U.S. Department of Labor; the Internal Revenue Service; the Office of the Comptroller of the Currency; the Federal Communications Commission; banking and financial regulators in the European Union, Germany, Slovenia and the United Kingdom; as well as rules and regulations over CLO risk retention, real estate investment trusts, broker-dealers, “over the counter” derivatives markets, commodity pool operators, commodity trading advisors, gaming companies and natural resources companies.
Regulation under the Investment Advisers Act. We conduct our advisory business through our investment adviser subsidiaries, including Apollo Capital Management, L.P., Apollo Investment Management, L.P., Apollo Credit Management, LLC, ARIS Management, LLC, Apollo Capital Credit Adviser, LLC and Apollo Real Estate Fund Adviser, LLC, each of which is registered as an investment adviser with the SEC under the Investment Advisers Act. Apollo Capital Management, L.P. has a number of relying advisers that operate a single advisory business and rely on umbrella registration to be deemed registered as an investment adviser with the SEC. All of our SEC-registered investment advisers are subject to the requirements and regulations of the Investment Advisers Act.
Regulation as a Broker-Dealer. Apollo Global Securities, LLC (“AGS”) and Griffin Capital Securities, LLC (“GCS”), each of which is a subsidiary of Apollo, are registered as broker-dealers with the SEC and in the U.S. states and territories and are members of the Financial Industry Regulatory Authority, Inc. (“FINRA”). Broker-dealers are subject to regulations that cover
23
all aspects of the securities business, including, among other things, the implementation of a supervisory control system and effective compliance program, advertising and sales practices, conduct of and compensation in connection with public securities offerings, maintenance of adequate net capital, financial reporting, record keeping, and the conduct and qualifications of directors, officers, employees and other associated persons. State securities regulators also have regulatory oversight authority over AGS and GCS. In addition, one of our non-U.S. subsidiaries, Apollo Capital Solutions Europe B.V., is regulated under relevant broker-dealer regulations in the Netherlands. See “—Regulated Entities Outside of the U.S.” below.
Regulation as a Commodity Pool Operator and Commodity Trading Advisor. Certain investment activities entered into by Apollo managers may subject those managers to provisions of the Commodities Exchange Act and oversight by the Commodities Futures Trading Commission, including registration as a commodity pool operator or commodity trading advisor. Apollo intends to rely on exemptions from registration when available.
In addition, certain of the funds we manage are registered management investment companies under the Investment Company Act.
We are also subject to laws and regulations governing payments and contributions to public officials or other parties, including restrictions imposed by the U.S. Foreign Corrupt Practices Act, as well as economic sanctions and export control laws administered by the U.S. Treasury Department’s Office of Foreign Assets Control, the U.S. Department of Commerce and the U.S. Department of State.
As a result of certain investments of ours and the funds we manage in financial institutions that operate outside of the United States, Apollo is subject to regulatory supervision by international financial regulators, including the European Union, German, Slovenian and U.K. financial regulators and applicable requirements set forth in the relevant banking and consumer finance regulations of such jurisdictions. In certain cases, such regulations impose suitability and conduct standards on the Company and require notice to and in certain instances approval of, the relevant regulatory authority of an intent to increase or decrease holdings in the relevant entity outside of specified thresholds, or other contemplated changes in structure, or transactions. Failure to comply with these applicable requirements may result in a variety of consequences, including fines, administrative measures, suspension of voting rights, mandatory disposal of interests in the regulated entity or other regulatory sanctions.
Insurance Regulation
Our businesses, subsidiaries and affiliates are subject to a wide variety of insurance and insurance holding company system laws and regulations in both the United States and numerous other jurisdictions, including the European Union, Bermuda, the United Kingdom, Ireland, Italy, Germany, Belgium, the Netherlands, Australia, Singapore, Cayman Islands, Canada, Malaysia and Hong Kong.
United States
Within the United States, laws and regulations that we are subject to generally require each insurance company subsidiary to register with the insurance department in its domiciliary state and to furnish financial and other information about the operations of companies within its holding company system. These regulations also impose restrictions and limitations on the ability of an insurance company subsidiary to pay dividends and make other distributions to its parent company. In addition, transactions between an insurance company and other companies within its holding company system, including sales, loans, investments, reinsurance agreements, tax allocation agreements, management agreements and service agreements, must be on terms that are fair and reasonable and, if material or within a specified category, require prior notice and approval or non-disapproval by the applicable domiciliary state insurance department.
State insurance authorities have broad administrative powers over the insurance business of our insurance company affiliates, including: (1) licensing to transact business; (2) licensing of producers who sell our products; (3) prescribing which assets and liabilities are to be considered in determining statutory surplus; (4) regulating premium rates for certain insurance products; (5) approving policy forms and certain related materials; (6) determining whether a reasonable basis exists as to the suitability of the annuity purchase recommendations producers make and, in certain states, that such recommendations are in the best interest of the consumer; (7) regulating unfair trade and claims practices; (8) establishing reserve requirements, solvency standards and minimum capital requirements; (9) regulating the amount of dividends that may be paid in any year; (10) regulating the availability of reinsurance, the terms thereof and the ability of an insurer to take credit on its financial statements for insurance ceded to reinsurers; (11) fixing maximum interest rates on life insurance policy loans, minimum crediting rates on accumulation
24
products and minimum allowable surrender values; (12) regulating the type, amounts and valuations of investments permitted; (13) setting parameters for transactions with affiliates; and (14) regulating certain other matters.
All states have insurance laws that require regulatory approval of a direct or indirect change of control of an insurer, which would include a change of control of its holding company. Such laws prevent any person from acquiring direct or indirect control of any of our U.S. insurance subsidiaries or their holding companies unless that person has filed a statement with specified information with the commissioner, superintendent or director of the insurance department of the applicable state (each, a “Commissioner”) and has obtained the Commissioner’s prior approval. Under such state statutes, acquiring 10% or more of a voting interest in an insurer or its parent company is presumptively considered a change of control, although such presumption may be rebutted. Accordingly, any person who acquires 10% or more of a voting interest in a direct or indirect parent of any of our U.S. insurance subsidiaries without the prior approval of the Commissioner of the applicable state will be in violation of the applicable state’s law and may be subject to injunctive action requiring the disposition or seizure of those securities by the Commissioner or prohibiting the voting of those securities and/or to other actions determined by the Commissioner. Further, a willful violation of these laws is punishable in each state as a criminal offense.
In addition, state insurance holding company laws require any controlling person of a U.S. insurer seeking to divest its controlling interest in the insurer to file with the relevant Commissioner a confidential notice of the proposed divestiture at least thirty days prior to the cessation of control (unless a person acquiring control from the divesting party has filed notice of the proposed acquisition of control with the Commissioner). After receipt of the notice, the Commissioner must determine whether the parties seeking to divest or to acquire a controlling interest will be required to file for or obtain approval of the transaction. These laws may discourage potential acquisition proposals and may delay, deter or prevent an acquisition of control of a direct or indirect parent of any of our U.S. insurance subsidiaries (in particular through an unsolicited transaction), even if the shareholders of such parent consider such transaction to be desirable.
Other Jurisdictions
The operations of our insurance subsidiaries and branches operating outside the United States are subject to the local regulatory and supervisory schemes in the jurisdictions in which they operate, which vary widely from country to country; however, regulators typically grant licenses to operate and control an insurance business in that jurisdiction. In general, insurance regulators in these jurisdictions have the administrative power to supervise the registration of agents, regulation of product features and product approvals, asset allocation, minimum capital requirements, solvency and reserves, policyholder liabilities, and investments. Regulatory authorities may also regulate affiliations with other financial institutions, shareholder structures and may impose restrictions on declaring dividends and the ability to effect certain capital transactions, and many jurisdictions require insurance companies to participate in policyholder protection schemes.
Many of the insurance regulatory frameworks that govern our insurance entities operating outside the United States require the prior consent of the applicable regulator in such jurisdictions before (i) any person can become a “controller”/“qualifying holder” or increase its direct or indirect holding in any regulated company, or over the parent undertaking of any such regulated company or (ii) any increase of an existing holding that would result in a person reaching the applicable thresholds of the jurisdiction (e.g., 10%, 20%, 30% or 33% and 50%). In addition, certain regulators require entities to discuss any prospective changes in organizational structure of which they are aware with the appropriate regulator, regardless of whether the controller/qualifying holder or the proposed controller/qualifying holder proposes to submit a change in control application. Breach of these requirements to notify various regulators of a decision to acquire or increase control/holding, or of the requirement to obtain approval before completing the relevant control/qualifying holding transaction may in some jurisdictions be a criminal offense attracting potentially unlimited fines. Regulators can also seek other remedies, including suspension of voting rights or having the purported acquisition annulled.
In particular, the Bermuda Monetary Authority (the “BMA”), which regulates Athene, Athora and Catalina, maintains supervision over the “controllers” of all registered insurers in Bermuda. For these purposes, a “controller” includes (1) the managing director of the registered insurer or its parent company, (2) the chief executive of the registered insurer or of its parent company, (3) a shareholder controller, and (4) any person in accordance with whose directions or instructions the directors of the registered insurer or its parent company are accustomed to act.
The definition of shareholder controller is set out in the Bermuda Insurance Act 1978 (the “Bermuda Insurance Act”) but generally refers to (1) a person who holds 10% or more of the shares carrying rights to vote at a shareholders’ meeting of the registered insurer or its parent company, (2) a person who is entitled to exercise 10% or more of the voting power at any shareholders’ meeting of such registered insurer or its parent company or (3) a person who is able to exercise significant
25
influence over the management of the registered insurer or its parent company by virtue of its shareholding or its entitlement to exercise, or control the exercise of, the voting power at any shareholders’ meeting.
Under the Bermuda Insurance Act, shareholder controller ownership is defined as follows:
| Actual Shareholder Controller Voting Power | Defined Shareholder Controller Voting Power | |||||||
| 10% or more but less than 20% | 10% | |||||||
| 20% or more but less than 33% | 20% | |||||||
| 33% or more but less than 50% | 33% | |||||||
| 50% or more | 50% | |||||||
Where the shares of a registered insurer, or the shares of its parent company, are traded on a recognized stock exchange, and such shareholder becomes a 10%, 20%, 33%, or 50% shareholder controller of the insurer, that shareholder shall, within 45 days, notify the BMA in writing that such shareholder has become, or as a result of a disposition ceased to be, a controller of any such category.
Any person or entity who contravenes the Bermuda Insurance Act by failing to give notice or knowingly becoming a controller of any description before the required 45 days has elapsed is guilty of an offense under Bermuda law and liable to a fine of $25,000 on summary conviction.
The BMA may file a notice of objection to any person or entity who has become a controller of any category when it appears that such person or entity is not, or is no longer, fit and proper to be a controller of the registered insurer. Before issuing a notice of objection, the BMA is required to serve upon the person or entity concerned a preliminary written notice stating the BMA’s intention to issue formal notice of objection. Upon receipt of the preliminary written notice, the person or entity served may, within 28 days, file written representations with the BMA which shall be taken into account by the BMA in making its final determination. Any person or entity who continues to be a controller of any description after having received a notice of objection is guilty of an offense and liable on summary conviction to a fine of $25,000 (and a continuing fine of $500 per day for each day that the offense is continuing) or, if convicted on indictment, to a fine of $100,000 and/or 2 years in prison.
The Bermuda Insurance Act regulates the insurance business of our Bermuda reinsurance subsidiaries, and provides that no person may carry on any insurance business in or from within Bermuda unless registered as an insurer under such act by the BMA. The BMA is required by the Bermuda Insurance Act to determine whether an applicant is a fit and proper body to be engaged in the insurance business and, in particular, whether it has, or has available to it, adequate knowledge and expertise to operate an insurance business. The continued registration of an insurer is subject to the insurer complying with the terms of its registration and such other conditions as the BMA may impose from time to time. The Bermuda Insurance Act also grants to the BMA powers to supervise, investigate and intervene in the affairs of insurers. The Bermuda Insurance Act imposes on Bermuda insurers solvency standards, as well as auditing and reporting requirements.
On December 8, 2022, the BMA issued a notice that it intends to make enhancements to Bermuda’s regulatory regime for insurers, and on February 24, 2023, the BMA issued a consultation paper on the enhancements it is considering. The consultation period is expected to continue for several months and possibly through the end of 2023. The enhancements are aimed at ensuring that the regime continues to remain fit for purpose, in line with international standards and keeps pace with market developments. In addition to potential enhancements to technical provisions and computation of the Bermuda Solvency Capital Requirement, the BMA is seeking to strengthen supervisory cooperation and exchange of information and increased publication of regulatory information to further develop good governance and risk management practices, transparency, and market discipline.
In the U.K., Apollo is considered the controller of certain insurance company (or equivalent) subsidiaries of Catalina Holdings (Bermuda) Ltd. (“Catalina”) and Aspen Insurance Holdings Limited (“Aspen”), including Catalina London Limited, Catalina Worthing Insurance Limited, AGF Insurance Limited, Aspen Insurance UK Limited (“Aspen U.K.”), which is domiciled in the United Kingdom and operates regulated branches in Australia, Canada, Singapore, Switzerland, and Aspen Managing Agency Limited, the Lloyd’s managing agent of Syndicate 4711, which has its underwriting capacity provided by Aspen’s subsidiary Aspen Underwriting Limited, a Lloyd’s corporate member. In addition, Catalina Services UK Limited and Aspen U.K. Syndicate Services Limited are also domiciled in the United Kingdom and provide insurance distribution services for purposes of certain U.K. insurance regulations.
26
In Ireland, Apollo is deemed to hold an indirect qualifying holding in each of Catalina Insurance Ireland DAC, which is Catalina’s wholly-owned Irish subsidiary insurance undertaking (e.g., insurance company), and Athora Ireland plc, which is a direct wholly-owned subsidiary of Athora Life Re Ltd. An indirect qualifying holding in Athora Ireland Services Limited, a wholly owned subsidiary of Athora, is also attributed to Apollo via Apollo’s indirect interest in Athora.
Apollo is deemed to hold an indirect qualifying holding in Athora Deutschland Verwaltungs GmbH, Athora Deutschland Holding GmbH & Co. KG, Athora Deutschland GmbH, Athora Lebensversicherung AG and Athora Pensionskasse AG, which are either German regulated insurance undertakings or German insurance holding companies.
Apollo is deemed to hold an indirect qualifying holding in Athora Belgium S.A./N.V. (“Athora Belgium”), which is a Belgian licensed insurance and reinsurance undertaking. In addition, some of Athora Belgium’s subsidiaries are registered with the Belgian regulator as insurance brokers and are subject to supervision by the Belgian regulator as regards their insurance distribution activities.
Apollo is deemed to hold an indirect qualifying holding in Athora Netherlands N.V. (formerly known as: VIVAT N.V.), Proteq Levensverzekeringen N.V., and SRLEV N.V., which are either Dutch regulated insurance undertakings or a Dutch insurance holding company, and Zwitserleven PPI N.V., which is a Dutch premium pension institution.
Apollo holds an indirect stake in Challenger Life Company Limited which is an Australian regulated life insurance company and a wholly owned subsidiary of Challenger Limited, an Australian listed company. Challenger Limited also has certain regulated subsidiaries outside of Australia.
Aspen also carries on insurance business through its Singapore Lloyd’s service company. Additionally, Catalina carries on insurance business through its Singapore-domiciled subsidiary Asia Capital Reinsurance Group Pte. Ltd., which in turn operates through its subsidiaries in Malaysia and through its branch office in Hong Kong.
Regulation of an Insurance Group
Many insurers, including certain of our subsidiaries, operate within a group structure with two or more affiliated persons, one or more of which is an insurer. U.S. state and international regulators have developed group supervisory frameworks in order to provide regulators with the ability to scrutinize the activities of an insurance group and assess its potential impact on individual insurers within the group.
A group supervisor may perform a number of supervisory functions, including: (1) coordinating the gathering and dissemination of relevant or essential information in both the ordinary course and emergency situations, including the dissemination of information that is of importance for the supervisory activities of other competent authorities; (2) carrying out supervisory reviews and assessments of the insurance group; (3) carrying out assessments of the insurance group’s compliance with the rules on solvency, risk concentration, intra-group transactions and good governance procedures; (4) planning and coordinating supervisory activities in respect of the insurance group, in both the ordinary course and in emergency situations through regular meetings held at least annually (or by other appropriate means) with other competent authorities; (5) coordinating enforcement actions that may need to be taken against the insurance group or any of its members; and (6) planning and coordinating meetings of colleges of supervisors (consisting of insurance regulators) in order to facilitate the carrying out of the functions described above.
The group supervisor may impose certain requirements on the insurance group, including to make provision for, among other things: (1) assessing the financial situation and the solvency position of the insurance group and/or its members and (2) regulating intra-group transactions, risk concentration, governance procedures, risk management and regulatory reporting and disclosure. Many of these requirements are still being developed in regulatory frameworks and have not yet been applied in substance to us or our affiliates or, to the extent they have been applied, remain subject to modification as part of larger prudential regulatory initiatives.
Government agencies and insurance standard setters in the U.S. and worldwide have become increasingly interested in potential risks posed by the insurance industry as a whole, and to commercial and financial activities and systems in general, as indicated by the development of the Common Framework for the Supervision of Internationally Active Insurance Groups (“ComFrame”), as adopted by the International Association of Insurance Supervisors (“IAIS”). ComFrame is applicable to entities that meet the IAIS’ criteria for internationally active insurance groups (“IAIGs”) and that are so designated by their group-wide supervisor
27
and includes a group capital requirement in addition to the current legal entity capital requirements and any group capital requirements imposed by relevant insurance laws and regulations. We expect that we and/or one or more of our affiliates will be designated as an IAIG in 2023 and look forward to working constructively with our regulators to enhance the regulatory framework applied globally to, among others, companies that assist clients in planning and implementing solutions for their retirement.
Capital Requirements
Each of our insurance and reinsurance subsidiaries is subject to regulatory capital requirements based upon the laws and regulations of its jurisdiction of incorporation. Regulators of each jurisdiction in which we operate have discretionary authority in connection with our insurance and reinsurance subsidiaries’ continued licensing to limit or prohibit sales to policyholders within their respective jurisdiction or to restrict continued operation of insurers or reinsurers domiciled in their respective jurisdiction if, in their judgment, such entities have not maintained the required level of minimum surplus or capital or that the further transaction of business would be hazardous to policyholders or reinsurance counterparties.
Restrictions on Dividends and Other Distributions
Our U.S. insurance subsidiaries are also subject to restrictions on the payment of dividends. Any proposed dividend in excess of the amount permitted by law is considered an extraordinary dividend or extraordinary distribution and may not be paid until it has been approved, or a 30-day waiting period has passed during which it has not been disapproved, by the Commissioner. In addition, entities that are regulated insurers are strictly prohibited from declaring or paying any dividends unless certain financial conditions are met or prior approval from the BMA is received.
Consumer Protection Laws and Privacy and Data Security Regulation
Federal and state consumer protection laws affect our operations. As part of the Dodd-Frank Act, Congress established the Consumer Financial Protection Bureau to supervise and regulate institutions that provide certain financial products and services to consumers. In addition, the Gramm-Leach-Bliley Act of 1999 implemented fundamental changes in the regulation of the financial services industry in the United States and includes privacy requirements for financial institutions, including obligations to protect and safeguard consumers’ nonpublic personal information and records, and limitations on the re-disclosure and re-use of such information.
In addition to federal and other financial institution-specific privacy laws and regulations, an increasing number of states are considering and passing comprehensive privacy legislation. The issues surrounding data security and the safeguarding of consumers’ protected information are under increasing regulatory scrutiny by state and federal regulators, particularly in light of the number and severity of recent U.S. companies’ data breaches.
Regulated Entities Outside of the U.S.
Certain of our subsidiaries and the funds that we manage that operate in jurisdictions outside of the United States are licensed by or have obtained authorizations to operate in their respective jurisdictions outside of the United States, and as a result are regulated by various international regulators and subject to applicable regulation. These registrations, licenses or authorizations relate to providing investment advice, discretionary investment management, arranging deals, marketing securities, capital markets activities and other regulated activities. Failure to comply with the laws and regulations governing these subsidiaries that have been registered, licensed or authorized could expose us to liability and/or damage our reputation.
Outside of the U.S., our subsidiaries and the funds that we manage, including Apollo Management International LLP, Apollo Credit Management International Limited, Apollo Europe Limited, Mirabella Malta Advisers Limited, Apollo Asset Management Europe LLP, Apollo Asset Management Europe PC LLP, Apollo Investment Management Europe LLP, Apollo Investment Management Europe (Luxembourg) S.à r.l., Apollo Capital Solutions Europe B.V., Apollo Advisors (Mauritius) Ltd, AION Capital Management Limited, Apollo Management Singapore Pte. Ltd., Apollo Management Singapore Pte. Ltd., Apollo Management Asia Pacific Limited, Apollo Management Japan Limited, PK AirFinance Japan Godo Kaisha and PK AIR 1 JPN Godo Kaisha, are subject to regulation in the European Union, the United Kingdom, Luxembourg, the Netherlands, Malta, India, Mauritius, Singapore, Australia, Hong Kong and Japan.
Other Regulatory Considerations. Certain of our businesses are subject to compliance with laws and regulations of U.S. federal and state governments, non-U.S. governments, their respective agencies and/or various self-regulatory organizations or
28
exchanges relating to, among other things, the privacy of client information, and any failure to comply with these regulations could expose us to liability and/or reputational damage.
Rigorous legal and compliance analysis of our businesses and investments is important to our culture. We strive to maintain a culture of compliance through the use of policies and procedures, such as our code of ethics, compliance systems, communication of compliance guidance and employee education and training. We have a compliance group that monitors our compliance with the regulatory requirements to which we are subject and manages our compliance policies and procedures. Our Chief Compliance Officer supervises our compliance group, which is responsible for addressing all regulatory and compliance matters that affect our activities. Our compliance policies and procedures address a variety of regulatory and compliance risks such as the handling of material non-public information, personal securities trading, anti-bribery, anti-money laundering (including know-your-customer controls), valuation of investments on a fund-specific basis, document retention, potential conflicts of interest and the allocation of investment opportunities.
We generally operate without information barriers between our asset management businesses. In an effort to manage possible risks resulting from our decision not to implement these barriers, our compliance personnel maintain a list of issuers for which we have access to material, non-public information and whose securities our funds and investment professionals are not permitted to trade. We could in the future decide that it is advisable to establish information barriers, particularly as our business expands and diversifies. In such event our ability to operate as an integrated platform will be restricted.
Available Information
Our Annual Reports on Form 10-K, Quarterly Reports on Form 10-Q, Current Reports on Form 8-K and amendments to reports filed or furnished pursuant to Section 13(a) of the Exchange Act are made available free of charge on or through our website at www.apollo.com as soon as reasonably practicable after such reports are filed with, or furnished to, the SEC. The information on our website is not, and shall not be deemed to be, part of this report or incorporated into any other filings we make with the SEC. The reports and the other documents we file with the SEC are available on the SEC’s website at www.sec.gov.
From time to time, we may use our website as a channel of distribution of material information. Financial and other material information regarding the Company is routinely posted on and accessible at www.apollo.com.
ITEM 1A. RISK FACTORS
The following risk factors and other information included in this Annual Report on Form 10-K should be carefully considered. The occurrence of any of the following risks or of unknown risks and uncertainties may adversely affect our business, financial condition, results of operations and cash flows. As used herein, references to our “asset management business” refer to the historical Apollo business, whereas references to our “retirement services business” refer to the historical Athene business.
Macroeconomic Risks
Difficult political, market or economic conditions may adversely affect our businesses in many ways which could materially reduce our revenue, net income and cash flow and adversely affect our financial prospects and condition.
Our businesses are materially affected by conditions in the political environment and financial markets and economic conditions throughout the world, such as changes in interest rates, availability of credit, inflation rates, economic uncertainty, changes in laws (including laws relating to taxation), governmental policy and regulatory reform, changes in trade policy, tariffs and trade sanctions on goods, trade wars, the planned discontinuation of LIBOR, U.S.-China relations, the withdrawal of the U.K. from the EU single market and customs union, imposition or maintenance of trade barriers, labor shortages, supply chain disruptions, economic, political, fiscal and/or other developments in or affecting Eurozone countries, commodity prices, currency exchange rates and controls, wars, other national and international political circumstances (including terrorist acts or security operations), natural disasters, climate change, pandemics or other severe public health crises and other events outside of our control.
Both domestic and international markets experienced significant inflationary pressures in fiscal year 2022 and inflation rates in the U.S., as well as in other countries in which we operate, are currently expected to continue at elevated levels for the near term. In addition, the Federal Reserve in the U.S. and central banks in various other countries have raised, and may again raise interest rates in response to concerns about inflation, which, coupled with reduced government spending and volatility in financial markets, may have the effect of further increasing economic uncertainty and heightening these risks. Interest rate
29
increases or other government actions taken to reduce inflation could also result in recessionary pressures in many parts of the world. Interest rate risk poses a significant market risk to us as a result of interest rate-sensitive assets (e.g., fixed income assets) and liabilities (e.g., fixed deferred and immediate annuities) held by us and by the portfolio companies of the funds we manage. Certain portfolio companies of the funds we manage may also be impacted by inflation. If such portfolio companies are unable to pass any increases in their costs along to their customers, it could adversely affect their results and their ability to pay interest and principal on their loans, particularly if interest rates rise further in response to inflation. In addition, any projected future decreases in such portfolio companies’ operating results due to inflation could adversely impact the fair value of those investments. Any decreases in the fair value of our and our funds’ investments could result in future unrealized losses and therefore reduce our net assets resulting from operations.
The Russian invasion of Ukraine has also increased global economic and political uncertainty. Furthermore, governments in the U.S., U.K., and EU have each imposed export controls on certain products and financial and economic sanctions on certain industry sectors and parties in Russia, and additional controls and sanctions could be enacted in the future. We are continuing to actively monitor the situation in Russia and Ukraine and assess its impact on our business and the business and operations of the portfolio companies of the funds we manage (particularly the impact on portfolio companies that operate in industries such as chemicals, oil and gas and aviation). We have no significant exposure to Russia or Ukraine and as such, to date, the conflict has not had a material impact on our business, financial condition or results of operations. However, it is possible that the conflict in Ukraine may escalate or expand, and the scope, extent and duration of the military action, current or future sanctions and resulting market and geopolitical disruptions could be significant. The acceleration of a global energy crisis, including as a result of restrictions on Russia's energy exports could similarly have an adverse impact on certain of the geographies where we do business and certain business and operations of the portfolio companies of the funds we manage. We cannot predict the impact the conflict may have on the global economy or our business, financial condition and operations in the future. The Russia and Ukraine conflict may also heighten the impact of other risks described herein.
Additionally, investing in securities of issuers organized or based outside the U.S. and operating outside the U.S. may also expose us to increased compliance risks, as well as higher compliance costs to comply with U.S. and non-U.S. anti-corruption, anti-money laundering and sanctions laws and regulations. These factors are outside our control and may affect the level and volatility of securities prices and the liquidity and the value of investments, and we may not be able to or may choose not to manage our exposure to these conditions.
Volatility caused by political, market or economic conditions can materially hinder the initiation of new, large-sized transactions for funds in our asset management business and, together with volatility in valuations of equity and debt securities, may adversely impact our operating results. It may also increase the risk that cash flows generated from our operations or the collateral underlying the structured products we own may differ from our expectations in timing or amount. In addition, many of our classes of investments, but in particular our alternative investments, may produce investment income that fluctuates significantly from period to period. Any event reducing the estimated fair value of these securities, other than on a temporary basis, could have a material and adverse effect on our business, results of operations, financial condition, liquidity and cash flows. Volatility and general economic trends are also likely to impact the performance of portfolio companies in many industries, particularly industries that are more affected by changes in consumer demand, such as the packaging, manufacturing, chemical and refining industries, as well as the travel and leisure, gaming and real estate industries. Our performance, and the performance of the funds we manage, may be adversely affected to the extent portfolio companies in these industries experience adverse performance or additional pressure due to downward trends. There is also a risk of both sector-specific and broad-based corrections and/or downturns in the equity and/or credit markets. Our profitability may also be adversely affected by our fixed costs and the possibility that we would be unable to scale back other costs, within a time frame sufficient to match any further decreases in net income or increases in net losses relating to changes in market and economic conditions.
Moreover, our retirement services business is materially affected by conditions in the capital markets and the U.S. economy generally, as well as by the global economy. Actual or perceived stressed conditions, volatility and disruptions in financial asset classes or various capital and credit markets can have an adverse effect on our retirement services business, both because such conditions may decrease the returns on, and value of, its investment portfolio and because its benefit and claim liabilities are sensitive to changing market factors. In times of economic hardship, the policyholders of our retirement services business may choose to defer paying insurance premiums, stop paying insurance premiums altogether or surrender their policies. In addition, actual or perceived difficult conditions in the capital markets may discourage individuals from making investment decisions and purchasing our retirement services products.
30
We are subject to risks associated with public health crises, such as pandemics and epidemics, including the COVID-19 pandemic which has caused severe disruptions in the U.S. and global economy and could continue to impact our business, financial condition and results of operations.
We are subject to risks associated with public health crises, such as pandemics and epidemics, including the COVID-19 pandemic. The COVID-19 pandemic and the responses to the pandemic have adversely impacted global commercial activity and contributed to significant volatility in financial markets. It is uncertain how long this volatility in the financial markets created by the COVID-19 pandemic will continue. While many countries around the world have removed or reduced the restrictions taken in response to the COVID-19 pandemic, the emergence of new variants of the SARS-CoV-2 virus may result in new governmental lockdowns, quarantine requirements or other restrictions to slow the spread of the virus. The effects of the COVID-19 outbreak on the economy and the public have been severe and have exacerbated, and may continue to exacerbate, other pre-existing political, social, economic, market and financial risks.
The emergence of new variants of the SARS-CoV-2 virus and the extended duration of the COVID-19 pandemic could adversely affect our business in a number of ways, including by adversely impacting the valuations of the investments made by our asset management and retirement services businesses, which are generally correlated to the performance of the relevant equity and debt markets; increasing volatility in the financial markets; preventing us from capitalizing on certain market opportunities; causing prolonged asset price inflation and hampering our asset management business’ ability to deploy capital or to deploy capital as profitably; interrupting global or regional supply chains; hurting consumer confidence and economic activity; reducing opportunities for our asset management business to successfully exit existing investments; straining our liquidity, which may impact our credit ratings and limit the availability of future financing; impairing our asset management business’ equity investments and impacting the ability of the portfolio companies of our asset management business to meet their respective financial obligations and comply with existing covenants; increasing the rate at which policyholders of our insurance products withdraw their policies; and reducing our ability to understand and foresee trends and changes in the markets in which we operate.
The scope and duration of any future public health crisis, including the potential emergence of new variants of the SARS-CoV-2 virus, the pace at which government restrictions are imposed and lifted, the scope of additional actions taken to mitigate the spread of disease, global vaccination and booster rates, the speed and extent to which global markets fully recover from the disruptions caused by such a public health crisis, and the impact of these factors on our business, financial condition and results of operations, will depend on future developments that are highly uncertain and cannot be predicted with confidence.
Climate change and regulatory and other efforts to reduce climate change could adversely affect our business.
We and the portfolio companies of the funds we manage face a number of risks associated with climate change, including both transition and physical risks. The transition risks that could impact us and the investments of the funds we manage include those risks related to the impact of U.S. and foreign climate- and environmental, social and governance (“ESG”)-related legislation and regulation, as well as risks arising from climate-related business trends. Moreover, our investments, and the investments of the portfolio companies of the funds we manage, are subject to risks stemming from the physical impacts of climate change. In particular, climate change may impact asset prices and the value of investments linked to real estate. For example, rising sea levels may lead to decreases in real estate values in coastal areas. We and the funds we manage have significant concentrations of real estate investments and collateral underlying investments linked to real estate in areas of the United States prone to catastrophe, including California, sections of the northeastern U.S., the South Atlantic states and the Gulf Coast.
New climate change-related regulations or interpretations of existing laws may result in enhanced disclosure obligations that could negatively affect us or the investments of the portfolio companies of the funds we manage and also materially increase our regulatory burden. We also face business trend-related climate risks. Certain fund investors are increasingly taking into account ESG factors, including climate risks, in determining whether to invest in the funds we manage. Our reputation and investor relationships could be damaged as a result of our involvement, or the involvement of the funds we manage, in certain industries, portfolio companies or transactions associated with activities perceived to be causing or exacerbating climate change, as well as any decisions we make to continue to conduct or change our activities in response to considerations relating to climate change.
31
Operating Risks
A portion of our revenues, earnings and cash flow is highly variable, which may make it difficult for us to achieve steady earnings growth on a quarterly basis, which may cause the price of our shares to be volatile.
A portion of our revenues, earnings and cash flow is highly variable, primarily due to the fact that performance fees from our asset management business and the transaction, advisory and other fees that we receive, can vary significantly from quarter to quarter and year to year. In addition, the investment returns of most of the funds we manage are volatile. We may also experience fluctuations in our results from quarter to quarter and year to year due to a number of other factors, including changes in the values of investments of the funds we manage, changes in the amount of distributions, dividends or interest paid in respect of investments, changes in our operating expenses, policyholder behavior, the degree to which we encounter competition and general economic and market conditions. Our future results will also be significantly dependent on the success of the larger funds we manage (e.g., Fund VIII, Fund IX and Fund X), changes in the value of which may result in fluctuations in our results. In addition, performance fees from some of the funds we manage are subject to contingent repayment by the general partner if, upon the final distribution, the relevant fund’s general partner has received cumulative performance fees on individual portfolio investments in excess of the amount of performance fees it would be entitled to from the profits calculated for all portfolio investments in the aggregate. Such variability may lead to volatility in the trading price of our shares and cause our results for a particular period not to be indicative of our performance in a future period. It may be difficult for us to achieve steady growth in earnings and cash flow on a quarterly basis, which could in turn lead to large adverse movements in the price of our shares or increased volatility in the price of our shares in general.
The timing of performance fees generated by the funds we manage is uncertain and will contribute to the volatility of our results. Performance fees depend on the performance of the funds we manage. It takes a substantial period of time to identify attractive investment opportunities, to raise all the funds needed to make an investment and then to realize the cash value or other proceeds of an investment through a sale, public offering, recapitalization or other exit. Even if an investment proves to be profitable, it may be several years before any profits can be realized in cash or other proceeds. We cannot predict when, or if, any realization of investments will occur. Generally, if the funds we manage were to have a realization event in a particular quarter or year, it may have a significant impact on our results for that particular quarter or year that may not be replicated in subsequent periods. With respect to a number of credit funds, our performance fees are generally paid annually, semi-annually or quarterly, and the varying frequency of these payments will contribute to the volatility of our revenues and cash flow. Furthermore, we earn these performance fees only if the net asset value of a fund has increased or, in the case of certain funds, increased beyond a particular threshold, which is referred to as a “high water mark.” Such performance fees we earn are therefore dependent on the net asset value of investors’ investments in the fund, which could lead to significant volatility in our results.
We may not be successful in expanding into new investment strategies, markets and businesses, each of which may result in additional risks and uncertainties in our businesses.
We actively consider the opportunistic expansion of our businesses, both geographically and into new investment strategies, and intend, to the extent that market conditions warrant, to grow our businesses by increasing AUM in existing businesses and expanding into new investment strategies, geographic markets, businesses and distribution channels, including the retail channel. We intend to grow our business in the future in part by acquisitions and joint ventures, each of which could require additional cash and equity, systems development and skilled personnel. We may experience challenges identifying, financing, consummating and integrating such acquisitions and transactions. Our organizational documents do not limit us to the asset management and retirement services businesses. Accordingly, we may pursue growth through acquisitions of other investment management companies, acquisitions of critical business partners or other strategic initiatives, including entering into new lines of business.
We may not be successful in any such attempted expansion. Attempts to expand our businesses involve a number of special risks, including the diversion of management’s attention from our core businesses; the disruption of our ongoing businesses; entry into markets or businesses in which we may have limited or no experience; increasing demands on our operational systems and infrastructure; potential increase in investor concentration; enhanced regulatory scrutiny and greater reputational and litigation risk; difficulty in combining or integrating operational and management systems; and the broadening of our geographic footprint, increasing the risks associated with conducting operations in foreign jurisdictions (including regulatory, tax, legal and reputational consequences). Additionally, any expansion of our businesses could result in significant increases in our outstanding indebtedness and debt service requirements, which would increase the risks of investing in our shares, and may adversely impact our results of operations and financial condition.
32
We also may not be successful in identifying new investment strategies or geographic markets that increase our profitability, or in identifying and acquiring new businesses that increase our profitability. We have also entered into strategic partnerships, separately managed accounts and sub-advisory arrangements, which lack the scale of the funds we traditionally manage and are more costly to administer. The prevalence of these accounts may also present conflicts and introduce complexity in the deployment of capital.
Before expanding into new investment strategies, or making any fund investments generally, we conduct due diligence that we deem reasonable and appropriate based on the facts and circumstances applicable to each investment. When conducting due diligence, we may be required to evaluate important and complex issues, including but not limited to those related to business, financial, credit risk, tax, accounting, environmental, legal and regulatory and macroeconomic trends. The due diligence investigation that we will carry out may not reveal or highlight all relevant facts (including fraud) or risks that may be necessary or helpful in evaluating such investment opportunity, including past or current violations of law and related legal exposure, and we may not identify or foresee future developments that could have a material adverse effect on an investment (e.g., technological disruption across an industry).
We operate in highly competitive industries, which could limit our ability to achieve our growth strategies and could materially and adversely affect our businesses, financial condition, results of operations, cash flows and prospects.
We operate in highly competitive markets and compete with a large number of investment management firms, private equity, credit and real assets fund sponsors, U.S. and non-U.S. insurance and reinsurance companies, broker-dealers, financial advisors, asset managers and other financial institutions. In particular, our asset management business faces intense competition in the pursuit of outside investors for the funds we manage, and our retirement services business faces intense competition with respect to both the products it offers and the acquisition and block reinsurance transactions it pursues. These competitive pressures may have a material and adverse effect on our growth, business, financial condition, results of operations, cash flows and prospects.
We depend on certain key personnel and the loss of their services could have a material adverse effect on us.
The success of our businesses depends on the efforts, judgment, business relationships, personal reputations and continued service of our key personnel. The loss of the services of any of our key personnel or damage to their personal reputation could have a material adverse effect on our business. Accordingly, our retention of our key personnel and our success in recruiting additional personnel is crucial to our success. If our key personnel were to join or form a competitor, our business could similarly suffer a material adverse effect. For example, some of the investors in the funds we manage could choose to invest with that competitor, another competitor or not at all, rather than in the funds we manage. We do not carry any “key man” insurance that would provide us with proceeds in the event of the death or disability of any of our key personnel. We may also not succeed in recruiting additional personnel because the market for qualified professionals is extremely competitive. Efforts to retain or attract key personnel may result in significant additional expenses, which could adversely affect our profitability.
In addition, the governing agreements of certain of the funds we manage provide that in the event certain investment professionals and other key personnel fail to devote the requisite time to our businesses, the commitment period will terminate. In some instances, such termination becomes effective only if coupled with a certain percentage in interest of the fund investors or the respective fund advisory board not voting to continue the commitment period. In addition to having a significant negative impact on our revenue, net income and cash flow, the occurrence of such an event with respect to any of the funds we manage would likely result in significant reputational damage to us.
Misconduct by our current and former employees, directors, advisers, third party-service providers or others affiliated with us could harm us by impairing our ability to attract and retain investors and by subjecting us to significant legal liability, regulatory scrutiny and reputational harm.
There is a risk that our employees, directors, advisers, third party-service providers or others affiliated with us could engage, deliberately or recklessly, in misconduct or fraud that creates legal exposure for us and adversely affects our businesses. With respect to our retirement services business, our insurance businesses rely on third-party intermediaries to sell our products and services and we further rely on third-party administrators to administer a portion of our annuity contracts as well as legacy life insurance business. If anyone associated or affiliated with us, or the portfolio companies of the funds we manage, were to engage, or be accused of engaging in illegal or suspicious activities, sexual harassment, racial or gender discrimination, improper use or disclosure of confidential information, fraud, payment or solicitation of bribes, misrepresentation of products
33
and services or any other type of similar misconduct or violation of other laws and regulations, we could suffer serious harm to our brand, reputation, be subject to penalties or sanctions, face difficulties in raising funds, suffer serious harm to our financial position and current and future business relationships, as well as face potentially significant litigation or investigations.
Fraud, payment or solicitation of bribes and other deceptive practices or other misconduct at the portfolio companies of the funds we manage could similarly subject us to liability and reputational damage and also harm our performance. There are a number of grounds upon which such misconduct at a portfolio company could subject us to criminal and/or civil liability, including on the basis of actual knowledge, willful blindness, or control person liability.
We rely on technology and information systems, many of which are controlled by third-party vendors, to maintain the security of our information and technology networks and to conduct our businesses, and any failures or interruptions of these systems could adversely affect our businesses and results of operations.
We are subject to various risks and costs associated with the collection, handling, storage and transmission of personally identifiable information. In the ordinary course of our business, we collect and store a range of data, including our proprietary business information and intellectual property, and personally identifiable information of our employees, our investors, our retirement services business policyholders and other third parties, in our data centers and on our networks and we rely on technology and information systems to execute, confirm and settle transactions. We rely on a host of information systems and hardware systems for the secure processing, maintenance and transmission of this information, and the unavailability of these systems or the failure of these systems to perform as anticipated for any reason could disrupt our businesses and could result in decreased performance and increased operating costs, causing our businesses and results of operations to suffer.
Although we are not currently aware of any cyberattacks or other incidents that, individually or in the aggregate, have materially affected, or would reasonably be expected to materially affect, our operations or financial condition, there can be no assurance that the various procedures and controls we utilize to mitigate these threats will be sufficient to prevent disruptions to our systems, especially because the cyberattack techniques used change frequently and are not recognized until launched, the full scope of a cyberattack may not be realized until an investigation has been performed and cyberattacks can originate from a wide variety of sources. We rely on industry accepted security measures and technology to securely maintain confidential and proprietary information maintained on our information systems. Although we take protective measures and endeavor to strengthen our computer systems, software, technology assets and networks to prevent and address potential cyberattacks, there can be no assurance that any of these measures will prove effective. Furthermore, delays in the maintenance, updates, upgrading, or patching of our information systems could adversely impact their effectiveness or could expose us, as well as our clients and others who rely upon, or have exposure to, our systems, to security and other risks.
We are also dependent on an increasingly concentrated group of third-party vendors that we do not control for hosting the information systems and hardware systems that are critical to our businesses. We also rely on third-party service providers for certain aspects of our businesses, including for certain information systems, technology and administration of the funds we manage and compliance matters. A disaster, disruption or compromise in technology or infrastructure that supports our businesses, including a disruption involving electronic communications or other services used by us, our vendors or third parties with whom we conduct business, may have an adverse impact on our ability to continue to operate our businesses without interruption which could have a material adverse effect on us. These risks could increase as vendors increasingly offer cloud-based software services rather than software services that can be operated within our own data centers. These risks also increase to the extent we engage in operations outside the U.S. We also rely on data processing systems and the secure processing, storage and transmission of information, including payment and health information. A disruption or compromise of these systems could have a material adverse effect on our business. In addition, costs related to data security threats or disruptions may not be fully insured or indemnified by other means.
A significant actual or potential theft, loss, corruption, exposure, fraudulent, unauthorized or accidental use or misuse of investor, policyholder, employee or other personally identifiable or proprietary business data, whether by third parties or as a result of employee malfeasance or otherwise, non-compliance with our contractual or other legal obligations regarding such data or intellectual property or a violation of our privacy and security policies with respect to such data could result in significant remediation and other costs, fines, litigation and regulatory actions against us by the U.S. federal and state governments, the EU or other jurisdictions, various regulatory organizations or exchanges, or affected individuals, in addition to significant reputational harm.
34
Our business, financial condition, results of operations, liquidity and cash flows depend on the accuracy of our management’s assumptions and estimates, and we could experience significant gains or losses if these assumptions and estimates differ significantly from actual results.
We make and rely on certain assumptions and estimates regarding many matters related to our businesses, including valuations, interest rates, investment returns, expenses and operating costs, tax assets and liabilities, tax rates, business mix, surrender activity, mortality and contingent liabilities. We also use these assumptions and estimates to make decisions crucial to our business operations. We also use assumptions and estimates to make decisions about pricing, target returns and expense structures for our insurance subsidiaries’ products and pension group annuity transactions; determining the amount of reserves our retirement services business is required to hold for its policy liabilities; determining the price our retirement services business will pay to acquire or reinsure business; determining the hedging strategies we employ to manage risks to our business and operations; and determining the amount of regulatory and rating agency capital that our insurance subsidiaries must hold to support their businesses. Similarly, our management teams make similar assumptions and estimates in planning and measuring the performance of our asset management business. In addition, certain investments and other assets and liabilities of our asset management business and our retirement services business must be, or at our election are, measured at fair value the determination of which involves the use of various assumptions and estimates and considerable judgment. The factors influencing these various assumptions and estimates cannot be calculated or predicted with certainty, and if our assumptions and estimates differ significantly from actual outcomes and results, our business, financial condition, results of operations, liquidity and cash flows may be materially and adversely affected.
Many of the funds we manage invest in illiquid assets and many of the investments of our retirement services business are relatively illiquid and we may fail to realize profits from these assets for a considerable period of time, or lose some or all of the principal amount we invest in these assets if we are required to sell our invested assets at a loss at inopportune times or in response to changes in applicable rules and regulations.
Many of the funds we manage invest in securities or other financial instruments that are not publicly traded or are otherwise viewed as “illiquid.” In many cases, the funds we manage may be prohibited by contract or by applicable securities laws from selling such securities for a period of time. The ability of many funds, particularly the private equity funds, to dispose of investments is heavily dependent on the public equity markets. Furthermore, large holdings even of publicly traded securities can often be disposed of only over a substantial period of time, exposing the investment returns to risks of downward movement in market prices during the disposition period. Accordingly, the funds we manage may be forced, under certain conditions, to sell securities at a loss.
In addition, many investments by our retirement services business are in securities that are not publicly traded or that otherwise lack liquidity, such as its privately placed fixed maturity securities, below investment grade securities, investments in mortgage loans and alternative investments. These relatively illiquid types of investments are recorded at fair value. If a material liquidity demand is triggered and we are unable to satisfy the demand with the sources of liquidity available to us, our retirement services business could be forced to sell certain of its assets and there can be no assurance that it would be able to sell them for the values at which such assets are recorded and it might be forced to sell them at significantly lower prices. In many cases, our retirement services business may also be prohibited by contract or applicable securities laws from selling such securities for a period of time. Thus, it may be impossible or costly to liquidate positions rapidly in order to meet unexpected withdrawal or recapture obligations. This potential mismatch between the liquidity of assets and liabilities could have a material and adverse effect on our business, financial condition, results of operations and cash flows.
Further, governmental and regulatory authorities periodically review legislative and regulatory initiatives, and may promulgate new or revised, or adopt changes in the interpretation and enforcement of existing, rules and regulations at any time that may impact our investments. For example, Rule 15c2-11 under the Exchange Act governs the submission of quotes into quotation systems by broker-dealers and has historically been applied to the over-the-counter equity markets. However, the SEC recently stated that it intends to apply the rule to fixed income markets, potentially restricting the ability of market participants to publish quotations for applicable fixed income securities after January 4, 2025. Such changes in regulatory requirements could disrupt market liquidity, make it more difficult for us to source and invest in attractive private investments, and cause securities that are not publicly traded to lose value, any of which could have a material and adverse effect on our business, financial condition or results of operations.
35
We rely on the debt financing markets for the operation of our business.
We rely on the debt financing markets for the operation of our business. To the extent that markets render debt financing difficult to obtain, refinance or extend, or more expensive, this may have a material and adverse effect on our business, financial condition, results of operations, liquidity and cash flows.
Many of the funds we manage utilize subscription lines of credit to fund operations and investments, including their equity contributions in a portfolio company. Some of these are also intended as a source of longer-term borrowings for investments by the relevant funds. In other cases, some funds make investments through the use of net asset value-based fund finance facilities or similar financing arrangements, margin loans or other derivative financing arrangements that are backed by the fund’s investment portfolio. The interest expense and other costs incurred in connection with such indebtedness may not be recovered by appreciation in the assets purchased or carried, and will be lost, and the timing and magnitude of such losses may be accelerated or exacerbated in the event of a decline in the market value of such assets. Gains realized with borrowed funds may cause the fund’s net asset value to increase at a faster rate than would be the case without borrowings. However, if investment results fail to cover the cost of borrowings, the fund’s net asset value could also decrease faster than if there had been no borrowings. The inability to obtain such financing on attractive terms may impact the ability of the funds we manage to achieve targeted rates of return.
Additionally, certain investments by the funds we manage rely heavily on the use of leverage. For example, in many of the private equity fund investments, indebtedness may constitute 70% or more of a portfolio company’s total debt and equity capitalization. The absence of available sources of senior debt financing for extended periods of time could materially and adversely affect the funds we manage. In the event that funds we manage are unable to obtain committed debt financing for potential investments, including acquisitions, or can only obtain debt at an increased interest rate or otherwise on unfavorable terms, such funds may have difficulty completing otherwise profitable investments or may generate profits that are lower than would otherwise be the case, either of which could lead to a decrease in the investment income earned by us. Any failure by lenders to provide previously committed financing can also expose us to potential claims by counterparties with which funds we manage have contracted to effectuate an investment transaction (i.e., sellers of businesses that funds we manage may have contracted to purchase). In addition, to the extent that the current markets make it difficult or impossible for a portfolio company to refinance debt that is maturing in the near term, it may face substantial doubt as to its status as a going concern (which may result in an event of default under various agreements) or it may be unable to repay such debt at maturity and be forced to sell assets, undergo a recapitalization or seek bankruptcy protection. Furthermore, investments in highly leveraged entities are inherently more sensitive to declines in revenues, increases in expenses and interest rates and adverse economic, market and industry developments. As a result, the risk of loss associated with a leveraged entity is generally greater than for companies with comparatively less debt.
In addition, our retirement services business relies on access to lending and debt markets to provide capital and liquidity. Changes in debt financing markets may impact our retirement services business’ access to capital and liquidity. Calculations of required insurance capital may move with market movements and result in greater capital needs during economic downturns. Our retirement services business may also need additional liquidity to pay insurance liabilities in excess of its assumptions due to market impacts on policyholder behavior.
Changes to the method of determining the LIBOR or the selection of a replacement for LIBOR may affect the value of investments held by or due to us or the funds we manage and could affect our results of operations and financial results.
As a result of the expected discontinuation of certain unsecured benchmark interest rates, including LIBOR and other Interbank Offered Rates (“IBORs”), regulators and market participants in various jurisdictions have been working to identify alternative reference rates that are compliant with the International Organization of Securities Commission’s standards for transaction-based benchmarks. In the U.S., the Alternative Reference Rates Committee, a group of market and official sector participants, identified the Secured Overnight Financing Rate (“SOFR”) as its recommended alternative benchmark rate. Other alternative reference rates have been recommended in other jurisdictions.
A large number of IBOR-referenced contracts are held by or due to us or funds we manage. Furthermore, a significant number of portfolio companies of the funds we manage are borrowers of LIBOR-linked debt obligations, such as LIBOR-based credit agreements and floating rate notes. Transition from LIBOR to SOFR or to another reference rate may result in an increase or a decrease of the overall borrowing cost for us (including our retirement services business), the funds we manage and their portfolio companies. Even if the overall borrowing cost decreases, any savings that we or the funds we manage realize from such decrease could be offset partially or entirely by lower overall interest income received from certain assets. In addition, the
36
transition from LIBOR to another reference rate could result in financial market disruption and significant increases or volatility in risk-free benchmark rates. Should such disruption occur, it may adversely affect, among other things, (1) the trading market for LIBOR-based securities, including those held in our investment portfolio and (2) the market for derivative instruments, including those that we use to achieve our hedging objectives. The most significant LIBOR exposure area for our retirement services business as it relates to legacy contracts is its portfolio of floating rate investments tied to LIBOR. As a result, the transition from LIBOR could have a direct or indirect adverse effect on our business, results of operations, financial condition, and share price.
Risks Relating to Our Asset Management Business
We may experience a decline in revenue from our asset management business.
In our asset management business, we derive revenues from:
•capital committed to the funds, invested by the funds, or the net asset value of the funds;
•management fees, which are based generally on the amount of capital committed or invested in the funds we manage;
•in connection with services relating to investments by the funds we manage, fees earned or otherwise collected by one or more service providers affiliated with us;
•performance fees, based on the performance of the funds we manage; and
•investment income from our investments, including as general partner.
If a fund we manage performs poorly, we will receive little or no performance fees with regard to the fund and little income or possibly losses from any principal investment in the fund. Furthermore, if, as a result of poor performance of later investments in a fund’s life, the fund does not achieve total investment returns that exceed a specified investment return threshold for the life of the fund, we could be obligated to repay the amount by which performance fees that were previously distributed to us exceeds amounts to which we are ultimately entitled. Several of the funds we manage may go into clawback. There can be no assurance that we will not incur a clawback repayment obligation in the future.
A variety of fees that we earn, such as origination, syndication, arranger, placement, sourcing, structuring and other similar financing-related fees, are driven in part by the pace at which the funds we manage commit to make or make investments. Any decline in the pace at which the funds we manage make investments would reduce our origination, syndication, arranger, structuring and other similar financing-related fees and could make it more difficult for us to raise capital. Likewise, any increase in the pace at which the funds we manage exit investments would reduce origination, syndication, arranger, structuring and other similar financing-related fees. In addition, we will experience a decrease in the amount of fee revenue if we share with fund investors a larger portion, or all, of certain types of fees generated by funds’ investments, such as management consulting fees and merger and acquisition transaction advisory fees, or if expenses arising from the operation of the funds we manage are borne by us alone, rather than the funds.
Additionally, certain of our subsidiaries perform underwriting, syndicating and securities placement services for the funds we manage and their portfolio companies, as well as for investments made by our retirement services business and for third parties. Our ability to maintain or grow these services, and the related fees we earn therefrom, depends on a number of factors, some of which are outside our control.
The Former Managing Partners, Contributing Partners and certain current and former investment professionals have personally guaranteed, subject to certain limitations, general partner clawback obligations, and we have agreed to indemnify them for such amounts attributed to interests they previously contributed or sold to the Apollo Operating Group.
In each instance, a decrease in the fees we receive from the funds we manage and other operating activities, will lead to a decrease in our revenues and may have a materially adverse impact on our business and results of operations.
We depend on investors in the funds we manage for the continued success of our asset management business.
It could become increasingly difficult for the funds we manage to raise capital as funds compete for investments from a limited number of qualified investors. Without the participation of investors, the funds we manage will not be successful in consummating their capital-raising efforts, or they may consummate them at investment levels lower than those currently anticipated.
37
Certain institutional investors have publicly criticized compensation arrangements, including management, transaction and advisory fees. Although we have no obligation to modify any fees or other terms with respect to the funds we manage, we experience pressure to do so. In addition, certain institutional investors, including sovereign wealth funds and public pension funds, continue to demonstrate an increased preference for alternatives to the traditional investment fund structure, such as managed accounts, specialized funds and co-investment vehicles. Even though we have entered into such strategic arrangements, there can be no assurance that such alternatives will be as profitable to us as traditional investment fund structures. While we have historically competed primarily on the performance of the funds we manage, and not on the level of our management fees or performance fees relative to those of our competitors, there is a risk that management fees and performance fees in the alternative investment management industry will decline, without regard to the historical performance of a manager. Management fee or performance fee reductions on existing or future funds, without corresponding decreases in our cost structure even if other revenue streams increase, would adversely affect our revenues and profitability.
The failure of the funds we manage to raise capital in sufficient amounts and on satisfactory terms could result in a decrease in AUM, performance fees and/or fee revenue or could result in us being unable to achieve an increase in AUM, performance fees and/or fee revenue, and could have a material adverse effect on our financial condition and results of operations. Similarly, any modification of our existing fee arrangements or the fee structures for new funds could adversely affect our results of operations.
We continue to depend on investors in the funds we manage even after the capital-raising phase of any fund. Investors in many of the funds we manage make capital commitments to those funds that we are entitled to call from those investors at any time during prescribed periods. If investors were to fail to satisfy a significant amount of capital calls for any particular fund or funds, the operation and performance of those funds could be materially and adversely affected. Additionally, the governing documents of substantially all of the funds we manage in which there are third party investors provide that a simple majority-in-interest of a fund’s unaffiliated investors have the right to liquidate that fund for any or no reason, which would cause management fees and performance fees to terminate. We do not know whether, and under what circumstances, the investors in the funds we manage are likely to exercise such right. Furthermore, the management agreements of the funds we manage would also terminate if we were to experience a change of control without obtaining fund investor consent. We cannot be certain that consents required for the assignment of our management agreements will be obtained if such a deemed change of control occurs.
The governing agreements of certain of the funds we manage allow the investors of those funds to, among other things, (i) terminate the commitment period of the fund in the event that certain “key persons” fail to devote the requisite time to managing the fund, (ii) (depending on the fund) terminate the commitment period, dissolve the fund or remove the general partner if we, as general partner or manager, or certain “key persons” engage in certain forms of misconduct, (iii) dissolve the fund or terminate the commitment period upon the affirmative vote of a specified percentage of limited partner interests entitled to vote, or (iv) dissolve the fund or terminate the commitment period upon a change of control. In addition to having a significant negative impact on our revenue, net income and cash flow, the occurrence of such an event with respect to any of the funds we manage would likely result in significant reputational damage to us.
Investors in some of the funds we manage may also at times redeem their investments on an annual, semiannual or quarterly basis following the expiration of a specified period of time when capital may not be redeemed (typically between one and five years). In a declining market, the pace of redemptions and consequent reduction in our AUM could accelerate. The decrease in revenues that would result from significant redemptions in these funds could have a material adverse effect on our businesses, revenues, net income and cash flows.
Certain investors have placed increasing importance on the impact of investments made by the funds to which they commit capital on ESG-related issues. Consequently, the investors may decide not to commit capital in fundraises, or to withdraw previously committed capital from the funds we manage, based on their evolving ESG priorities. Certain investors may also condition capital commitments on ESG and similar matters in a way that may constrain our capital deployment opportunities, including by limiting investment opportunities in certain sectors, or taking certain actions, or refraining therefrom, that could adversely impact the value of an investment or that could improve the value of an investment. In addition, regulatory initiatives requiring asset managers and investors to classify certain funds and their investments against certain criteria are becoming increasingly common. Some categorization requirements may be subjective and, accordingly, open to interpretation. If regulators disagree with the categorization methodologies we use, or new regulations, legislation, or regulatory guidance require a methodology of measuring or disclosing ESG impact that is different from our current practice, it could have an adverse effect on fundraising efforts. Given the increasing scrutiny on ESG matters as well as the increasing number of regulatory obligations relating to our business, the funds we manage, and their investments, there is an increasing risk that we
38
could be perceived as or accused of making inaccurate or misleading statements regarding the investment strategies of the funds we manage, as well as about our, the funds’, and their investments’ performance against ESG-related measures and/or ESG initiatives. Any such perception or accusation could adversely impact our ability to raise capital and attract new investors.
Historical performance metrics are unreliable indicators of our current or future results of operations.
We have presented returns relating to the historical performance of the funds we manage and certain targets of our future performance, including by reference to the internal rate of return (“IRR”) of certain funds’ performance using a gross IRR and a net IRR calculation. The returns are relevant to us primarily insofar as they are indicative of performance fees we have earned in the past and may earn in the future, our reputation and our ability to raise new funds. The returns of the funds we manage are not, however, directly linked to returns on our shares of common stock. Moreover, the historical returns of the funds we manage should not be considered indicative of the future returns of such funds or any future funds we may raise. Performance metrics, such as IRR, going forward for any current or future fund may vary considerably from the historical performance generated by any particular fund, or for the funds we manage as a whole.
Valuations for the funds we manage entail significant complications and are not an indicator for actual realizations.
We value the illiquid investments held by the funds we manage based on our estimate of their fair value as of the date of determination based on third-party models, or models developed by us. In addition, because many of the illiquid investments held by the funds we manage are in industries or sectors that are unstable, in distress, or undergoing some uncertainty, such investments are subject to rapid changes in value caused by sudden company-specific or industry-wide developments. We also include the fair value of illiquid assets in the calculations of net asset values, returns of the funds we manage and our AUM. Furthermore, we recognize performance fees based in part on these estimated fair values. Because these valuations are inherently uncertain, they may fluctuate greatly from period to period. Also, they may vary greatly from the prices that would be obtained if the assets were to be liquidated on the date of the valuation and often do vary greatly from the prices the funds we manage eventually realize.
If a fund realizes value on an investment that is significantly lower than the value at which it was reflected in a fund’s net asset values, the fund would suffer losses. This could in turn lead to a decline in our management fees and a loss equal to the portion of the performance fees reported in prior periods that was not actually realized upon disposition, and could slow the pace and reduce the likelihood that we earn carried interest. These effects could become applicable to a large number of investments by the funds we manage if the funds’ current valuations differ from future valuations due to market developments or other factors that are beyond our control. If asset values turn out to be materially different than values reflected in fund net asset values, fund investors could lose confidence which could, in turn, result in redemptions from the funds we manage that permit redemptions or difficulties in raising additional capital.
Investments made by the funds we manage entail significant risks and uncertainties.
We invest in a number of industries, products, geographical locations and strategies that entail significant risks and uncertainties, which may, if realized, have a material adverse effect on our business and results of operations. For example:
•The funds we manage often invest in companies with weak financial conditions, poor operating results, substantial financial needs, negative net worth and/or special competitive or regulatory problems, including in business enterprises that are or may become involved in work-outs, liquidations, spin-offs, reorganizations, bankruptcies and similar transactions.
•Investments by many of the funds we manage include debt instruments, equity securities, and other financial instruments of companies that the funds we manage do not control. Those investments will be subject to the risk that the company in which the investment is made may make business, financial or management decisions with which we do not agree or that the majority stakeholders or the management of the company may take risks or otherwise act in a manner that does not serve the interests of the funds we manage.
•We generally establish the capital structure of portfolio companies and certain other fund investments, including real estate investments, on the basis of financial projections for such investments that are based primarily on management judgments.
•The funds we manage acquire and dispose of investments that are subject to contingent liabilities, which could be unknown to us at the time of the transaction or, if they are known to us, we may not accurately assess or protect against the risks that they present, and could in each case result in unforeseen losses for the funds we manage.
39
•A significant portion or all of a fund’s capital may be invested in a single investment or portfolio company and a loss with respect to such an investment or portfolio company could have a significant adverse impact on such fund’s capital.
•Even though there is uncertainty of the future of IBOR based agreements, a large number of IBOR-referenced contracts are held by or due to us or the funds we manage. Furthermore, a significant number of portfolio companies of the funds we manage are borrowers of LIBOR-linked debt obligations, such as LIBOR-based credit agreements and floating rate notes.
•Certain of the funds we manage invest in infrastructure assets and real assets, which may expose us and the funds we manage to increased risks and liabilities that are inherent in the ownership, development and monetization of real assets.
•The funds we manage invest in assets denominated in currencies that differ from the currency in which the relevant fund is denominated.
•We have undertaken business initiatives to increase the number and type of investment products we could offer to investors. For example, we and the funds we manage have sponsored or otherwise made, and may continue to, sponsor or otherwise make investments in, or facilitate the acquisition of companies by, special purpose acquisition companies (“SPACs”). We are also likely to continue offering products for retail investors.
In each of these cases, the investments are exposed to significant risks and uncertainties, including regulatory and legal risks and oversight, adverse publicity and investor perceptions, reputational harm, counterparty default risk, inaccuracy of financial projections, inability to obtain full information as to the exact financial and operating conditions of the investment, increased likelihood that the assumptions on which we have based the investment are delayed, change or are never materialized, the effect of disruptions or volatility in the financial markets, inflation, commodity price risk, and additional exposures associated with attempts to hedge and otherwise protect from the downside of the investments. In each instance, if such risks were to materialize, the objective of our investments may not be fully realized, which could have a material adverse effect on our business and results of operations.
The performance of the funds we manage, and our performance, may be adversely affected by the financial performance of portfolio companies of the funds we manage and the industries in which the funds we manage invest.
Our performance and the performance of many of the funds we manage are significantly affected by the value of the companies in which the funds we manage have invested. The funds we manage invest in companies in many different industries, each of which is subject to volatility based upon a variety of factors, including economic, political and market factors. For example:
•The performance of certain of the portfolio companies of the funds we manage in the leisure and hospitality industry has been negatively impacted by the COVID-19 pandemic.
•The performance of the investments of the funds we manage in the commodities markets is substantially dependent upon prevailing prices of oil and natural gas, which have been impacted by the recent and ongoing global energy crisis.
•The investments of the funds we manage in companies in the financial services sector are subject to government regulations, disclosure requirements, limits on fees, increasing borrowing costs or limits on the terms or availability of credit to such portfolio companies, and other regulatory requirements each of which may impact the conduct of such portfolio companies.
•The real estate investments of the funds we manage are exposed to rising mortgage interest rates, increasing consumer debt and a low level of consumer confidence in the economy and/or the residential real estate market.
•Investments of the funds we manage in commercial mortgage loans and other commercial real-estate related loans are subject to risks of delinquency and foreclosure, risks of loss that are greater than similar risks associated with mortgage loans made on the security of residential properties, and success of tenant businesses, property management decisions, competition from comparable types of properties and declines in regional or local real estate values and rental or occupancy rates.
•Investments of the funds we manage in the power and energy industries involve various risks, including regulatory and market risks. The increased scrutiny of regulators and investors on the negative ESG impacts of the power and energy industries may negatively impact the value of investments in these sectors and our ability to exit certain investments on favorable terms. Future regulatory or legislative efforts by government agencies could place additional limitations on carbon-intensive forms of power generation or the exploration, mining, extraction, distribution and/or refining of certain fossil fuels.
In addition, portfolio companies of the funds we manage across a wide range of industries have experienced significant challenges in their global supply chain, including shortages in supply, or disruptions or delays in shipments, of certain materials
40
or components used in their products, and related price increases. While to date many of these portfolio companies have been able to manage the challenges associated with these delays and shortages without significant disruption to their business, no assurance can be given that these efforts will continue to be successful. Deterioration in the domestic or international economic environment may cause decreased demand for the products and services of the portfolio companies of the funds we manage and increased competition, which could result in lower sales volume and lower prices for their products, longer sales cycles, and slower adoption of new technologies.
The performance of the funds we manage, and our performance, may be adversely affected to the extent the portfolio companies of the funds we manage experience adverse performance or additional pressure due to downward trends in their respective industries.
The funds that we manage in our yield strategy are subject to numerous additional risks.
The funds we manage in our yield strategy are subject to numerous additional risks, including the risks set forth below.
•The funds we manage may concentrate investments in any one borrower or other issuer, product category, industry, region or country.
•The funds we manage sometimes hold (including outright positions in issuers and exposure to such issuers derived through any synthetic and/or derivative instrument) in multiple tranches of securities of an issuer (or other interests of an issuer) or multiple funds having interests in the same tranche of an issuer.
•Certain of these funds may engage in short-selling, which is subject to a theoretically unlimited risk of loss.
•These funds are exposed to the risk that a counterparty will not settle a transaction in accordance with its terms and conditions because of a dispute over the terms of the contract (whether or not bona fide) or because of a credit or liquidity problem, thus causing the fund to suffer a loss.
•The efficacy of the investment and trading strategies of certain funds may depend largely on the ability to establish and maintain an overall market position in a combination of different financial instruments, which can be difficult to execute.
•Certain of these funds originate, acquire or participate in (including through assignments and sub-participation) loans, including, but not limited to, secured and unsecured notes, senior and second lien loans, mezzanine loans, non-performing loans or other high-risk receivables and other similar investments in below investment grade or unrated debt which are or may become illiquid.
•These funds’ investments are subject to risks relating to investments in commodities, swaps, futures, options and other derivatives, the prices of which are highly volatile and may be subject to a theoretically unlimited risk of loss in certain circumstances.
Risks Related to Our Retirement Services Business
A financial strength rating downgrade, potential downgrade or any other negative action by a rating agency could make our product offerings less attractive, inhibit our ability to acquire future business through acquisitions or reinsurance and increase our cost of capital, which could have a material adverse effect on our business.
Various Nationally Recognized Statistical Rating Organizations (“NRSROs”) review the financial performance and condition of insurers and reinsurers, including our subsidiaries, and publish their financial strength ratings as indicators of an insurer’s ability to meet policyholder obligations. These ratings are important to maintain public confidence in our insurance subsidiaries’ products, our insurance subsidiaries’ ability to market their products and our competitive position. Factors that could negatively influence this analysis include:
•changes to the business practices or organizational business plan of our retirement services business in a manner that no longer supports its ratings;
•unfavorable financial or market trends;
•changes in NRSROs’ capital adequacy assessment methodologies, such as the S&P Global Ratings’ recently published Request for Comment on its methodology and assumptions for analyzing the risk-based capital adequacy of insurers and reinsurers, in a manner that would adversely affect the financial strength ratings of our insurance subsidiaries;
•a need to increase reserves to support the outstanding insurance obligations of our retirement services business;
•our inability to retain our senior management and other key personnel;
•rapid or excessive growth, especially through large reinsurance transactions or acquisitions, beyond the bounds of capital sufficiency or management capabilities as judged by the NRSROs; and
41
•significant losses to the investment portfolio of our retirement services business.
Some other factors may also relate to circumstances outside of our control, such as views of the NRSRO and general economic conditions. Any downgrade or other negative action by a NRSRO with respect to the financial strength ratings of our insurance subsidiaries, or an entity we acquire, or credit ratings of our retirement services business, could materially adversely affect us and our retirement services business’ ability to compete in many ways, including the following:
•reducing new sales of insurance products;
•harming relationships with or perceptions of distributors, IMOs, sales agents, banks and broker-dealers;
•increasing the number or amount of policy lapses or surrenders and withdrawals of funds, which may result in a mismatch of our overall asset and liability position;
•requiring our retirement services business to offer higher crediting rates or greater policyholder guarantees on its insurance products in order to remain competitive;
•increase borrowing costs of our retirement services business;
•reducing the level of profitability and capital position of our retirement services business generally or hindering its ability to raise new capital; or
•requiring our retirement services business to collateralize obligations under or result in early or unplanned termination of hedging agreements and harming the ability of our retirement services business to enter into new hedging agreements.
In order to improve or maintain their financial strength ratings, our subsidiaries may attempt to implement business strategies to improve their capital ratios. We cannot guarantee any such measures will be successful. We cannot predict what actions NRSROs may take in the future, and failure to maintain current financial strength ratings could materially and adversely affect our business, financial condition, results of operations and cash flows.
Our retirement services business is subject to significant operating and financial restrictions imposed by its credit agreements, liquidity facility and certain letters of credit and it is also subject to certain operating restrictions imposed by the indenture to which it is a party.
On December 3, 2019, AHL, ALRe, AUSA and AARe, as borrowers, entered into a credit agreement with a syndicate of banks, including Citibank, N.A., as administrative agent, and the other lenders named therein (the “AHL Credit Facility”). In the third quarter of 2022, AHL and Athene Life Re Ltd. entered into a revolving credit facility with a syndicate of banks, including Wells Fargo Bank, National Association, as administrative agent, which matures on June 30, 2023, subject to additional 364-day extensions (the “AHL Liquidity Facility”). The AHL Credit Facility, the AHL Liquidity Facility and certain AHL letters of credit also entered into contain various covenants, which restrict the operations of our retirement services business. As a result of these restrictions, our retirement services business may be limited in how it conducts its operations and may be unable to raise additional debt financing to compete effectively or to take advantage of new business opportunities.
In addition to the covenants to which our retirement services business is subject pursuant to the AHL Credit Facility, AHL Liquidity Facility and certain letters of credit, AHL is also subject to certain limited covenants pursuant to the indenture, dated January 12, 2018, by and between AHL and U.S. Bank National Association, as trustee, as supplemented by the applicable supplemental indenture, by and among us and U.S. Bank National Association, as trustee (the “AHL Indenture”). The AHL Indenture contains restrictive covenants which limit, subject to certain exceptions, AHL’s and, in certain instances, some or all of its subsidiaries’ ability to make fundamental changes, create liens on any capital stock of certain of AHL’s subsidiaries, and sell or dispose of the stock of certain of AHL’s subsidiaries.
The terms of any future indebtedness of our retirement services business may contain additional restrictive covenants.
If we are unable to attract and retain IMOs, agents, banks and broker-dealers, sales of our retirement services products may be adversely affected.
In our retirement services business, we distribute annuity products through a variable cost distribution network, which includes numerous IMOs, independent agents, banks and regional broker-dealers. We must attract and retain such marketers, agents and financial institutions to sell our products. In particular, insurance companies compete vigorously for productive agents. We compete with other life insurance companies for marketers, agents and financial institutions primarily on the basis of our financial position, support services, compensation, credit ratings and product features. Such marketers, agents and financial institutions may promote products offered by other life insurance companies that may offer a larger variety of products than we
42
do. Our competitiveness for such marketers, agents and financial institutions also depends upon the long-term relationships we develop with them. There can be no assurance that such relationships will continue in the future. In addition, our growth plans include increasing the distribution of annuity products through banks and broker-dealers. If we are unable to attract and retain sufficient marketers and agents to sell our products or if we are not successful in expanding our distribution channels within the bank and broker-dealer markets, our ability to compete and our sales volumes and results of operations could be adversely affected.
As a financial services company, we are exposed to liquidity risk, which is the risk that we are unable to meet near-term obligations as they come due.
Liquidity risk is a manifestation of events that are driven by other risk types (e.g., market, policyholder behavior, operational). A liquidity shortfall may arise in the event of insufficient funding sources or an immediate and significant need for cash or collateral. In addition, it is possible that expected liquidity sources, such as the AHL Credit Facility and AHL Liquidity Facility, may be unavailable or inadequate to satisfy the liquidity demands described below. In particular, the spread of COVID-19, the war between Russia and Ukraine, and inflation and the responses by the U.S. Federal Reserve continue to contribute to volatility in the financial markets and may restrict the liquidity sources available to us and further may result in an increase of our liquidity demands. We primarily have liquidity exposure through our collateral market exposure, asset liability mismatch, dependence on the financial markets for funding and funding commitments. If a material liquidity demand is triggered and we are unable to satisfy the demand with the sources of liquidity readily available to us, it may have a material adverse impact on our business, financial condition, results of operations, liquidity and cash flows. See “Item 7. Management’s Discussion and Analysis of Financial Condition and Results of Operations—Liquidity and Capital Resources” for a discussion of our liquidity and sources and uses of liquidity, including information about legal and regulatory limits on the ability of our subsidiaries to pay dividends.
The amount of statutory capital that our insurance and reinsurance subsidiaries have, or that they are required to hold, can vary significantly from time to time and is sensitive to a number of factors outside of our control.
The U.S. insurance subsidiaries of our retirement services business are subject to state regulations that provide for minimum capital requirements (“MCR”) based on risk-based capital (“RBC”) formulas for life insurance companies relating to insurance, business, asset, interest rate and certain other risks. Similarly, the Bermuda reinsurance subsidiaries of our retirement services business are subject to MCR imposed by the Bermuda Monetary Authority (“BMA”) through the BMA’s Enhanced Capital Requirement (“ECR”) and minimum margin of solvency.
In any particular year, our subsidiaries’ capital ratios and/or statutory surplus amounts may increase or decrease depending on a variety of factors, some of which are outside of our control and some of which we can only partially control, including, but not limited to, the following:
•the amount of statutory income or loss generated by our insurance subsidiaries;
•the amount of additional capital our insurance subsidiaries must hold to support their business growth;
•changes in reserve requirements applicable to our insurance subsidiaries;
•changes in market value of certain securities in our investment portfolio;
•recognition of write-downs or other losses on investments held in the investment portfolio of our retirement services business;
•changes in the credit ratings of investments held in the investment portfolio of our retirement services business;
•changes in the value of certain derivative instruments;
•changes in interest rates;
•credit market volatility;
•changes in policyholder behavior;
•changes in corporate tax rates;
•changes to the RBC formulas and interpretations of the NAIC instructions with respect to RBC calculation methodologies; and
•changes to the ECR, Bermuda Solvency Capital Requirement (“BSCR”), or target capital level (“TCL”) formulas and interpretations of the BMA’s instructions with respect to ECR, BSCR, or TCL calculation methodologies.
Further to NAIC activities with respect to RBC calculation methodologies, the NAIC is pursuing a variety of reforms to its RBC framework, which could increase the capital requirements for our U.S. insurance subsidiaries. Two examples include the following: (1) a principles-based bond project is underway, which includes consideration of factors to determine whether an
43
investment in asset-backed securities qualifies for reporting on an insurer’s statutory financial statement as a bond on Schedule D-1 as opposed to Schedule BA (other long-term invested assets), the latter of which could result, among other things, in the capital charge treatment of the investment being less favorable; and (2) a process to review capital charges on structured securities has commenced as well as the evaluation of private credit rating providers’ rating information and process for privately issued securities purchased by insurers, each of which could increase the level of capital required to be held against these assets.
Further to BMA activities with respect to ECR, BSCR or TCL calculation methodologies, on December 8, 2022, the BMA issued a notice that it intends to make enhancements to Bermuda’s regulatory regime for insurers, and on February 24, 2023, the BMA issued a consultation paper on the enhancements it is considering. The consultation period is expected to continue for several months and possibly through the end of 2023. The enhancements are aimed at ensuring that the regime continues to remain fit for purpose, in line with international standards and keeps pace with market developments. While it is too early to predict the ultimate magnitude of the financial impact for our Bermuda insurance subsidiaries, the enhancements (if enacted as currently proposed) would increase the capital requirements for our Bermuda insurance subsidiaries; however, we would expect the impact to be moderated for several reasons, including the fact that we manage capital sufficiency based upon a number of factors, including our internal modeling and analysis of economic risk, inputs from rating agency capital models and consideration of NAIC RBC capital requirements, in addition to Bermuda capital requirements.
NRSROs may also implement changes to their internal models, which differ from the RBC and BSCR capital models, that have the effect of increasing or decreasing the amount of statutory capital our subsidiaries must hold in order to maintain their current ratings. For example, on December 6, 2021, S&P Global Ratings (“S&P”) published a Request for Comment (“RFC”) on its methodology and assumptions for analyzing the risk-based capital adequacy of insurers and reinsurers. On May 9, 2022, S&P withdrew its proposed approach due to some of the comments and concerns received. S&P has stated they plan to issue a new RFC once they have finished reviewing the feedback from the initial RFC, likely in the first quarter of 2023. To the extent that one of our insurance subsidiary’s solvency or capital ratios is deemed to be insufficient by one or more NRSROs to maintain their current ratings, we may take actions either to increase the capitalization of the insurer or to reduce the capitalization requirements. If we are unable to accomplish such actions, NRSROs may view this as a reason for a ratings downgrade. If we are unable to accomplish such actions, NRSROs may view this as a reason for a ratings downgrade. Regulatory developments, including the NAIC’s adoption of amendments to its Insurance Holding Company System Regulatory Act and Model Regulation requiring, subject to certain exceptions, that our retirement services business file a confidential annual group capital calculation (and likely the results of an annual liquidity stress test) with the Iowa Insurance Division, the lead state insurance regulator of its U.S. insurance subsidiaries, may increase the amount of capital that our retirement services business is required to hold and could result in it being subject to increased regulatory requirements.
If a subsidiary’s solvency or capital ratios reach certain minimum levels, it could subject us to further examination or corrective action imposed by our insurance regulators. Corrective actions may include limiting our subsidiaries’ ability to write additional business, increased regulatory supervision, or seizure or liquidation of the subsidiary’s business, each of which could materially and adversely affect our business, financial condition, results of operations, cash flows and prospects.
Repurchase agreement programs subject us to potential liquidity and other risks.
Our retirement services business may engage in repurchase agreement transactions whereby it sells fixed income securities to third parties, primarily major brokerage firms or commercial banks, with a concurrent agreement to repurchase such securities at a determined future date. These repurchase agreements provide our retirement services business with liquidity and in certain instances also allow it to earn spread income. Under such agreements, our retirement services business may be required to deliver additional securities or cash as margin to the counterparty if the value of the securities sold decreases prior to the repurchase date. If our retirement services business is required to return significant amounts of cash collateral or post cash or securities as margin on short notice or have inadequate cash on hand as of the repurchase date, it may be forced to sell securities to meet such obligations and may have difficulty doing so in a timely manner or may be forced to sell securities in a volatile or illiquid market for less than it otherwise would have been able to realize under normal market conditions. Rehypothecation of subject securities by the counterparty may also create risk with respect to the counterparty’s ability to perform its obligations to tender such securities on the repurchase date. Such facilities may not be available to our retirement services business on favorable terms or at all in the future.
Our retirement services business is subject to the credit risk of its counterparties, including ceding companies, reinsurers, plan sponsors, and derivative counterparties.
44
Athene and its insurance subsidiaries encounter various types of counterparty credit risk. Athene’s insurance subsidiaries cede certain risk to third-party insurance companies that may cover large volumes of business and expose them to a concentration of credit risk with respect to such counterparties. Such subsidiaries may not have a security interest in the underlying assets and despite certain indemnification rights, they retain liability to their policyholders if a counterparty fails to perform. Certain of Athene’s insurance subsidiaries also reinsure liabilities from other insurance companies and these subsidiaries may be negatively impacted by changes in the ceding companies’ ratings, creditworthiness, and market perception, or any policy administration issues. Athene further assumes pension obligations from plan sponsors that expose it to the credit risk of the plan sponsor. In addition, our retirement services business is exposed to credit loss in the event of nonperformance by its derivative agreement counterparties. If any of these counterparties is not able to satisfy its obligations to us or third parties, including policyholders, we may not achieve our targeted returns and our financial position, results of operations, liquidity and cash flow may be materially adversely affected.
The investment portfolio of our retirement services business may be subject to concentration risk, particularly with respect to single issuers, including Athora, among others; industries, including financial services; and asset classes, including real estate.
Our retirement services business faces single issuer concentration risk both in the context of strategic alternative investments, in which it occasionally holds significant equity positions, and large asset trades, in which it generally holds significant debt positions. The most significant concentration risk exposures of our retirement services business arising in the context of strategic alternative investments, on a risk-adjusted basis, is its investment in Athora, an insurance holding company focused on the European life insurance market. Given our retirement services business’ significant exposure to these issuers, it is subject to the risks inherent in their business. For example, as a life insurer, Athora is subject to credit risk with respect to its investment portfolio and mortality risk with respect to its product liabilities, each of which may be exacerbated by unforeseen events. Further, Athora has significant European operations, which expose it to volatile economic conditions and risks relating to European member countries and withdrawals thereof, such as the UK. In addition, Athora is subject to multiple legal and regulatory regimes that may hinder or prevent it from achieving its business objectives. To the extent that our retirement services business suffers a significant loss on its investment in these issuers, including Athora, our financial condition, results of operations and cash flows could be adversely affected.
In addition, from time to time, in order to facilitate certain large asset trades and in exchange for commitment fees, our retirement services business may commit to purchasing a larger portion of an investment than it ultimately expects to retain, and in such instances our retirement services business is reliant upon the ability of our asset management business to syndicate the transaction to other investors. If our asset management business is unsuccessful in its syndication efforts, our retirement services business may be exposed to greater concentration risk than what it would deem desirable from a risk appetite perspective and the commitment fee that it receives may not adequately compensate it for this risk.
Our retirement services business also has significant investments in nonbank lenders focused on providing financing to individuals or entities. As a result, through these investments, we have significant exposure to credit risk. In addition to the concentration risk arising from our retirement services business’ investments in single issuers within the nonbank lending sector of the financial services industry, we have significant exposure to the financial services industry more broadly as a result of the composition of investments in our retirement services business’ investment portfolio. Economic volatility or any further macroeconomic, regulatory or other changes having an adverse impact on the financial services industry more broadly, could have a material and adverse effect on our business, financial condition, results of operations and cash flows.
A significant portion of the net invested assets of our retirement services business is invested in real estate-related assets. Any significant decline in the value of real estate generally or the occurrence of any of the risks described elsewhere in this report with respect to the real estate-related investments of our retirement services business could materially and adversely affect our financial condition and results of operations. Specifically, through the investments of our retirement services business in CML and CMBS, we have exposure to certain categories of commercial property, including office buildings and retail, that have been adversely affected by the spread of COVID-19 and the work from home trend. In addition, the CML our retirement services business holds, and the CML underlying the CMBS that our retirement services business holds, face both default and delinquency risk.
45
Conflicts of Interest
Our failure to deal appropriately with conflicts of interest could damage our reputation and adversely affect our businesses.
We increasingly confront potential conflicts of interest relating to our business, our investment activities and the investment activities of the funds we manage. As an asset manager, conflicts of interest may arise in connection with investment decisions, including regarding the identification, making, management, valuation, disposition, and timing of a fund’s investments. These conflicts of interest include conflicts that arise among the funds we manage as well as between us and the funds we manage. Certain inherent conflicts of interest arise from the fact that (i) we provide investment management services to more than one fund or client, (ii) the funds we manage often have one or more overlapping investment strategies, and (iii) we could choose to allocate an investment to more than one fund or to ourselves. Also, the investment strategies employed by us for current and future clients, or on our own behalf, could conflict with each other, and may adversely affect the prices and availability of other securities or instruments held by, or potentially considered for, one or more clients. If participation in specific investment opportunities is appropriate for more than one of the funds we manage, participation in such opportunities will be allocated pursuant to our allocation policies and procedures, which take into account the terms of the relevant partnership or investment management agreement as well as the decisions of our allocations committee.
In addition to the potential for conflict among the funds we manage, we face the potential for conflict between us and the funds we manage or clients. These conflicts may include: (i) the allocation of investment opportunities between Apollo and the funds Apollo manages; (ii) the allocation of investment opportunities among funds with different performance fee structures, or where our personnel have invested more heavily in one fund than another; (iii) the determination of what constitutes fund-related expenses and the allocation of such expenses between our advised funds and us; and (iv) the ability of our personnel to, in certain circumstances, make investments in the funds we manage or funds managed by third parties on more favorable terms.
The documents of the funds we manage typically do not mandate specific allocations with respect to co-investments. The investment advisers of the funds we manage may have an incentive to provide potential co-investment opportunities to certain investors in lieu of others and/or in lieu of an allocation to the funds we manage (including, for example, as part of an investor’s overall strategic relationship with us) if such allocations are expected to generate relatively greater fees or performance allocations to us than would arise if such co-investment opportunities were allocated otherwise.
The conflicts of interest stemming from investment allocation decisions are exacerbated by our sponsorship of SPACs. After a SPAC has completed its initial public offering, it has to complete its initial business combination within a predetermined completion window. If a SPAC fails to complete a business combination in the prescribed time, the SPAC is required to redeem the shares of its investors while we and the funds we manage, as the SPAC sponsor, would lose our entire investment. In order to protect our capital, our investment professionals may allocate a potential investment to a SPAC as opposed to a different Apollo managed fund, portfolio company or client, thereby creating a conflict of interest. This conflict of interest will increase as our SPACs get closer to the end of their completion window.
The funds we manage invest in portfolio companies whose operations may be substantially similar to and/or competitive with the portfolio companies in which our other funds have invested. The performance and operation of such competing businesses could conflict with and adversely affect the performance and operation of the portfolio companies of the funds we manage, and may adversely affect the prices and availability of business opportunities or transactions available to such portfolio companies. In addition, we may take different actions across funds with similar investment programs, objectives or strategies. For example, one of the private equity funds we manage could have an interest in pursuing an acquisition, divestiture or other transaction, even though the proposed transaction would subject one or more of the investments of the credit funds we manage to additional or increased risks. We may also advise clients with investment objectives or strategies that conflict with those of certain of the funds we manage. We, the funds we manage or the portfolio companies of the funds we manage may also have ongoing relationships with issuers whose securities have been acquired by, or are being considered for investment by us. In addition, a dispute may arise between the portfolio companies of the funds we manage, and the investors in the funds we manage may be dissatisfied with our handling of such dispute.
We currently operate without information barriers in our asset management business that some other investment management firms implement to separate business units and/or to separate persons who make investment decisions from others who might possess material non-public information that could influence such decisions. Our executive officers, investment professionals or other employees may acquire confidential or material non-public information and, as a result, they, we, the funds we manage and other clients may be restricted from initiating transactions in certain securities. In the event that any of our employees obtains such material non-public information, we may be restricted in acquiring or disposing of investments on behalf of the
46
funds we manage, which could impact the returns generated for such funds. Notwithstanding the maintenance of restricted securities lists and other internal controls, it is possible that the internal controls relating to the management of material non-public information could fail and result in us, or one of our investment professionals, buying or selling a security while, at least constructively, in possession of material non-public information. Inadvertent trading on material non-public information could have adverse effects on our reputation, result in the imposition of regulatory or financial sanctions and, as a consequence, negatively impact our ability to provide our investment management services to our clients and the funds we manage.
The functions of certain of our affiliates may give rise to a number of conflicts of interest. For example, certain of our affiliates are broker-dealers registered with the SEC and members of the Financial Industry Regulatory Authority, Inc. (“FINRA”) that principally conduct private placements and provide services in respect of the underwriting and syndication of securities, transaction advisory services, including capital markets advisory and structuring services, sourcing services and merger and acquisition advisory services. Additionally, certain of our affiliates and/or portfolio companies of the funds we manage provide a variety of services with respect to financial instruments, including loans, that are not subject to broker-dealer regulations, such as originating, administering, arranging, structuring, placing and syndicating loans, debt advisory and other similar services to the funds we manage and their portfolio companies, as well as third parties. While we believe these kinds of transactions are beneficial to our clients and the funds we manage, the functions that our affiliates may perform give rise to a number of conflicts of interest, including, for example, with respect to the allocation of investment opportunities. In connection with their services to the funds we manage and their portfolio companies, such affiliates and/or the portfolio companies receive fees from the funds we manage, portfolio companies of the funds we manage and third-party borrowers. Consequently, our relationship with these entities may give rise to conflicts of interest between (i) us and portfolio companies of the funds we manage and/or (ii) us and the funds we manage. Additionally, some of our personnel are dual affiliated with other organizations, including our affiliated broker-dealers. Such dual affiliation gives rise to conflicts of interest, including for example with respect to allocation of time, resources, and investment opportunities.
Certain of our executive officers and senior investment professionals have established family offices to provide investment advisory, accounting, administrative and other services to their respective family accounts (including certain charitable accounts) in connection with their personal investment activities unrelated to their investments in Apollo entities. The investment activities of the family offices, and the involvement of the executive officer or senior investment professional in these activities may give rise to potential conflicts between the personal financial interests of the executive officer or senior investment professional and the interests of us, any of our subsidiaries or any stockholder other than such executive officer or senior investment professional.
From time to time, we finance, securitize or employ structured finance arrangements in respect of certain of our balance sheet assets. We could also employ structured financing arrangements with respect to co-investment interests and investments in other funds made by our entities (including, potentially, co-investments with the funds we manage). These structured financing arrangements could alter our returns and risk exposure with respect to the applicable balance sheet assets as compared to our returns and risk exposure if we held such assets outside of such structured financing arrangements, and could create incentives for us to take actions in respect of such assets that we otherwise would not in the absence of such arrangements or otherwise alter our alignment with investors in such investments. These arrangements could also result in us realizing liquidity with respect to our equity investment in a fund or other entity at a different point in time (including earlier) than the limited partners of such entity.
In addition to such finance arrangements, we also opportunistically invest or otherwise deploy the assets on our balance sheet. Such investments may create a platform of businesses directly owned by us, outside of the funds we manage and their portfolio companies or directly owned by the funds we manage. We may be subject to increased conflicts of interest between operating such platform businesses and the funds we manage and their portfolio companies. In addition, certain entities in which Apollo has made a balance sheet investment also may provide services to Apollo, the funds we manage or their portfolio companies, which may give rise to conflicts of interest.
In addition, the funds we manage may, subject to applicable requirements in their governing documents, which may include obtaining advisory board consent, determine to sell a particular portfolio investment into a separate vehicle, which may be managed by us, with different terms (i.e., longer duration) than the fund that originally acquired the portfolio investment, and provide limited partners with the option to monetize their investment with the fund at the time of such sale, or to roll all or a portion of their interest in the portfolio investment into a new vehicle. Under such circumstances, we may invest in or alongside the new vehicle, or hold the entirety of the portfolio investment sold by the fund through or alongside the new vehicle (i.e., in the event that all limited partners elect to monetize their investment at the time of sale to the new vehicle). As a consequence, conflicts of interest may arise across the funds we manage, limited partners, and us.
47
Most of the funds we manage obtain subscription line facilities to facilitate investments and operations, including the payment of fees and expenses. If an investment fund obtains a subscription line facility, the fund’s working capital needs will in most instances be satisfied through borrowings by the fund under the subscription line facility, and, less so, by drawdowns of capital contributions by the fund. As a result, capital calls are expected to be conducted in larger amounts on a less frequent basis in order to, among other things, repay borrowings and related interest expenses due under such subscription line facilities.
Where an investment fund uses borrowings under a subscription line facility in advance or in lieu of receiving capital contributions from investors to repay any such borrowings and related interest expenses, the use of such facility will result in a different (and perhaps higher) reported internal rate of return than if the facility had not been utilized and instead capital contributions from investors had been contributed at the inception of an investment. This may present conflicts of interest. Because the preferred return of investment funds typically does not accrue on such borrowings, but rather only accrues on capital contributions when made, the use of such subscription line facilities may reduce or eliminate the preferred return received by the investors and accelerate or increase distributions of performance-based allocation to the relevant general partner. This will provide the general partner with an economic incentive to fund investments through such facilities in lieu of capital contributions. However, since interest expense and other costs of borrowings under subscription lines of credit are an expense of the investment fund, the investment fund’s incurred expenses will be increased, which may reduce the amount of performance fees generated by the fund.
Appropriately dealing with conflicts of interest is complex and difficult and our reputation could be damaged if we fail, or appear to fail, to deal appropriately with one or more potential or actual conflicts of interest. Regulatory scrutiny of, or litigation in connection with, conflicts of interest could have a material adverse effect on our reputation which would materially adversely affect our business and results of operations.
Risks Related to Regulation and Litigation
Extensive regulation of our businesses affects our activities and creates the potential for significant liabilities and penalties. The possibility of increased regulatory focus could result in additional burdens on our businesses.
We are subject to extensive regulation, including periodic examinations and requirements to obtain and maintain licenses and/or other approvals, by government agencies and self-regulatory organizations in the jurisdictions in which we operate around the world. Many of the various laws and regulations to which we are subject are discussed in “Item 1. Business—Regulatory and Compliance Matters.” As detailed in that section, certain of our businesses, subsidiaries and/or affiliates are, among others, regulated under the Investment Advisers Act; the Investment Company Act; the Dodd-Frank Wall Street Reform and Consumer Protection Act; the EU Alternative Investment Fund Managers Directive; the EU Markets in Financial Instruments Directive; the EU General Data Protection Regulation; the U.K. Data Protection Act 2018; the Cayman Data Protection Law; the California Consumer Privacy Act of 2018; the Regulation on OTC Derivatives, Central Counterparties and Trade Repositories; as well as by the Financial Stability Oversight Council; the Federal Reserve; the SEC; FINRA; the U.S. Department of Labor; the Internal Revenue Service (“IRS”); the Office of the Comptroller of the Currency; the Federal Communications Commission; insurance regulators in U.S. states, the EU, Bermuda, U.K., Ireland, Italy, Switzerland, Germany, Belgium, the Netherlands, Australia, Singapore, Canada, Cayman Islands, Malaysia, South Korea and Hong Kong; banking regulators in Germany, Slovenia and Spain; as well as rules and regulations regarding CLO risk retention, real estate investment trusts, broker-dealers, “over the counter” derivatives markets, commodity pool operators, commodity trading advisors, gaming companies, and natural resources companies. We are also subject to laws and regulations governing payments and contributions to public officials or other parties, including restrictions imposed by the U.S. Foreign Corrupt Practices Act, as well as economic sanctions and export control laws administered by the U.S. Treasury Department’s Office of Foreign Assets Control, the U.S. Department of Commerce and the U.S. Department of State. Increasingly, we are or may be subject to new initiatives and additional rules and regulations relating to ESG matters, including but not limited to: in the EU, the EU Regulation on the Establishment of a Framework to Facilitate Sustainable Investment as well as the EU Sustainable Finance Disclosure Regulation and supporting regulatory technical standards; and, in the U.K., the U.K. FCA’s disclosure rules for asset managers aligned with the recommendations of the Taskforce on Climate-Related Financial Disclosures as well as the forthcoming Sustainability Disclosure Requirements and investment labelling regime and the proposed U.K. Green Taxonomy. Compliance with such laws and regulations requires increasing amounts of resources and the attention of our management team. Any violation, even if alleged, of such laws and regulations or any failure to obtain or maintain licenses and/or other regulatory approvals as required for our operations may have a material adverse effect on our businesses, financial condition, results of operations, liquidity, cash flows and prospects.
48
Many of these laws and regulations empower regulators, including U.S. and foreign government agencies and self-regulatory organizations, as well as state securities commissions and insurance departments in the U.S., to conduct investigations and administrative proceedings that can result in penalties, fines, suspensions or revocations of licenses and/or other regulatory approvals, suspensions of personnel or other sanctions, including censure, the issuance of cease-and-desist orders, enforcement actions and settlements, or the suspension or expulsion of an investment adviser from registration or memberships. Even if an investigation or proceeding does not result in a sanction or the sanction imposed against us or our personnel by a regulator is small in monetary amount, the adverse publicity relating to the investigation, proceeding or imposition of these sanctions could harm our reputation and cause us to lose existing investors or fail to gain new investors. These requirements imposed by our regulators are designed primarily to ensure the integrity of the financial markets and to protect investors in the funds we manage and policyholders of our retirement services and other businesses and may not necessarily be designed to protect our stockholders. Other regulations, such as those promulgated by the Committee on Foreign Investment in the United States and similar foreign direct investment regimes in other jurisdictions, may impair our ability to invest the funds we manage and/or for such funds to realize full value from our investments in certain industries and countries.
Our businesses may be adversely affected as a result of new or revised legislation or regulations imposed by U.S. or foreign government agencies or self-regulatory organizations. We also may be adversely affected by changes in the interpretation or enforcement of existing laws and rules by these government agencies and self-regulatory organizations. The financial services industry is the focus of increased regulatory scrutiny as various U.S. state and federal government agencies and self-regulatory organizations conduct inquiries and investigations into the products and practices of the industry. Government agencies and insurance standard setters in the U.S. and worldwide have also become increasingly interested in potential risks posed by the insurance industry as a whole, and to commercial and financial activities and systems in general, as indicated by the development of ComFrame, which will be applicable to IAIGs designated by their group-wide supervisor and includes a group capital requirement in addition to the current legal entity capital requirements and any group capital requirements imposed by relevant insurance laws and regulations. We expect that we and/or one or more of our affiliates will be designated as an IAIG in 2023. In the event that we or any of our affiliates become an IAIG, we expect to ultimately be subject to the relevant group capital standard that applies to U.S.-headquartered IAIGs. We cannot fully predict with certainty the impact (if any) on our capital position and capital structure and any other burdens being named an IAIG may impose on us and/or our affiliates. Consequently, we may be subject to new, divergent, conflicting, increasingly severe regulations and restrictions on our business that could have a material adverse effect on our businesses, financial condition, results of operations, liquidity, cash flows and prospects.
We are subject to third-party litigation from time to time that could result in significant liabilities and reputational harm, which could have a material adverse effect on our results of operations, financial condition and liquidity.
The activities of our businesses, including the investment activities of the funds we manage and activities of our employees in connection with the funds, their portfolio companies, our insurance subsidiaries, as well as publicly listed vehicles we manage or sponsor, including SPACs, may subject us and certain of our employees to the risk of litigation by third parties, including fund investors dissatisfied with the performance or management of such funds, holders of our or the funds’ portfolio companies’ debt or equity, policyholders of our retirement services business, public stockholders, and investors in the SPACs we sponsor and a variety of other potential litigants. In general, we will be exposed to risk of litigation by our investors if our management of any fund is alleged to constitute bad faith, gross negligence, willful misconduct, fraud, willful or reckless disregard for our duties to the fund, breach of fiduciary duties or securities laws, or other forms of misconduct. If such allegations are made against our Board or management, Section 220 of the Delaware General Corporation Law (the “DGCL”) allows stockholders to access corporate books and records to investigate wrongdoing. Fund investors could sue us to recover amounts lost by the funds we manage due to our alleged misconduct, up to the entire amount of loss. Further, we may be subject to litigation arising from investor dissatisfaction with the performance of the funds we manage or from third-party allegations that we (i) improperly exercised control or influence over companies in which the funds we manage have large investments or (ii) are liable for actions or inactions taken by portfolio companies that such third parties argue we control. We are also exposed to risks of litigation or investigation relating to transactions that presented conflicts of interest that were not properly addressed. Our rights to indemnification by the funds we manage may not be upheld if challenged, and our indemnification rights generally do not cover bad faith, gross negligence, willful misconduct, fraud, willful or reckless disregard for our duties to the fund or other forms of misconduct. With many highly paid investment professionals and complex compensation and incentive arrangements, we face the risk of lawsuits relating to claims for compensation, which may individually or in the aggregate be significant in amount. We are also increasingly faced with the risk of litigation or investigation in relation to ESG-related issues given the increasing scrutiny of such issues by investors, other stakeholders, regulators, and other third parties as well as due to the increasing disclosure obligations on our businesses, the funds we manage, and their portfolio companies. Such risks may relate to accusations concerning but not limited to: (i) the activities of portfolio companies, including environmental damage and violations of labor and human rights; (ii) misrepresentations of the investment strategies of the funds we manage as well as about our, the funds’, and their investments’ performance against ESG-
49
related measures and/or ESG initiatives; or (iii) breaches of fiduciary duty in relation to the funds we manage and other violations of law related to the management of ESG risks.
If any civil or criminal litigation brought against us were to result in a finding of substantial legal liability or culpability, the litigation could, in addition to any financial damage, cause significant reputational harm to us, which could seriously harm our business. In addition, we may not be able to obtain or maintain sufficient insurance on commercially reasonable terms or with adequate coverage levels against potential liabilities we may face in connection with potential claims, which could have a material adverse effect on our business.
Risks Related to Taxation
Our structure involves complex provisions of tax law for which no clear precedent or authority may be available. Our structure is also subject to ongoing future potential legislative, judicial or administrative change and differing interpretations, possibly on a retroactive basis.
The tax treatment of our structure and transactions undertaken by us depends in some instances on determinations of fact and interpretations of complex provisions of U.S. federal, state, local and non-U.S. income tax law for which no clear precedent or authority may be available. In addition, U.S. federal, state, local and non-U.S. income tax rules are constantly under review by persons involved in the legislative process, the IRS, the U.S. Department of the Treasury, and non-U.S. legislative and regulatory bodies, which frequently results in revised interpretations of established concepts, statutory changes, revisions to regulations and other modifications and interpretations. It is possible that future legislation increases the U.S. federal income tax rates applicable to corporations, limits further the deductibility of interest, subjects carried interest to more onerous taxation or effects other changes that could have a material adverse effect on our business, results of operations and financial condition.
On August 16, 2022, the U.S. government enacted the Inflation Reduction Act of 2022 (the “IRA”). The IRA contains a number of tax-related provisions, including a 15% minimum corporate income tax on certain large corporations as well as an excise tax on stock repurchases. It is unclear how the IRA will be implemented by the U.S. Department of the Treasury through regulation. We are still evaluating the impact of the IRA on our tax liability, which tax liability could also be affected by how the provisions of the IRA are implemented through such regulation. We will continue to evaluate the IRA’s impact as further information becomes available.
We cannot predict whether any particular proposed legislation will be enacted or, if enacted, what the specific provisions or the effective date of any such legislation would be, or whether it would have any effect on us. As such, we cannot assure you that future legislative, administrative or judicial developments will not result in an increase in the amount of U.S. or non-U.S. tax payable by us, the funds we manage, portfolio companies owned by such funds or by investors in our shares. If any such developments occur, our business, results of operations and cash flows could be adversely affected and such developments could have an adverse effect on your investment in our shares.
Our effective tax rate and tax liability is based on the application of current income tax laws, regulations and treaties. These laws, regulations and treaties are complex, and the manner which they apply to us and the funds we manage is sometimes open to interpretation. Significant management judgment is required in determining our provision for income taxes, our deferred tax assets and liabilities and any valuation allowance recorded against our net deferred tax assets. Although management believes its application of current laws, regulations and treaties to be correct and sustainable upon examination by the tax authorities, the tax authorities could challenge our interpretation resulting in additional tax liability or adjustment to our income tax provision that could increase our effective tax rate.
In addition, we or certain portfolio companies of the funds we manage are currently (or have been recently) under tax audit in various jurisdictions, including the U.S., India, and the U.K., and these jurisdictions or any others where we conduct business may assess additional tax against us. While we believe our tax positions, determinations, and calculations are reasonable, the final determination of tax upon resolution of any audits could be materially different from our historical tax provisions and accruals. Should additional material taxes be assessed as a result of an audit, assessment, or litigation, there could be an adverse effect on our results of operations and cash flows in the period or periods for which that determination is made.
The U.S. Congress, the Organisation for Economic Co-operation and Development (the “OECD”) and other government agencies in jurisdictions where we and our affiliates invest or conduct business have continued to recommend and implement changes related to the taxation of multinational companies. The OECD, which represents a coalition of member countries, is contemplating changes to numerous long-standing tax principles through its base erosion and profit shifting (“BEPS”) project,
50
which is focused on a number of issues, including profit shifting among affiliated entities in different jurisdictions, interest deductibility and eligibility for the benefits of double tax treaties. Several of the proposed measures, including measures covering treaty abuse, the deductibility of interest expense, local nexus requirements, transfer pricing and hybrid mismatch arrangements are potentially relevant to some of the fund structures and could have an adverse tax impact on the funds we manage, investors and/or the portfolio companies of the funds we manage. Some member countries have been moving forward on the BEPS agenda but, because timing of implementation and the specific measures adopted will vary among participating states, significant uncertainty remains regarding the impact of BEPS proposals. As a result, uncertainty remains around the access to tax treaties for some of the investments’ holding platforms, which could create situations of double taxation and adversely impact the investment returns of the funds we manage.
In addition, the OECD is continuing to work on a two pillar initiative, “BEPS 2.0,” which is aimed at (1) shifting taxing rights to the jurisdiction of the consumer (“Pillar One”) and (2) ensuring all companies pay a global minimum tax (“Pillar Two”). Pillar One will, broadly, re-allocate taxing rights over 25% of the residual profits of multinational enterprises (“MNEs”) with global turnover in excess of 20 billion euros (excluding extractives and regulated financial services) to the jurisdictions where the customers and users of those MNEs are located. Pillar Two will, broadly, consist of two interlocking domestic rules (together the Global Anti-Base Erosion Rules (the “GloBE Rules”)): (i) an Income Inclusion Rule (“IIR”), which imposes top-up tax on a parent entity in respect of the low-taxed income of a constituent entity; and (ii) an Undertaxed Payment Rule, which denies deductions or requires an equivalent adjustment to the extent the low-taxed income of a constituent entity is not subject to tax under an IIR. There will also be a treaty-based Subject To Tax Rule that allows source jurisdictions to impose limited source taxation on certain related party payments subject to tax below a minimum rate.
For countries other than the U.S., the OECD recommended model GloBE Rules for Pillar Two in late 2021. The OECD also released further guidance on the model GloBE Rules during 2022 and is expected to continue to release guidance on a rolling basis throughout 2023. This includes the release in early February 2023 of further technical guidance which comments in particular on the interaction between the model GloBE Rules and current U.S. tax law. It was indicated by the OECD in May 2022 that the Two-Pillar Solution will not come into force until 2024 at the earliest.
Several aspects of the model GloBE Rules, including whether some or all of our activities may fall within the scope of the exclusions therefrom, currently remain unclear or uncertain notwithstanding existing commentary and draft legislation. The United Kingdom released draft legislation in July 2022 seeking to implement the IIR via a “multinational top-up tax” and has stated an intention that this tax will apply to multinational enterprises for accounting periods beginning on or after December 31, 2023. It is possible that other countries or jurisdictions may implement the recommended model GloBE Rules as drafted, in a modified form, or not at all. The content of future OECD guidance and its consistency with current international tax principles is currently unclear. Additionally, the timing, scope and implementation of any of these provisions into domestic law also remains subject to significant uncertainty. Depending on how the model GloBE Rules are implemented or clarified by additional commentary or guidance in the future, they may result in material additional tax being payable.
Changes in U.S. and non-U.S. tax law could adversely affect our ability to raise funds from certain investors.
Under the Foreign Account Tax Compliance Act (“FATCA”), certain U.S. withholding agents, foreign financial institutions (“FFIs”), and non-financial foreign entities, are required to report information about offshore accounts and investments to the U.S. or their local taxing authorities annually or be subject to a 30% U.S. withholding tax on certain U.S. payments. The reporting obligations imposed under FATCA require FFIs to comply with agreements with the IRS to obtain and disclose information about certain investors to the IRS. The administrative and economic costs of compliance with FATCA may discourage some investors from investing in U.S. funds, which could adversely affect our ability to raise funds from these investors. Other countries, such as the U.K., Luxembourg, and the Cayman Islands, have implemented regimes similar to that of FATCA. The OECD has also developed the Common Reporting Standard (“CRS”) for exchange of information pursuant to which many countries have now signed multilateral agreements. Rules and regulations are currently and will continue to be introduced (particularly pursuant to the EU “Directive on Administrative Co-Operation”, or “DAC 6”, and the OECD’s model Mandatory Disclosure Rules) which require the reporting to tax authorities of information about certain types of arrangements, including arrangements which may circumvent the CRS. Compliance with CRS and other similar regimes could result in increased administrative and compliance costs and could subject our investment entities to increased non-U.S. withholding taxes.
Our non-U.S. subsidiaries may be subject to U.S. federal income taxation in an amount greater than expected.
51
Our non-U.S. subsidiaries (including AHL) are treated as foreign corporations under the Internal Revenue Code of 1986, as amended (such subsidiaries, the “Non-U.S. Companies”). Each of the Non-U.S. Companies currently intends to operate in a manner that will not cause it to be subject to U.S. federal income taxation on a net basis in any material amount. However, there is considerable uncertainty as to whether a foreign corporation is engaged in a trade or business (or has a permanent establishment) in the U.S., as the law is unclear and the determination is highly factual and must be made annually, and therefore there can be no assurance that the IRS will not successfully contend that a Non-U.S. Company that does not intend to be treated as engaged in a trade or business (or as having a permanent establishment) in the U.S. does, in fact, so engage (or have such a permanent establishment). If any such Non-U.S. Company is treated as engaged in a trade or business in the U.S. (or as having a permanent establishment), it may incur greater tax costs than expected on any income not exempt from taxation under an applicable income tax treaty, which could have a material adverse effect on our financial condition, results of operations and cash flows.
AHL is currently a UK tax resident and expects to qualify for the benefits under the income tax treaty between the U.S. and the UK (the “UK Treaty”) because its common shares are owned by AGM, the common shares of which are listed and regularly traded on the NYSE. In addition, certain of AHL’s subsidiaries treated as resident in the UK for UK tax purposes (“UK Resident Companies”) expect to qualify for the benefits of the UK Treaty by reason of being subsidiaries of AGM or by reason of satisfying an ownership and base erosion test. Accordingly, AHL and the UK Resident Companies are expected to qualify for certain exemptions from, or reduced rates of, the U.S. taxes described above that are provided for by the UK Treaty. However, there can be no assurances that AHL and the UK Resident Companies will continue to qualify for treaty benefits or satisfy all of the requirements for the tax exemptions and reductions they intend to claim. If AHL or any of the UK Resident Companies fails to qualify for such benefits or satisfy such requirements, it may incur greater tax costs than expected, which could have a material adverse effect on our financial condition, results of operations and cash flows.
The Base Erosion and Anti-Abuse Tax (“BEAT”) may significantly increase our tax liability.
The BEAT operates as a minimum tax and is generally calculated as a percentage (10% for taxable years before 2026 and 12.5% thereafter) of the “modified taxable income” of an “applicable taxpayer.” Modified taxable income is calculated by adding back to a taxpayer’s regular taxable income the amount of certain “base erosion tax benefits” with respect to certain payments made to foreign affiliates of the taxpayer, as well as the “base erosion percentage” of any net operating loss deductions. The BEAT applies for a taxable year only to the extent it exceeds a taxpayer’s regular corporate income tax liability for such year (determined without regard to certain tax credits).
Certain reinsurance agreements of our retirement services business require certain of our U.S. subsidiaries (including any non-U.S. subsidiaries subject to U.S. federal income taxation) to pay or accrue substantial amounts to certain of our non-U.S. reinsurance subsidiaries that would be characterized as “base erosion payments” with respect to which there are “base erosion tax benefits.” These and any other “base erosion payments” may cause us to be subject to the BEAT. In addition, tax authorities may disagree with our BEAT calculations, or the interpretations on which those calculations are based, and assess additional taxes, interest and penalties.
We will establish our tax provision in accordance with U.S. GAAP. However, there can be no assurance that this provision will accurately reflect the amount of U.S. federal income tax that we ultimately pay, as that amount could differ materially from the estimate. There may be material adverse consequences to our business if tax authorities successfully challenge our BEAT calculations, in light of the uncertainties described above.
Changes in U.S. tax law might adversely affect demand for our retirement services products.
Many of the products that our retirement services business sells and reinsures benefit from one or more forms of tax-favored status under current U.S. federal and state income tax regimes. For example, our retirement services business sells and reinsures annuity contracts that allow the policyholders to defer the recognition of taxable income earned within the contract. Future changes in U.S. federal or state tax law could reduce or eliminate the attractiveness of such products, which could affect the sale of retirement services’ products or increase the expected lapse rate with respect to products that have already been sold. Decreases in product sales or increases in lapse rates, in either case, brought about by changes in U.S. tax law, may result in a decrease in net invested assets and therefore investment income and may have a material and adverse effect on our business, financial position, results of operations and cash flows.
There is U.S. income tax risk associated with reinsurance between U.S. insurance companies and their Bermuda affiliates.
52
If a reinsurance agreement is entered into among related parties, the IRS is permitted to reallocate or recharacterize income, deductions or certain other items, and to make any other adjustment, to reflect the proper amount, source or character of the taxable income of each of the parties. If the IRS were to successfully challenge our reinsurance arrangements, our financial condition, results of operations and cash flows could be adversely affected.
Our Bermuda subsidiaries are subject to the risk that Bermuda tax laws may change and that they may become subject to new Bermuda taxes following the expiration of a current exemption after 2035.
The Bermuda Minister of Finance, under the Exempted Undertakings Tax Protection Act 1966 of Bermuda, as amended, has given certain of our subsidiaries assurance that if any legislation is enacted in Bermuda that would impose tax computed on profits or income, or computed on any capital asset, gain or appreciation, or any tax in the nature of estate duty or inheritance tax, then the imposition of any such tax will not be applicable to our subsidiaries or any of our operations, shares, debentures or other obligations until March 31, 2035, except insofar as such tax applies to persons ordinarily resident in Bermuda or to any taxes payable by our subsidiaries in respect of real property owned or leased by our subsidiaries in Bermuda. Given the limited duration of the Bermuda Minister of Finance’s assurance, we cannot assure you that our subsidiaries will not be subject to any Bermuda tax after March 31, 2035.
Risks Related to Our Common Shares
The market price and trading volume of our shares may be volatile, which could result in rapid and substantial losses for our stockholders.
The market price of our shares may be highly volatile and could be subject to wide fluctuations. In addition, the trading volume in our shares may fluctuate and cause significant price variations to occur. You may be unable to resell your shares at or above your purchase price, if at all. Some of the factors that could negatively affect the price of our shares or result in fluctuations in the price or trading volume of our shares include: variations in our quarterly operating results or dividends, which variations we expect will be substantial; our policy of taking a long-term perspective on making investment, operational and strategic decisions, which is expected to result in significant and unpredictable variations in our quarterly returns; our creditworthiness, results of operations and financial condition; the credit ratings of the shares; the prevailing interest rates or rates of return being paid by other companies similar to us and the market for similar securities; failure to meet analysts’ earnings estimates; publication of research reports about us or the investment management industry or the failure of securities analysts to cover our shares; additions or departures of key management personnel; adverse market reaction to any indebtedness we may incur or securities we may issue in the future; actions by stockholders; changes in market valuations of similar companies; speculation in the press or investment community; changes or proposed changes in laws or regulations or differing interpretations thereof affecting our businesses or enforcement of these laws and regulations, or announcements relating to these matters; a lack of liquidity in the trading of our shares; adverse publicity about the investment management industry generally or individual scandals, specifically; a breach of our computer systems, software or networks, or misappropriation of our proprietary information; and economic, financial, geopolitical, regulatory or judicial events or conditions that affect us or the financial markets.
An investment in our shares is not an investment in any of the funds we manage, and the assets and revenues of such funds are not directly available to us.
Our shares are securities of Apollo Global Management, Inc. only. While our historical consolidated and combined financial information includes financial information, including assets and revenues of certain funds we manage on a consolidated basis, and our future financial information will continue to consolidate certain of these funds, such assets and revenues are available to the fund, and not to us except through management fees, performance fees, distributions and other proceeds arising from agreements with funds, as discussed in more detail in this report.
Our Certificate of Incorporation provides that the Court of Chancery of the State of Delaware is the sole and exclusive forum for certain legal actions between us and our stockholders, which could limit our stockholders’ ability to obtain a judicial forum viewed by the stockholders as more favorable for disputes with us or our directors, officers or employees, and the enforceability of the exclusive forum provision may be subject to uncertainty.
Article XIV of our Certificate of Incorporation provides that, unless we consent in writing to the selection of an alternative forum, the Court of Chancery of the State of Delaware shall, to the fullest extent permitted by law, be the sole and exclusive forum for: (a) any derivative action or proceeding brought on our behalf; (b) any action asserting a claim of breach of a
53
fiduciary duty owed by any of our current or former directors, officers, other employees or stockholders to us or our stockholders; (c) any action asserting a claim arising pursuant to any provision of the DGCL, the Certificate of Incorporation or our Bylaws or as to which the DGCL confers jurisdiction on the Court of Chancery of the State of Delaware; or (d) any action asserting a claim governed by the internal affairs doctrine, except for, as to each of (a) through (d) above, any claim as to which the Court of Chancery determines that there is an indispensable party not subject to the jurisdiction of the Court of Chancery (and the indispensable party does not consent to the personal jurisdiction of the Court of Chancery within ten days following such determination), which is vested in the exclusive jurisdiction of a court or forum other than the Court of Chancery, or for which the Court of Chancery does not have subject matter jurisdiction. The exclusive forum provision also provides that it will not apply to claims arising under the Securities Act, the Exchange Act or other federal securities laws for which there is exclusive federal or concurrent federal and state jurisdiction. Stockholders cannot waive, and will not be deemed to have waived under the exclusive forum provision, the Company’s compliance with the federal securities laws and the rules and regulations thereunder. Although we believe this exclusive forum provision benefits us by providing increased consistency in the application of Delaware law in the types of lawsuits to which it applies, this exclusive forum provision may limit a stockholder’s ability to bring a claim in a judicial forum that it finds favorable for disputes with us or any of our directors, officers, other employees or stockholders, which may discourage lawsuits with respect to such claims. Further, in the event a court finds the exclusive forum provision contained in the Certificate of Incorporation to be unenforceable or inapplicable in an action, we may incur additional costs associated with resolving such action in other jurisdictions, which could harm our business, operating results and financial condition.
Declaration, payment and amounts of dividends, if any, to holders of our shares will be uncertain.
It is expected that we will continue to pay an annual dividend on our common stock, with increases based on the growth of the business as determined by our board of directors. The amount of dividends, if any, that are declared or paid to our stockholders, depends on a number of factors. Our board of directors will have sole discretion to determine whether any dividends will be declared, when dividends, if any, are declared, and the amount of such dividends. We expect that such determination would be based on a number of considerations, including our results of operations and capital management plans and the market price of our shares, the availability of funds, our access to capital markets as well as industry practice and other factors deemed relevant by our board of directors, such as insurance regulatory requirements applicable to our subsidiaries. In addition, our ability to pay dividends and the amount of any dividends ultimately paid in respect of our shares will, in each case, be subject to receiving funds, directly or indirectly, from our operating subsidiaries, AAM and AHL. Furthermore, the ability of these operating subsidiaries to make distributions to us will depend on satisfying applicable law with respect to such distributions and making prior distributions on the AAM and AHL outstanding preferred stock, and the ability of AAM and AHL to receive distributions from their own respective subsidiaries will continue to depend on applicable law with respect to such distributions. There can be no guarantee that our stockholders will receive or be entitled to dividends commensurate with the historical dividends of AAM.
ITEM 1B. UNRESOLVED STAFF COMMENTS
None.
ITEM 2. PROPERTIES
Our principal executive offices are located in leased office space at 9 West 57th Street, New York, New York 10019.
In our asset management business, Apollo also leases the space for our offices in New York, Los Angeles, El Segundo, Carlsbad, Houston, Bethesda, Greenwich, Miami, Palm Beach, London, Frankfurt, Madrid, Luxembourg, Mumbai, Delhi, Singapore, Hong Kong, Shanghai, Tokyo and Sydney, among other locations throughout the world. Apollo does not own any real property.
In our retirement services business, Athene owns its headquarters for U.S. operations, which is located in West Des Moines, Iowa and leases its head office for Bermuda operations, which is located in Hamilton, Bermuda. The retirement services business includes Athene’s Iowa and Bermuda offices.
The Company considers these facilities to be suitable and adequate for the management and operation of its businesses.
54
ITEM 3. LEGAL PROCEEDINGS
See a summary of the Company’s legal proceedings set forth in note 18 to our consolidated financial statements, which is incorporated by reference herein.
ITEM 4. MINE SAFETY DISCLOSURES
Not applicable.
55
PART II
ITEM 5. MARKET FOR REGISTRANT'S COMMON EQUITY, RELATED STOCKHOLDER MATTERS AND ISSUER PURCHASES OF EQUITY SECURITIES
Our common stock is traded on the NYSE under the symbol “APO.”
The number of holders of record of our common stock as of February 24, 2023 was 291. This does not include the number of stockholders that hold stock in “street name” through banks or broker-dealers.
Stock Performance Graph
The following graph depicts the total return to holders of our common stock from the closing price on December 31, 2017 through December 31, 2022, relative to the performance of the S&P 500 Index and the Dow Jones U.S. Asset Managers Index. The graph assumes $100 invested on December 31, 2017 and dividends received reinvested in the security or index.
The performance graph is not intended to be indicative of future performance. The performance graph shall not be deemed “soliciting material” or to be “filed” with the SEC for purposes of Section 18 of the Exchange Act, or otherwise subject to the liabilities under that Section, and shall not be deemed to be incorporated by reference into any of the Company’s filings under the Securities Act or the Exchange Act.
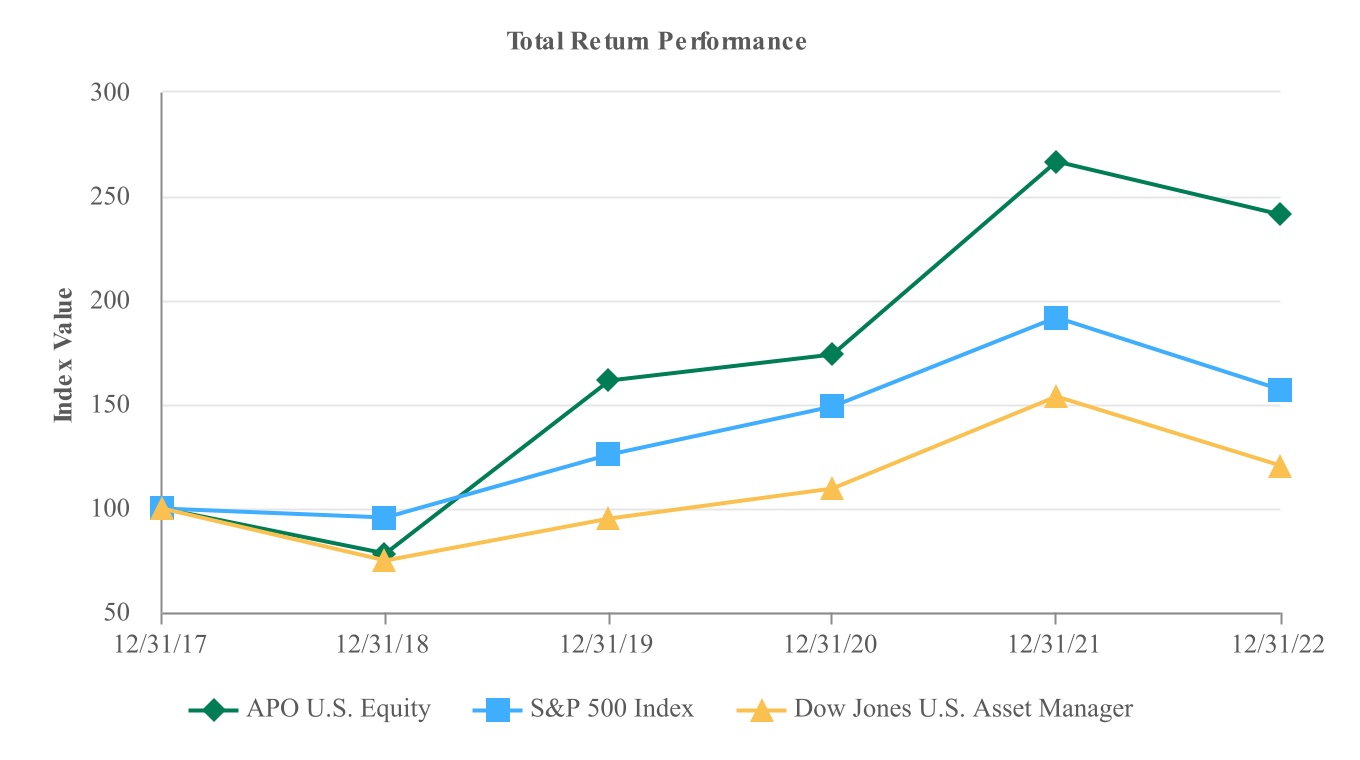
Cash Dividend Policy
The quarterly cash dividend previously paid to our common stockholders can be found in note 15 to our consolidated financial statements. We have also declared a cash dividend of $0.40 per share of common stock in respect to the fourth quarter of 2022 which will be paid on February 28, 2023 to holders of record at the close of business on February 21, 2023.
Our current intention is to pay an annual cash dividend of $1.72 per share of common stock. The declaration and payment of any dividends are at the sole discretion of our board of directors, which may change the dividend policy at any time, including, without limitation, to eliminate the dividend entirely, and will depend upon many factors, including general economic and business conditions, our strategic plans and prospects, our businesses and investment opportunities, our financial condition and operating results, working capital requirements and anticipated cash needs, contractual restrictions and obligations, legal, tax and regulatory restrictions, restrictions and other implications on the payment of dividends by us or by our subsidiaries to us and such other factors as our board of directors may deem relevant. Because AGM is a holding company, the primary source of
56
funds for AGM’s dividends are distributions from its operating subsidiaries, AAM and AHL. Furthermore, the ability of these operating subsidiaries to make distributions to AGM will depend on satisfying applicable law with respect to such distributions and making prior distributions on the AAM and AHL outstanding preferred stock, and the ability of AAM and AHL to receive distributions from their own respective subsidiaries will continue to depend on applicable law with respect to such distributions. See “Item 1A. Risk Factors—Risks Related to Our Common Shares—Declaration, payment and amounts of dividends, if any, to holders of our shares will be uncertain.”
Under the DGCL we may only pay dividends to our stockholders out of (i) our surplus, as defined and computed under the provisions of the DGCL or (ii) our net profits for the fiscal year in which the dividend is declared and/or the preceding fiscal year. Subject to the rights of the holders of preferred shares, if any, and applicable law, our Certificate of Incorporation and Bylaws provide that our board of directors may, in its sole discretion, at any time and from time to time, declare, make and pay dividends to the holders of our common stock. Instruments governing indebtedness that we or our subsidiaries incur in the future may contain restrictions on our or our subsidiaries’ ability to pay dividends or make other cash distributions to equity holders.
Securities Authorized for Issuance Under Equity Compensation Plans
See the table under “Securities Authorized for Issuance Under Equity Compensation Plans” set forth in “Item 12. Security Ownership of Certain Beneficial Owners and Management and Related Stockholder Matters.”
Unregistered Sale of Equity Securities
On October 6, 2022, the Company issued 1,068 restricted shares in connection with its previously announced transaction with Griffin Capital. On November 15, 2022, the Company issued 18,722 restricted shares under the 2019 Omnibus Equity Incentive Plan for Estate Planning Vehicles and 1,360 restricted shares under the 2019 Omnibus Equity Incentive Plan to certain holders of vested performance fee rights. The shares were issued in private placements in reliance on Regulation D or Section 4(a)(2) of the Securities Act.
57
Issuer Purchases of Equity Securities
The following table sets forth information regarding repurchases of shares of common stock during the fiscal quarter ended December 31, 2022.
| Period |
Total number of shares of common stock purchased1
|
Average price paid per share |
Total number of shares of common stock purchased as part of publicly announced plans or programs3
|
Approximate dollar value of common stock that may yet be purchased under the plans or programs | ||||||||||||||||||||||
| October 1, 2022 through October 31, 2022 | ||||||||||||||||||||||||||
| Opportunistic repurchases | 388,077 | 388,077 | ||||||||||||||||||||||||
Equity award-related repurchases2
|
— | — | ||||||||||||||||||||||||
| Total | 388,077 | $ | 47.55 | 388,077 | $ | 1,886,861,783 | ||||||||||||||||||||
| November 1, 2022 through November 30, 2022 | ||||||||||||||||||||||||||
| Opportunistic repurchases | 230,266 | 230,266 | ||||||||||||||||||||||||
Equity award-related repurchases2
|
891,634 | 851,178 | ||||||||||||||||||||||||
| Total | 1,121,900 | $ | 63.51 | 1,081,444 | $ | 1,818,177,094 | ||||||||||||||||||||
| December 1, 2022 through December 31, 2022 | ||||||||||||||||||||||||||
| Opportunistic repurchases | 1,339,734 | 1,339,734 | ||||||||||||||||||||||||
Equity award-related repurchases2
|
— | — | ||||||||||||||||||||||||
| Total | 1,339,734 | $ | 67.80 | 1,339,734 | $ | 1,727,344,512 | ||||||||||||||||||||
| Total | ||||||||||||||||||||||||||
| Opportunistic repurchases | 1,958,077 | 1,958,077 | ||||||||||||||||||||||||
Equity award-related repurchases2
|
891,634 | 851,178 | ||||||||||||||||||||||||
| Total | 2,849,711 | 2,809,255 | ||||||||||||||||||||||||
1 Certain Apollo employees receive a portion of the profit sharing proceeds of certain funds in the form of (a) restricted shares of common stock that they are required to purchase with such proceeds or (b) RSUs, in each case which equity-based awards generally vest over three years. These equity-based awards are granted under the Company's Equity Plan. To prevent dilution on account of these awards, Apollo may, in its discretion, repurchase shares of common stock on the open market and retire them. During the three months ended December 31, 2022, we repurchased 40,456 shares of common stock at an average price paid per share of $63.40 in open-market transactions not pursuant to a publicly-announced repurchase plan or program on account of these awards.
| ||||||||||||||||||||||||||
2 Represents repurchases of shares of common stock in order to offset the dilutive impact of share issuances under the Equity Plan, including reductions of shares of common stock that otherwise would have been issued to participants under the Company’s Equity Plan in order to satisfy associated tax obligations.
| ||||||||||||||||||||||||||
3 Pursuant to a share repurchase program that was publicly announced on January 3, 2022, the Company is authorized to repurchase (i) up to an aggregate of $1.5 billion of shares of its common stock in order to opportunistically reduce its share count and (ii) up to an aggregate of $1.0 billion of shares of its common stock in order to offset the dilutive impact of share issuances under the its equity incentive plans, in each case with the timing and amount of repurchases to depend on a variety of factors, including price, economic and market conditions as well as expected capital needs, evolution in Company’s capital structure, legal requirements and other factors. Under the share repurchase program, repurchases may be of outstanding shares of common stock occurring from time to time in open market transactions, in privately negotiated transactions, pursuant to a trading plan adopted in accordance with Rule 10b5-1 of the Exchange Act, or otherwise, as well as through reductions of shares that otherwise would have been issued to participants under the Company’s Equity Plan in order to satisfy associated tax obligations. The share repurchase program does not obligate the Company to make any repurchases at any specific time. The program is effective until the aggregate repurchase amount that has been approved by the AGM board of directors has been expended. The program may be suspended, extended, modified or discontinued at any time.
| ||||||||||||||||||||||||||
ITEM 6. [RESERVED]
58
ITEM 7. MANAGEMENT’S DISCUSSION AND ANALYSIS OF FINANCIAL CONDITION AND RESULTS OF OPERATIONS
The following discussion should be read in conjunction with Apollo Global Management, Inc.’s consolidated financial statements and the related notes as of December 31, 2022 and 2021 and for the years ended December 31, 2022, 2021 and 2020. This discussion contains forward-looking statements that are subject to known and unknown risks and uncertainties. Actual results and the timing of events may differ significantly from those expressed or implied in such forward-looking statements due to a number of factors, including those included in the section of this report entitled “Item 1A. Risk Factors.” The highlights listed below have had significant effects on many items within our consolidated financial statements and affect the comparison of the current period’s activity with those of prior periods. Target returns included in this report are presented gross and do not account for fees, expenses and taxes, which will reduce returns. Target returns are neither guarantees nor predictions or projections of future performance. There can be no assurance that target returns will be achieved or that Apollo will be successful in implementing the applicable strategy. Actual gross and net returns for funds managed by Apollo, and individual investors participating directly or indirectly in funds managed by Apollo, may vary significantly from the target returns set forth herein.
General
Our Businesses
Founded in 1990, Apollo is a high-growth, global alternative asset manager and a retirement services provider. Apollo conducts its business primarily in the United States through the following three reportable segments: Asset Management, Retirement Services and Principal Investing. These business segments are differentiated based on the investment services they provide as well as varying investing strategies. As of December 31, 2022, Apollo had a team of 2,540 employees and Athene had 1,718 employees.
Asset Management
Our Asset Management segment focuses on three investing strategies: yield, hybrid and equity. We have a flexible mandate in many of the funds we manage which enables the funds to invest opportunistically across a company’s capital structure. We raise, invest and manage funds, accounts and other vehicles on behalf of some of the world’s most prominent pension, endowment and sovereign wealth funds and insurance companies, as well as other institutional and individual investors. As of December 31, 2022, we had total AUM of $547.6 billion.
The yield, hybrid and equity investing strategies of our Asset Management segment reflect the range of investment capabilities across our platform based on relative risk and return. As an asset manager, we earn fees for providing investment management services and expertise to our client base. The amount of fees charged for managing these assets depends on the underlying investment strategy, liquidity profile, and, ultimately, our ability to generate returns for our clients. We also earn capital solutions fees as part of our growing capital solutions business and as part of monitoring and deployment activity alongside our sizeable private equity franchise. After expenses, we call the resulting earnings stream “Fee Related Earnings” or “FRE”, which represents the primary performance measure for the Asset Management segment.
Yield
Yield is our largest asset management strategy with $392.5 billion of AUM as of December 31, 2022. Our yield strategy focuses on generating excess returns through high-quality credit underwriting and origination. Beyond participation in the traditional issuance and secondary credit markets, through our origination platforms and corporate solutions capabilities we seek to originate attractive and safe-yielding assets for the investors in the funds we manage. Within our yield strategy, we target 4% to 10% returns for our clients. Since inception, the total return yield fund has generated a 5% gross Return on Equity (“ROE”) and 4% net ROE annualized through December 31, 2022.
Hybrid
Our hybrid strategy, with $56.4 billion of AUM as of December 31, 2022, brings together our capabilities across debt and equity to seek to offer a differentiated risk-adjusted return with an emphasis on structured downside protected opportunities across asset classes. We target 8% to 15% returns within our hybrid strategy by pursuing investments in all market environments, deploying capital during both periods of dislocation and market strength, and focusing on different investing
59
strategies and asset classes. The flagship hybrid credit hedge fund we manage has generated an 11% gross ROE and a 7% net ROE annualized and the hybrid value funds we manage have generated a 21% gross IRR and a 16% net IRR from inception through December 31, 2022.
Equity
Our equity strategy manages $98.8 billion of AUM as of December 31, 2022. Our equity strategy emphasizes flexibility, complexity, and purchase price discipline to drive opportunistic-like returns for our clients throughout market cycles. Apollo’s equity team has experience across sectors, industries, and geographies in both private equity and real estate equity. Our control equity transactions are principally buyouts, corporate carveouts and distressed investments, while the real estate funds we manage generally transact in single asset, portfolio and platform acquisitions. Within our equity strategy, we target upwards of 15% returns in the funds we manage. We have consistently produced attractive long-term investment returns in the traditional private equity funds we manage, generating a 39% gross IRR and a 24% net IRR on a compound annual basis from inception through December 31, 2022.
Retirement Services
Our retirement services business is conducted by Athene, a leading financial services company that specializes in issuing, reinsuring and acquiring retirement savings products designed for the increasing number of individuals and institutions seeking to fund retirement needs. Athene’s primary product line is annuities, which include fixed, payout and group annuities issued in conjunction with pension group annuity transactions, as well as a newly launched variable annuity product without guarantees. Athene also offers funding agreements, which are comprised of funding agreements issued under its FABN and FABR programs, funding agreements issued to the FHLB and repurchase agreements with an original maturity exceeding one year. Our asset management business provides a full suite of services for Athene’s investment portfolio, including direct investment management, asset allocation, merger and acquisition asset diligence and certain operational support services, including investment compliance, tax, legal and risk management support.
Our retirement services business focuses on generating spread income by combining the two core competencies of (1) sourcing long-term, persistent liabilities and (2) using the global scale and reach of our asset management business to actively source or originate assets with Athene’s preferred risk and return characteristics. Athene’s investment philosophy is to invest a portion of its assets in securities that earn an incremental yield by taking measured liquidity and complexity risk and capitalizing on its long-dated funding profile to prudently achieve higher net investment earned rates, rather than assuming incremental credit risk. A cornerstone of Athene’s investment philosophy is that given the operating leverage inherent in its business, modest investment outperformance can translate to outsized return performance. Because Athene maintains discipline in underwriting attractively priced liabilities, it has the ability to invest in a broad range of high-quality assets to generate attractive earnings.
Principal Investing
Our Principal Investing segment is comprised of our realized performance fee income, realized investment income from our balance sheet investments, and certain allocable expenses related to corporate functions supporting the entire company. The Principal Investing segment also includes our growth capital and liquidity resources at AGM. We expect to deploy capital into strategic investments over time that will help accelerate the growth of our Asset Management segment, by broadening our investment management and/or product distribution capabilities or increasing the efficiency of our operations. We believe these investments will translate into greater compounded annual growth of Fee Related Earnings.
Given the cyclical nature of performance fees, earnings from our Principal Investing segment, or Principal Investing Income (“PII”), is inherently more volatile in nature than earnings from the Asset Management and Retirement Services segments. We earn fees based on the investment performance of the funds we manage and compensate our employees, primarily investment professionals, with a meaningful portion of these proceeds to align our team with the investors in the funds we manage and incentivize them to deliver strong investment performance over time. We expect to increase the proportion of performance fee income we pay to our employees over time, and as such proportion increases, we expect PII to represent a relatively smaller portion of our total company earnings.
60
The diagram below depicts our current organizational structure:
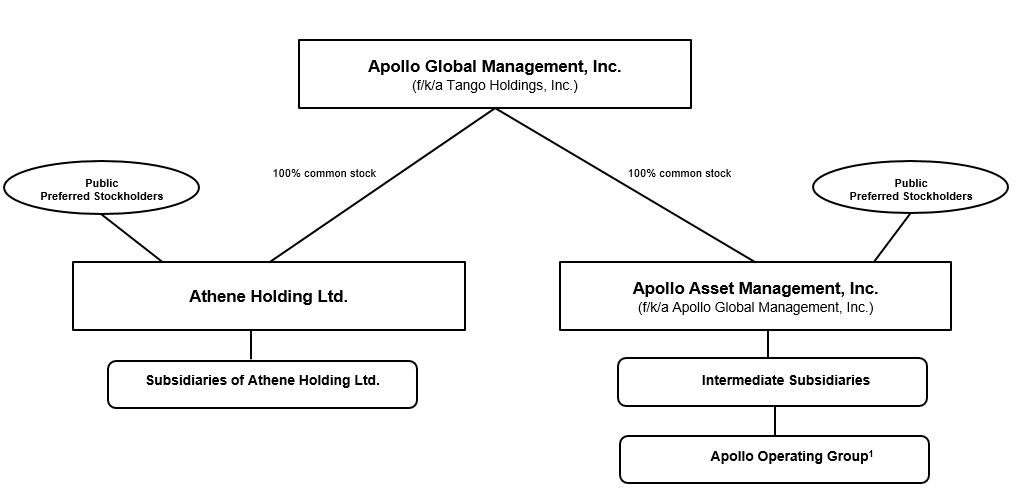
Note: The organizational structure chart above depicts a simplified version of the Apollo structure. It does not include all legal entities in the structure.
(1)Includes direct and indirect ownership by AGM.
Business Environment
Economic and Market Conditions
Our asset management and retirement services businesses are affected by the condition of global financial markets and the economy. Price fluctuations within equity, credit, commodity, foreign exchange markets, as well as interest rates and global inflation, which may be volatile and mixed across geographies, can significantly impact the performance of our business, including, but not limited to, the valuation of investments, including those of the funds we manage, and related income we may recognize.
We carefully monitor economic and market conditions that could potentially give rise to global market volatility and affect our business operations, investment portfolios and derivatives, which includes global inflation.
Adverse economic conditions may result from domestic and global economic and political developments, including plateauing or decreasing economic growth and business activity, civil unrest, geopolitical tensions or military action, such as the armed conflict between Ukraine and Russia and corresponding sanctions imposed by the United States and other countries, and new or evolving legal and regulatory requirements on business investment, hiring, migration, labor supply and global supply chains.
U.S. inflation remained heightened during the fourth quarter of 2022, and the U.S. Federal Reserve continued its interest rate hiking cycle as a result. The U.S. Bureau of Labor Statistics reported that the annual U.S. inflation rate decreased to 6.5% as of December 31, 2022, compared to 7.0% as of December 31, 2021, and 8.2% as of September 30, 2022, as action from the U.S. Federal Reserve is beginning to temper inflation. While beginning to decline, the heightened U.S. inflation rate remains persistent due to a combination of supply and demand factors. As a result, in December 2022, the Federal Reserve raised the benchmark interest rate to a target range of 4.25% to 4.50%, up from a target range of 0% to 0.25% in 2021, which marked the seventh consecutive interest rate hike in 2022.
In the U.S., the S&P 500 Index decreased by 19.4% in 2022, following an increase of 26.9% in 2021. Global equity markets decreased similarly in 2022, with the MSCI All Country World ex USA Index decreasing 13.8%, following an increase of 13.2% in 2021.
61
Conditions in the credit markets have a significant impact on our business. Credit markets were negative in 2022, with the BofAML HY Master II Index decreasing by 11.2%, while the S&P/LSTA Leveraged Loan Index decreased by 0.6%. The U.S. 10-year Treasury yield ended the year at 3.9%.
In terms of economic conditions in the U.S., the Bureau of Economic Analysis reported real GDP increased at an annual rate of 2.1% in 2022, following an increase of 5.9% in 2021. As of January 2023, the International Monetary Fund estimated that the U.S. economy will expand by 1.4% in 2023 and 1.0% in 2024. The U.S. Bureau of Labor Statistics reported that the U.S. unemployment rate decreased to 3.5% as of December 31, 2022.
Foreign exchange rates can materially impact the valuations of our investments and those of the funds we manage as well as Athene’s liabilities that are denominated in currencies other than the U.S. dollar. The U.S. dollar weakened in the fourth quarter of 2022 compared to the euro and the British pound as global central banks worked to combat the increasing yield disparity. Relative to the U.S. dollar, the euro depreciated 5.9% during 2022, after depreciating 6.9% in 2021, while the British pound depreciated 10.7% during 2022, after depreciating 1.0% in 2021. Oil moves also moderated, ending 2022 up 6.7%, after appreciating by 55.0% during 2021, amid a volatile year which included recession fears that counteracted constrained supply and oil export disruptions driven by the ongoing conflict between Ukraine and Russia.
We are actively monitoring the developments in Ukraine resulting from the Russia/Ukraine conflict and the economic sanctions and restrictions imposed against Russia, Belarus, and certain Russian and Belarussian entities and individuals. The Company continues to (i) identify and assess any exposure to designated persons or entities across the Company’s business; (ii) ensure existing surveillance and controls are calibrated to the evolving sanctions; and (iii) ensure appropriate levels of communication across the Company, and with other relevant market participants, as appropriate.
As of December 31, 2022, the funds we manage have no investments that would cause Apollo or any Apollo managed fund to be in violation of current international sanctions, and we believe the direct exposure of investment portfolios of the funds we manage to Russia and Ukraine is insignificant. The Company and the funds we manage do not intend to make any new material investments in Russia, and have appropriate controls in place to ensure review of any new exposure.
Institutional investors continue to allocate capital towards alternative investment managers for more attractive risk-adjusted returns in a low interest rate environment, and we believe the business environment remains generally accommodative to raise larger successor funds, launch new products, and pursue attractive strategic growth opportunities.
Interest Rate Environment
Rates moved meaningfully higher than most predictions for 2022, and this trend continued in the fourth quarter with the U.S. 10-year Treasury reaching levels as high as 4.25% during the quarter. Given the Federal Reserve’s continued focus on curbing inflation and recessionary concerns, it is difficult to predict the level of interest rates and the shape of the yield curve.
With respect to Retirement Services, Athene’s investment portfolio consists predominantly of fixed maturity investments. If prevailing interest rates were to rise, we believe the yield on Athene’s new investment purchases may also rise and Athene’s investment income from floating rate investments would increase, while the value of Athene’s existing investments may decline. If prevailing interest rates were to decline significantly, the yield on Athene’s new investment purchases may decline and Athene’s investment income from floating rate investments would decrease, while the value of Athene’s existing investments may increase.
Athene addresses interest rate risk through managing the duration of the liabilities it sources with assets it acquires through asset liability management (“ALM”) modeling. As part of its investment strategy, Athene purchases floating rate investments, which are expected to perform well in a rising interest rate environment, as was experienced in 2022, and are expected to underperform in a declining rate environment. As of December 31, 2022, Athene’s net invested asset portfolio included $39.3 billion of floating rate investments, or 20% of its net invested assets and its net reserve liabilities included $14.2 billion of floating rate liabilities at notional, or 7% of its net invested assets, resulting in $25.1 billion of net floating rate assets, or 13% of its net invested assets.
If prevailing interest rates were to rise, we believe Athene’s products would be more attractive to consumers and its sales would likely increase. If prevailing interest rates were to decline, it is likely that Athene’s products would be less attractive to consumers and Athene’s sales would likely decrease. In periods of prolonged low interest rates, the net investment spread may be negatively impacted by reduced investment income to the extent that Athene is unable to adequately reduce policyholder
62
crediting rates due to policyholder guarantees in the form of minimum crediting rates or otherwise due to market conditions. A significant majority of Athene’s deferred annuity products have crediting rates that it may reset annually upon renewal following the expiration of the current guaranteed period. While Athene has the contractual ability to lower these crediting rates to the guaranteed minimum levels, its willingness to do so may be limited by competitive pressures.
See “Part II—Item 7A. Quantitative and Qualitative Disclosures About Market Risk,” which includes a discussion regarding interest rate and other significant risks and Athene’s strategies for managing these risks.
Overview of Results of Operations
Financial Measures under U.S. GAAP - Asset Management
The following discussion of financial measures under U.S. GAAP is based on Apollo’s asset management business as of December 31, 2022.
Revenues
Management Fees
The significant growth of the assets we manage has had a positive effect on our revenues. Management fees are typically calculated based upon any of “net asset value,” “gross assets,” “adjusted par asset value,” “adjusted costs of all unrealized portfolio investments,” “capital commitments,” “invested capital,” “adjusted assets,” “capital contributions,” or “stockholders’ equity,” each as defined in the applicable limited partnership agreement and/or management agreement of the unconsolidated funds or accounts.
Advisory and Transaction Fees, Net
As a result of providing advisory services with respect to actual and potential investments, we are entitled to receive fees for transactions related to the acquisition and, in certain instances, disposition and financing of companies, some of which are portfolio companies of the funds we manage, as well as fees for ongoing monitoring of portfolio company operations and directors’ fees. We also receive advisory fees for advisory services provided to certain funds. In addition, monitoring fees are generated on certain structured portfolio company investments. Under the terms of the limited partnership agreements for certain funds, the management fee payable by the funds may be subject to a reduction based on a certain percentage (up to 100%) of such advisory and transaction fees, net of applicable broken deal costs (“Management Fee Offset”). Such amounts are presented as a reduction to advisory and transaction fees, net, in the consolidated statements of operations (see note 2 to our consolidated financial statements for more detail on advisory and transaction fees, net).
Performance Fees
The general partners of the funds we manage are entitled to an incentive return of normally up to 20% of the total returns of a fund’s capital, depending upon performance of the underlying funds and subject to preferred returns and high water marks, as applicable. Performance fees, categorized as performance allocations, are accounted for as an equity method investment, and effectively, the performance fees for any period are based upon an assumed liquidation of the funds’ assets at the reporting date, and distribution of the net proceeds in accordance with the funds’ allocation provisions. Performance fees categorized as incentive fees, which are not accounted as an equity method investment, are deferred until fees are probable to not be significantly reversed. The majority of performance fees are comprised of performance allocations.
As of December 31, 2022, approximately 45% of the value of the investments of the funds we manage, on a gross basis, was determined using market-based valuation methods (i.e., reliance on broker or listed exchange quotes) and the remaining 55% was determined primarily by comparable company and industry multiples or discounted cash flow models. See “Item 1A. Risk Factors—Risks Relating to Our Asset Management Business—The performance of the funds we manage, and our performance, may be adversely affected by the financial performance of portfolio companies of the funds we manage and the industries in which the funds we manage invest” for discussion regarding certain industry-specific risks that could affect the fair value of certain of the portfolio company investments of the funds we manage.
In certain funds we manage, generally in our equity strategy, the Company does not earn performance fees until the investors have achieved cumulative investment returns on invested capital (including management fees and expenses) in excess of an 8%
63
hurdle rate. Additionally, certain of the yield and hybrid funds we manage have various performance fee rates and hurdle rates. Certain of the yield and hybrid funds we manage allocate performance fees to the general partner in a similar manner as the equity funds. In certain funds we manage, as long as the investors achieve their priority returns, there is a catch-up formula whereby the Company earns a priority return for a portion of the return until the Company’s performance fees equate to its incentive fee rate for that fund; thereafter, the Company participates in returns from the fund at the performance fee rate. Performance fees, categorized as performance allocations, are subject to reversal to the extent that the performance fees distributed exceed the amount due to the general partner based on a fund’s cumulative investment returns. The Company recognizes potential repayment of previously received performance fees as a general partner obligation representing all amounts previously distributed to the general partner that would need to be repaid to the Apollo funds if these funds were to be liquidated based on the current fair value of the underlying funds’ investments as of the reporting date. The actual general partner obligation, however, would not become payable or realized until the end of a fund’s life or as otherwise set forth in the respective limited partnership agreement of the fund.
The table below presents an analysis of Apollo’s (i) performance fees receivable on an unconsolidated basis and (ii) realized and unrealized performance fees:
| As of December 31, | Performance Fees for the Year Ended December 31, 2022 |
Performance Fees for the Year Ended December 31, 2021 |
Performance Fees for the Year Ended December 31, 2020 |
||||||||||||||||||||||||||||||||||||||||||||||||||||||||||||||
| 2022 | 2021 | ||||||||||||||||||||||||||||||||||||||||||||||||||||||||||||||||
| (In millions) | Performance Fees Receivable on an Unconsolidated Basis | Unrealized | Realized | Total | Unrealized | Realized | Total | Unrealized | Realized | Total | |||||||||||||||||||||||||||||||||||||||||||||||||||||||
| AIOF I and II | $ | 10.7 | $ | 16.0 | $ | (5.3) | $ | 26.8 | $ | 21.5 | $ | 3.2 | $ | 16.1 | $ | 19.3 | $ | (5.4) | $ | 15.4 | $ | 10.0 | |||||||||||||||||||||||||||||||||||||||||||
ANRP I, II and III1
|
33.5 | 89.9 | (66.0) | 2.7 | (63.3) | 109.9 | 51.8 | 161.7 | (21.4) | 0.3 | (21.1) | ||||||||||||||||||||||||||||||||||||||||||||||||||||||
EPF Funds1
|
71.4 | 135.2 | (79.0) | 47.5 | (31.5) | 57.3 | 44.7 | 102.0 | (148.8) | 35.0 | (113.8) | ||||||||||||||||||||||||||||||||||||||||||||||||||||||
| FCI Funds | 138.1 | 139.3 | (1.2) | — | (1.2) | 66.6 | — | 66.6 | (9.3) | — | (9.3) | ||||||||||||||||||||||||||||||||||||||||||||||||||||||
| Fund IX | 1,261.8 | 768.2 | 493.6 | 200.3 | 693.9 | 614.4 | 389.1 | 1,003.5 | 153.8 | — | 153.8 | ||||||||||||||||||||||||||||||||||||||||||||||||||||||
| Fund VIII | 369.2 | 726.2 | (357.0) | 22.0 | (335.0) | (74.2) | 671.6 | 597.4 | 84.8 | — | 84.8 | ||||||||||||||||||||||||||||||||||||||||||||||||||||||
Fund VII2
|
39.8 | 77.3 | (37.7) | 44.4 | 6.7 | 182.3 | 49.4 | 231.7 | (7.4) | 0.5 | (6.9) | ||||||||||||||||||||||||||||||||||||||||||||||||||||||
| Fund VI | 17.7 | 16.3 | (1.3) | 2.7 | 1.4 | (1.6) | — | (1.6) | — | 0.7 | 0.7 | ||||||||||||||||||||||||||||||||||||||||||||||||||||||
Fund IV and Fund V1
|
— | — | 0.3 | — | 0.3 | (0.5) | — | (0.5) | (0.6) | — | (0.6) | ||||||||||||||||||||||||||||||||||||||||||||||||||||||
| HVF I | 43.8 | 106.1 | (62.2) | 116.3 | 54.1 | 53.6 | 65.3 | 118.9 | 52.8 | 19.8 | 72.6 | ||||||||||||||||||||||||||||||||||||||||||||||||||||||
| Real Estate Equity | 62.8 | 42.1 | 22.0 | 18.1 | 40.1 | 27.5 | 0.7 | 28.2 | (28.2) | 12.4 | (15.8) | ||||||||||||||||||||||||||||||||||||||||||||||||||||||
| Corporate Credit | 19.4 | 18.3 | 3.6 | 19.4 | 23.0 | 4.4 | 15.8 | 20.2 | 1.4 | 8.8 | 10.2 | ||||||||||||||||||||||||||||||||||||||||||||||||||||||
| Structured Finance and ABS | 85.5 | 98.8 | (3.9) | 23.5 | 19.6 | 46.3 | 33.4 | 79.7 | 2.7 | 13.0 | 15.7 | ||||||||||||||||||||||||||||||||||||||||||||||||||||||
| Direct Origination | 145.5 | 108.8 | 36.2 | 34.9 | 71.1 | 50.0 | 23.5 | 73.5 | (10.2) | 11.0 | 0.8 | ||||||||||||||||||||||||||||||||||||||||||||||||||||||
Other1,3
|
382.9 | 432.6 | 55.6 | 108.1 | 163.7 | 175.0 | 433.2 | 608.2 | (27.0) | 173.9 | 146.9 | ||||||||||||||||||||||||||||||||||||||||||||||||||||||
| Total | $ | 2,682.1 | $ | 2,775.1 | $ | (2.3) | $ | 666.7 | $ | 664.4 | $ | 1,314.2 | $ | 1,794.6 | $ | 3,108.8 | $ | 37.2 | $ | 290.8 | $ | 328.0 | |||||||||||||||||||||||||||||||||||||||||||
Total, net of profit sharing payable4/expense
|
$ | 1,380.1 | $ | 1,431.0 | $ | (17.4) | $ | 129.7 | $ | 112.3 | $ | 811.5 | $ | 807.8 | $ | 1,619.3 | $ | 1.4 | $ | 96.8 | $ | 98.2 | |||||||||||||||||||||||||||||||||||||||||||
1 As of December 31, 2022, certain funds had $106.5 million in general partner obligations to return previously distributed performance fees. The fair value gain on investments and income at the fund level needed to reverse the general partner obligations was $1.7 billion as of December 31, 2022.
| |||||||||||||||||||||||||||||||||||||||||||||||||||||||||||||||||
2 As of December 31, 2022, the remaining investments and escrow cash of Fund VII was valued at 112% of the fund’s unreturned capital, which was below the required escrow ratio of 115%. As a result, the fund is required to place in escrow current and future performance fee distributions to the general partner until the specified return ratio of 115% is met (at the time of a future distribution) or upon liquidation. As of December 31, 2022, Fund VII had $85.5 million of gross performance fees or $48.7 million net of profit sharing, in escrow. With respect to Fund VII, realized performance fees currently distributed to the general partner are limited to potential tax distributions and interest on escrow balances per the fund’s partnership agreements. Performance fees receivable as of December 31, 2022 and realized performance fees for the year ended December 31, 2022 include interest earned on escrow balances that is not subject to contingent repayment.
| |||||||||||||||||||||||||||||||||||||||||||||||||||||||||||||||||
3 Other includes certain SIAs.
| |||||||||||||||||||||||||||||||||||||||||||||||||||||||||||||||||
4 There was a corresponding profit sharing payable of $1.3 billion as of December 31, 2022, including profit sharing payable related to amounts in escrow and contingent consideration obligations of $55.0 million.
| |||||||||||||||||||||||||||||||||||||||||||||||||||||||||||||||||
The general partners of certain of the funds we manage accrue performance fees, categorized as performance allocations, when the fair value of investments exceeds the cost basis of the individual investors’ investments in the fund, including any allocable share of expenses incurred in connection with such investments, which we refer to as “high water marks.” These high water marks are applied on an individual investor basis. Certain of the funds we manage have investors with various high water marks, the achievement of which is subject to market conditions and investment performance.
Performance fees from certain funds we manage are subject to contingent repayment by the general partner in the event of future losses to the extent that the cumulative performance fees distributed from inception to date exceeds the amount computed
64
as due to the general partner at the final distribution. These general partner obligations, if applicable, are included in due to related parties on the consolidated statements of financial condition.
The following table summarizes our performance fees since inception through December 31, 2022:
Performance Fees Since Inception1
|
|||||||||||||||||||||||||||||
| Undistributed by Fund and Recognized |
Distributed by Fund and Recognized2
|
Total Undistributed and Distributed by Fund and Recognized3
|
General Partner Obligation3
|
Maximum Performance Fees Subject to Potential Reversal4
|
|||||||||||||||||||||||||
| (in millions) | |||||||||||||||||||||||||||||
| AIOF I and II | $ | 10.7 | $ | 58.4 | $ | 69.1 | $ | — | $ | 38.3 | |||||||||||||||||||
| ANRP I, II and III | 33.5 | 159.1 | 192.6 | 21.5 | 48.6 | ||||||||||||||||||||||||
| EPF Funds | 71.4 | 484.7 | 556.1 | 41.4 | 321.2 | ||||||||||||||||||||||||
| FCI Funds | 138.1 | 24.2 | 162.3 | — | 138.1 | ||||||||||||||||||||||||
| Fund IX | 1,261.8 | 589.5 | 1,851.3 | — | 1,640.6 | ||||||||||||||||||||||||
| Fund VIII | 369.2 | 1,660.8 | 2,030.0 | — | 1,425.0 | ||||||||||||||||||||||||
| Fund VII | 39.8 | 3,225.7 | 3,265.5 | — | 14.6 | ||||||||||||||||||||||||
| Fund VI | 17.7 | 1,663.9 | 1,681.6 | — | — | ||||||||||||||||||||||||
| Fund IV and Fund V | — | 2,053.1 | 2,053.1 | 31.4 | — | ||||||||||||||||||||||||
| HVF I | 43.8 | 201.4 | 245.2 | — | 142.5 | ||||||||||||||||||||||||
| Real Estate Equity | 62.8 | 75.3 | 138.1 | — | 77.5 | ||||||||||||||||||||||||
| Corporate Credit | 19.4 | 926.2 | 945.6 | — | 10.0 | ||||||||||||||||||||||||
| Structured Finance and ABS | 85.5 | 52.2 | 137.7 | — | 61.7 | ||||||||||||||||||||||||
| Direct Origination | 145.5 | 73.3 | 218.8 | — | 134.2 | ||||||||||||||||||||||||
Other5
|
382.9 | 1,692.6 | 2,075.5 | 12.2 | 563.6 | ||||||||||||||||||||||||
| Total | $ | 2,682.1 | $ | 12,940.4 | $ | 15,622.5 | $ | 106.5 | $ | 4,615.9 | |||||||||||||||||||
1 Certain funds are denominated in euros and historical figures are translated into U.S. dollars at an exchange rate of €1.00 to $1.07 as of December 31, 2022. Certain funds are denominated in pounds sterling and historical figures are translated into U.S. dollars at an exchange rate of £1.00 to $1.21 as of December 31, 2022.
| |||||||||||||||||||||||||||||
2 Amounts in “Distributed by Fund and Recognized” for the Citi Property Investors (“CPI”), Gulf Stream Asset Management, LLC (“Gulf Stream”), Stone Tower Capital LLC and its related companies (“Stone Tower”) funds and SIAs are presented for activity subsequent to the respective acquisition dates. Amounts exclude certain performance fees from business development companies and Redding Ridge Holdings LP (“Redding Ridge Holdings”), an affiliate of Redding Ridge.
| |||||||||||||||||||||||||||||
3 Amounts were computed based on the fair value of fund investments on December 31, 2022. Performance fees have been allocated to and recognized by the general partner. Based on the amount allocated, a portion is subject to potential reversal or, to the extent applicable, has been reduced by the general partner obligation to return previously distributed performance fees at December 31, 2022. The actual determination and any required payment of any such general partner obligation would not take place until the final disposition of the fund’s investments based on contractual termination of the fund.
| |||||||||||||||||||||||||||||
4 Represents the amount of performance fees that would be reversed if remaining fund investments became worthless on December 31, 2022. Amounts subject to potential reversal of performance fees include amounts undistributed by a fund (i.e., the performance fees receivable), as well as a portion of the amounts that have been distributed by a fund, net of taxes and not subject to a general partner obligation to return previously distributed performance fees, except for those funds that are gross of taxes as defined in the respective funds’ governing documents.
| |||||||||||||||||||||||||||||
5 Other includes certain SIAs.
| |||||||||||||||||||||||||||||
Expenses
Compensation and Benefits
The most significant expense in our asset management business is compensation and benefits expense. This consists of fixed salary, discretionary and non-discretionary bonuses, profit sharing expense associated with the performance fees earned and compensation expense associated with the vesting of non-cash equity-based awards.
Our compensation arrangements with certain employees contain a significant performance-based incentive component. Therefore, as our net revenues increase, our compensation costs rise. Our compensation costs also reflect the increased investment in people as we expand geographically and create new funds.
In addition, certain professionals and selected other individuals have a profit sharing interest in the performance fees earned in order to better align their interests with our own and with those of the investors in the funds we manage. Profit sharing expense is part of our compensation and benefits expense and is generally based upon a fixed percentage of performance fees. Certain of
65
our performance-based incentive arrangements provide for compensation based on realized performance fees which includes fees earned by the general partners of the funds we manage under the applicable fund limited partnership agreements based upon transactions that have closed or other rights to incentive income cash that have become fixed in the applicable calendar year period. Profit sharing expense can reverse during periods when there is a decline in performance fees that were previously recognized. Profit sharing amounts are normally distributed to employees after the corresponding investment gains have been realized and generally before preferred returns are achieved for the investors. Therefore, changes in our unrealized performance fees have the same effect on our profit sharing expense. Profit sharing expense increases when unrealized performance fees increase. Realizations only impact profit sharing expense to the extent that the effects on investments have not been recognized previously. If losses on other investments within a fund are subsequently realized, the profit sharing amounts previously distributed are normally subject to a general partner obligation to return performance fees previously distributed back to the funds. This general partner obligation due to the funds would be realized only when the fund is liquidated, which generally occurs at the end of the fund’s term. However, indemnification obligations also exist for realized gains with respect to Fund IV, Fund V and Fund VI, which, although our Former Managing Partners and Contributing Partners would remain personally liable, may indemnify our Former Managing Partners and Contributing Partners for 17.5% to 100% of the previously distributed profits regardless of the fund’s future performance. See note 17 to our consolidated financial statements for further information regarding the Company’s indemnification liability.
The Company grants equity awards to certain employees, including RSUs and restricted shares of common stock, that generally vest and become exercisable in quarterly installments or annual installments depending on the award terms. In some instances, vesting of an RSU is also subject to the Company’s receipt of performance fees, within prescribed periods, sufficient to cover the associated equity-based compensation expense. See note 14 to our consolidated financial statements for further discussion of equity-based compensation.
Other expenses
The balance of our other expenses includes interest, placement fees, and general, administrative and other operating expenses. Interest expense consists primarily of interest related to the 2024 Senior Notes, the 2026 Senior Notes, the 2029 Senior Notes, the 2030 Senior Notes, the 2048 Senior Notes and the 2050 Subordinated Notes as discussed in note 13 to our consolidated financial statements. Placement fees are incurred in connection with our capital raising activities. In cases where the limited partners of the funds are determined to be the customer in an arrangement, placement fees may be capitalized as a cost to acquire a customer contract, and amortized over the life of the customer contract. General, administrative and other expenses includes occupancy expense, depreciation and amortization, professional fees and costs related to travel, information technology and administration. Occupancy expense represents charges related to office leases and associated expenses, such as utilities and maintenance fees. Depreciation and amortization of fixed assets is normally calculated using the straight-line method over their estimated useful lives, ranging from two to sixteen years, taking into consideration any residual value. Leasehold improvements are amortized over the shorter of the useful life of the asset or the expected term of the lease. Intangible assets are amortized based on the future cash flows over the expected useful lives of the assets.
Other Income (Loss)
Net Gains (Losses) from Investment Activities
Net gains (losses) from investment activities include both realized gains and losses and the change in unrealized gains and losses in our investment portfolio between the opening reporting date and the closing reporting date. Net unrealized gains (losses) are a result of changes in the fair value of unrealized investments and reversal of unrealized gains (losses) due to dispositions of investments during the reporting period. Significant judgment and estimation goes into the assumptions that drive these models and the actual values realized with respect to investments could be materially different from values obtained based on the use of those models. The valuation methodologies applied impact the reported value of investment company holdings and their underlying portfolios in our consolidated financial statements.
Net Gains (Losses) from Investment Activities of Consolidated Variable Interest Entities (“VIEs”)
Changes in the fair value of the consolidated VIEs’ assets and liabilities and related interest, dividend and other income and expenses subsequent to consolidation are presented within net gains (losses) from investment activities of consolidated variable interest entities and are attributable to non-controlling interests in the consolidated statements of operations.
66
Other Income (Losses), Net
Other income (losses), net includes gains (losses) arising from the remeasurement of foreign currency denominated assets and liabilities, remeasurement of the tax receivable agreement liability and other miscellaneous non-operating income and expenses.
Financial Measures under U.S. GAAP - Retirement Services
The following discussion of financial measures under U.S. GAAP is based on the Company’s retirement services business which is operated by Athene as of December 31, 2022.
Revenues
Premiums
Premiums for long-duration contracts, including products with fixed and guaranteed premiums and benefits, are recognized as revenue when due from policyholders. Insurance revenues are reported net of amounts ceded.
Product charges
Revenues for universal life-type policies and investment contracts, including surrender and market value adjustments, costs of insurance, policy administration, GMDB, GLWB and no-lapse guarantee charges, are earned when assessed against policyholder account balances during the period.
Net investment income
Net investment income is a significant component of Athene’s total revenues. Athene recognizes investment income as it accrues or is legally due, net of investment management and custody fees. Investment income on fixed maturity securities includes coupon interest, as well as the amortization of any premium and the accretion of any discount. Investment income on equity securities represents dividend income and preferred coupon interest.
Investment related gains (losses)
Investment related gains (losses) primarily consist of (i) realized gains and losses on sales of investments, (ii) unrealized gains or losses relating to identified risks within AFS securities in fair value hedging relationships, (iii) gains and losses on trading securities, (iv) gains and losses on equity securities, (v) change in the fair value of the embedded derivatives and derivatives not designated as a hedge, (vi) change in fair value of mortgage loan assets and (vii) allowance for expected credit losses recorded through the provision for credit losses.
Expenses
Interest sensitive contract benefits
Universal life-type policies and investment contracts include fixed indexed and traditional fixed annuities in the accumulation phase, funding agreements, universal life insurance, fixed indexed universal life insurance and immediate annuities without significant mortality risk (which includes pension group annuities without life contingencies). Liabilities for traditional fixed annuities, universal life insurance and funding agreements are carried at the account balances without reduction for potential surrender or withdrawal charges, except for a block of universal life business ceded to Global Atlantic which is carried at fair value. Fixed indexed annuities and fixed indexed universal life insurance contracts contain an embedded derivative. Benefits reserves for fixed indexed annuities and fixed indexed universal life insurance contracts are reported as the sum of the fair value of the embedded derivative and the host (or guaranteed) component of the contracts. Liabilities for immediate annuities without significant mortality risk are calculated as the present value of future liability cash flows and policy maintenance expenses discounted at contractual interest rates.
Changes in the interest sensitive contract liabilities, excluding deposits and withdrawals, are recorded in interest sensitive contract benefits or product charges on the consolidated statements of operations.
67
Future policy and other policy benefits
Athene issues contracts classified as long-duration, which includes term and whole life, accident and health, disability, and deferred and immediate annuities with life contingencies (which includes pension group annuities with life contingencies). Liabilities for non-participating long-duration contracts are established using accepted actuarial valuation methods which require the use of assumptions related to expenses, investment yields, mortality, morbidity and persistency at the date of issue or acquisition.
Changes in future policy benefits other than the adjustment for the OCI effects of unrealized investment gains and losses on AFS securities, are recorded in future policy and other policy benefits on the consolidated statements of operations.
Amortization of deferred acquisition costs, deferred sales inducements, and value of business acquired
Costs related directly to the successful acquisition of new or renewal insurance or investment contracts are deferred to the extent they are recoverable from future premiums or gross profits. These costs consist of commissions and policy issuance costs, as well as sales inducements credited to policyholder account balances.
Deferred costs related to investment contracts without significant revenue streams from sources other than investment of the policyholder funds are amortized using the effective interest method. Deferred costs related to universal life-type policies and investment contracts with significant revenue streams from sources other than investment of the policyholder funds are amortized over the lives of the policies, based upon the proportion of the present value of actual and expected deferred costs to the present value of actual and expected gross profits to be earned over the life of the policies. VOBA associated with acquired contracts is amortized in relation to applicable policyholder liabilities.
Policy and other operating expenses
Policy and other operating expenses includes normal operating expenses, policy acquisition expenses, interest expense, dividends to policyholders, integration, restructuring and other non-operating expenses, and stock compensation expenses.
Other Financial Measures under U.S. GAAP
Income Taxes
Significant judgment is required in determining the provision for income taxes and in evaluating income tax positions, including evaluating uncertainties. We recognize the income tax benefits of uncertain tax positions only where the position is “more likely than not” to be sustained upon examination, including resolution of any related appeals or litigation, based on the technical merits of the positions. The tax benefit is measured as the largest amount of benefit that has a greater than 50% likelihood of being realized upon ultimate settlement. If a tax position is not considered more likely than not to be sustained, then no benefits of the position are recognized. The Company’s income tax positions are reviewed and evaluated quarterly to determine whether or not we have uncertain tax positions that require financial statement recognition or de-recognition.
Deferred tax assets and liabilities are recognized for the expected future tax consequences, using currently enacted tax rates, of differences between the carrying amount of assets and liabilities and their respective tax basis. The effect on deferred tax assets and liabilities of a change in tax rates is recognized in income in the period when the change is enacted. Deferred tax assets are reduced by a valuation allowance when it is more likely than not that some portion or all of the deferred tax assets will not be realized.
Non-Controlling Interests
For entities that are consolidated, but not 100% owned, a portion of the income or loss and corresponding equity is allocated to owners other than Apollo. The aggregate of the income or loss and corresponding equity that is not owned by the Company is included in non-controlling interests in the consolidated financial statements. Non-controlling interests primarily include limited partner interests in certain consolidated funds and VIEs. Prior to the Mergers on January 1, 2022, the non-controlling interests relating to Apollo Global Management, Inc. also included the ownership interest in the Apollo Operating Group held by the Former Managing Partners and Contributing Partners through their limited partner interests in AP Professional Holdings, L.P. and the non-controlling interest in the Apollo Operating Group held by Athene.
68
The authoritative guidance for non-controlling interests in the consolidated financial statements requires reporting entities to present non-controlling interest as equity and provides guidance on the accounting for transactions between an entity and non-controlling interests. According to the guidance, (1) non-controlling interests are presented as a separate component of stockholders’ equity on the Company’s consolidated statements of financial condition, (2) net income (loss) includes the net income (loss) attributable to the non-controlling interest holders on the Company’s consolidated statements of operations, (3) the primary components of non-controlling interest are separately presented in the Company’s consolidated statements of changes in stockholders’ equity to clearly distinguish the interests in the Apollo Operating Group and other ownership interests in the consolidated entities and (4) profits and losses are allocated to non-controlling interests in proportion to their ownership interests regardless of their basis.
Results of Operations
Below is a discussion of our consolidated results of operations for the years ended December 31, 2022, 2021 and 2020. For additional analysis of the factors that affected our results at the segment level, see “—Segment Analysis” below:
| For the Years Ended December 31, | Total Change |
Percentage Change |
For the Years Ended December 31, | Total Change |
Percentage Change |
||||||||||||||||||||||||||||||||||||||||||
| 2022 | 2021 | 2021 | 2020 | ||||||||||||||||||||||||||||||||||||||||||||
| (In millions) | (In millions) | ||||||||||||||||||||||||||||||||||||||||||||||
| Revenues | |||||||||||||||||||||||||||||||||||||||||||||||
| Asset Management | |||||||||||||||||||||||||||||||||||||||||||||||
| Management fees | $ | 1,503 | $ | 1,921 | $ | (418) | (21.8)% | $ | 1,921 | $ | 1,687 | $ | 234 | 13.9% | |||||||||||||||||||||||||||||||||
| Advisory and transaction fees, net | 443 | 302 | 141 | 46.7 | 302 | 249 | 53 | 21.3 | |||||||||||||||||||||||||||||||||||||||
| Investment income (loss) | 796 | 3,699 | (2,903) | (78.5) | 3,699 | 393 | 3,306 | NM | |||||||||||||||||||||||||||||||||||||||
| Incentive fees | 27 | 29 | (2) | (6.9) | 29 | 25 | 4 | 16.0 | |||||||||||||||||||||||||||||||||||||||
| 2,769 | 5,951 | (3,182) | (53.5) | 5,951 | 2,354 | 3,597 | 152.8 | ||||||||||||||||||||||||||||||||||||||||
| Retirement Services | |||||||||||||||||||||||||||||||||||||||||||||||
| Premiums | 11,638 | — | 11,638 | NM | — | — | — | NM | |||||||||||||||||||||||||||||||||||||||
| Product charges | 718 | — | 718 | NM | — | — | — | NM | |||||||||||||||||||||||||||||||||||||||
| Net investment income | 8,148 | — | 8,148 | NM | — | — | — | NM | |||||||||||||||||||||||||||||||||||||||
| Investment related gains (losses) | (12,717) | — | (12,717) | NM | — | — | — | NM | |||||||||||||||||||||||||||||||||||||||
| Revenues of consolidated variable interest entities | 440 | — | 440 | NM | — | — | — | NM | |||||||||||||||||||||||||||||||||||||||
| Other revenues | (28) | — | (28) | NM | — | — | — | NM | |||||||||||||||||||||||||||||||||||||||
| 8,199 | — | 8,199 | NM | — | — | — | NM | ||||||||||||||||||||||||||||||||||||||||
| Total Revenues | 10,968 | 5,951 | 5,017 | 84.3 | 5,951 | 2,354 | 3,597 | 152.8 | |||||||||||||||||||||||||||||||||||||||
| Expenses | |||||||||||||||||||||||||||||||||||||||||||||||
| Asset Management | |||||||||||||||||||||||||||||||||||||||||||||||
| Compensation and benefits: | |||||||||||||||||||||||||||||||||||||||||||||||
| Salary, bonus and benefits | 927 | 778 | 149 | 19.2 | 778 | 628 | 150 | 23.9 | |||||||||||||||||||||||||||||||||||||||
| Equity-based compensation | 484 | 1,181 | (697) | (59.0) | 1,181 | 213 | 968 | 454.5 | |||||||||||||||||||||||||||||||||||||||
| Profit sharing expense | 532 | 1,534 | (1,002) | (65.3) | 1,534 | 248 | 1,286 | NM | |||||||||||||||||||||||||||||||||||||||
| Total compensation and benefits | 1,943 | 3,493 | (1,550) | (44.4) | 3,493 | 1,089 | 2,404 | 220.8 | |||||||||||||||||||||||||||||||||||||||
| Interest expense | 124 | 138 | (14) | (10.1) | 138 | 133 | 5 | 3.8 | |||||||||||||||||||||||||||||||||||||||
| General, administrative and other | 682 | 482 | 200 | 41.5 | 482 | 357 | 125 | 35.0 | |||||||||||||||||||||||||||||||||||||||
| 2,749 | 4,113 | (1,364) | (33.2) | 4,113 | 1,579 | 2,534 | 160.5 | ||||||||||||||||||||||||||||||||||||||||
| Retirement Services | |||||||||||||||||||||||||||||||||||||||||||||||
| Interest sensitive contract benefits | 541 | — | 541 | NM | — | — | — | NM | |||||||||||||||||||||||||||||||||||||||
| Future policy and other policy benefits | 12,310 | — | 12,310 | NM | — | — | — | NM | |||||||||||||||||||||||||||||||||||||||
| Amortization of deferred acquisition costs, deferred sales inducements and value of business acquired | 509 | — | 509 | NM | — | — | — | NM | |||||||||||||||||||||||||||||||||||||||
| Policy and other operating expenses | 1,371 | — | 1,371 | NM | — | — | — | NM | |||||||||||||||||||||||||||||||||||||||
| 14,731 | — | 14,731 | NM | — | — | — | NM | ||||||||||||||||||||||||||||||||||||||||
| Total Expenses | 17,480 | 4,113 | 13,367 | 325.0 | 4,113 | 1,579 | 2,534 | 160.5 | |||||||||||||||||||||||||||||||||||||||
69
| For the Years Ended December 31, | Total Change |
Percentage Change |
For the Years Ended December 31, | Total Change |
Percentage Change |
||||||||||||||||||||||||||||||||||||||||||
| 2022 | 2021 | 2021 | 2020 | ||||||||||||||||||||||||||||||||||||||||||||
| (In millions) | (In millions) | ||||||||||||||||||||||||||||||||||||||||||||||
Other income (loss) – Asset Management |
|||||||||||||||||||||||||||||||||||||||||||||||
| Net gains (losses) from investment activities | 165 | 2,611 | (2,446) | (93.7) | 2,611 | (455) | 3,066 | NM | |||||||||||||||||||||||||||||||||||||||
| Net gains (losses) from investment activities of consolidated variable interest entities | 494 | 557 | (63) | (11.3) | 557 | 197 | 360 | 182.7 | |||||||||||||||||||||||||||||||||||||||
| Other income (loss), net | 38 | (145) | 183 | NM | (145) | 36 | (181) | NM | |||||||||||||||||||||||||||||||||||||||
| Total Other income (loss) | 697 | 3,023 | (2,326) | (76.9) | 3,023 | (222) | 3,245 | NM | |||||||||||||||||||||||||||||||||||||||
| Income (loss) before income tax (provision) benefit | (5,815) | 4,861 | (10,676) | NM | 4,861 | 553 | 4,308 | NM | |||||||||||||||||||||||||||||||||||||||
| Income tax (provision) benefit | 1,069 | (594) | 1,663 | NM | (594) | (86) | (508) | NM | |||||||||||||||||||||||||||||||||||||||
| Net income (loss) | (4,746) | 4,267 | (9,013) | NM | 4,267 | 467 | 3,800 | NM | |||||||||||||||||||||||||||||||||||||||
| Net (income) loss attributable to non-controlling interests | 1,533 | (2,428) | 3,961 | NM | (2,428) | (310) | (2,118) | NM | |||||||||||||||||||||||||||||||||||||||
| Net income (loss) attributable to Apollo Global Management, Inc. | (3,213) | 1,839 | (5,052) | NM | 1,839 | 157 | 1,682 | NM | |||||||||||||||||||||||||||||||||||||||
| Preferred stock dividends | — | (37) | 37 | (100.0) | (37) | (37) | — | — | |||||||||||||||||||||||||||||||||||||||
| Net income (loss) available to Apollo Global Management, Inc. common stockholders | $ | (3,213) | $ | 1,802 | $ | (5,015) | NM | $ | 1,802 | $ | 120 | $ | 1,682 | NM | |||||||||||||||||||||||||||||||||
Note: “NM” denotes not meaningful. Changes from negative to positive amounts and positive to negative amounts are not considered meaningful. Increases or decreases from zero and changes greater than 500% are also not considered meaningful. | |||||||||||||||||||||||||||||||||||||||||||||||
A discussion of our consolidated results of operations for the year ended December 31, 2021 as compared to the year ended December 31, 2020 is included in the Company’s Annual Report on Form 10-K filed with the SEC on February 25, 2022 (the “2021 Annual Report”).
Year Ended December 31, 2022 Compared to Year Ended December 31, 2021
In this section, references to 2022 refer to the year ended December 31, 2022 and references to 2021 refer to the year ended December 31, 2021.
Asset Management
Revenues
Revenues were $2.8 billion in 2022, a decrease of $3.2 billion from $6.0 billion in 2021 primarily due to lower investment income (loss) and, to a lesser extent, a decrease in management fees. Investment income (loss) decreased $2.9 billion in 2022 to $796 million compared to $3.7 billion in 2021. The decrease in investment income (loss) of $2.9 billion in 2022 was primarily driven by decreases in performance allocations.
Significant drivers for performance allocations in 2021 were performance allocations earned from Fund IX, Fund VIII and Fund VII of $1.2 billion, $650 million and $232 million, respectively, primarily as a result of fund appreciation and realization activity. Significant drivers for performance allocations in 2022 were performance allocations primarily earned from Fund IX of $711 million, partially offset by performance allocation losses from Fund VIII of $349 million, as a result of continued equity market volatility in 2022.
See below for details on the respective funds’ performance allocations in 2022.
The performance allocations earned from Fund IX in 2022 were primarily driven by appreciation and realization of the fund’s investments in the consumer services, leisure and media, telecom and technology sectors.
The performance allocation losses from Fund VIII in 2022 were primarily driven by depreciation in the value of the fund’s investments in the consumer services, leisure and media, telecom and technology sectors.
Management fees decreased by $418 million to $1.5 billion in 2022 from $1.9 billion in 2021. The decrease for 2022 was primarily driven by the elimination of management fees between AAM and Athene subsidiaries upon consolidation, as a result of the Mergers. The decrease was partially offset by increases in management fees earned from Apollo Diversified Real Estate
70
Fund and Apollo Diversified Credit Fund (collectively “ADREF and ADCF”) of $66 million, as a result of the management fee contribution from the Griffin Capital U.S. asset management business acquisition, and from MidCap of $35 million, driven by higher Fee-Generating AUM.
The decreases in investment income (loss) and management fees were offset, in part, by an increase in advisory and transaction fees. Advisory and transaction fees increased by $141 million to $443 million in 2022 from $302 million in 2021. Advisory and transaction fees earned during 2022 were primarily attributable to advisory and transaction fees earned from companies in the consumer services, financial services, healthcare, energy, leisure, manufacturing and consumer and retail sectors, as well as structuring fees earned from companies in the financial services, entertainment and real estate sectors.
Expenses
Expenses were $2.7 billion in 2022, a decrease of $1.4 billion from $4.1 billion in 2021 due to a decrease in profit sharing expense of $1.0 billion resulting from the corresponding lower investment income (loss) during 2022. In any period, the blended profit sharing percentage is impacted by the respective profit sharing ratios of the funds generating performance allocations in the period. Additionally, there was a decrease in equity-based compensation of $697 million as there were one-time equity-based awards granted in connection with the Company’s compensation reset in 2021. This decrease was partially offset by an increase in salary, bonus and benefits of $149 million due to accelerated headcount growth in 2022, including for certain senior level roles, as the Company strategically invests in talent that will seek to capture its next phase of growth. Equity-based compensation expense in 2022 is comprised of: i) performance grants which are tied to the Company’s receipt of performance fees, within prescribed periods and are typically recognized on an accelerated recognition method over the requisite service period to the extent the performance revenue metrics are met or deemed probable, and ii) the impact of the 2021 one-time grants awarded to the Co-Presidents, which vest on a cliff basis subject to continued employment over five years and the Company’s achievement of FRE and SRE per share metrics.
General, administrative and other expenses were $682 million in 2022, an increase of $200 million from $482 million in 2021. The increase in 2022 was primarily driven by increases in the depreciation and amortization expense associated with the Company’s commitment asset and other depreciable assets, higher travel and entertainment expenses and the absorption of occupancy expense to support the Company’s increased headcount, including from the acquisition of Griffin Capital’s U.S. asset management business.
Other Income (Loss)
Other income (loss) was $697 million in 2022, a decrease of $2.3 billion from $3.0 billion in 2021. This decrease was primarily driven by a decrease in net gains (losses) from investment activities, as a result of AAM no longer holding an interest in Athene Holding following the Mergers. Other income (loss) in 2022 was primarily attributable to net gains from investment activities of consolidated VIEs and income earned as a result of APSG I’s deconsolidation event. Other income (loss) in 2021 was primarily due to net gains from investment activities from the Company’s investment in Athene Holding during 2021.
Retirement Services
Revenues
Retirement Services revenues were $8.2 billion in 2022. Revenues were primarily driven by pension group annuity premiums, net investment income and product charges, partially offset by the adverse impact from investment related losses. Investment related losses of $12.7 billion were primarily driven by unfavorable changes in the fair value of reinsurance assets, FIA hedging derivatives, mortgage loans, trading and equity securities, realized losses on AFS securities and an increase in the provision for credit losses, partially offset by foreign exchange derivative gains. The losses on Retirement Services’ assets were primarily due to an increase in U.S. Treasury rates and credit spread widening in 2022. The change in fair value of FIA hedging derivatives decreased due to the unfavorable performance of the indices upon which Athene’s call options are based as the largest percentage of call options are based on the S&P 500 index, which decreased 19.4% in 2022. The unfavorable change in the provision for credit losses was primarily driven by unfavorable economics. The foreign exchange derivative gains were primarily driven by the strengthening of the U.S. dollar in 2022 for assets denominated in foreign currencies.
71
Expenses
Retirement Services expenses were $14.7 billion in 2022. Expenses were primarily driven by pension group annuity and payout annuity obligations, policy and other operating expenses, interest credited to policyholders, interest paid on funding agreements and the amortization of DAC and VOBA, partially offset by a decrease in the change in FIA fair value embedded derivatives and negative VOBA amortization. The change in FIA fair value embedded derivatives was primarily due to the performance of the equity indices to which Athene’s FIA policies are linked, primarily the S&P 500 index, which decreased 19.4% in 2022, as well as the favorable change in discount rates and favorable unlocking, partially offset by unfavorable economics impacting policyholder projected benefits. The FIA fair value embedded derivatives unlocking in 2022 was $41 million favorable due to changes to projected interest crediting, partially offset by the impact of higher rates on future account values.
Income Tax (Provision) Benefit
The Company’s income tax (provision) benefit totaled $1.1 billion and $(594) million in 2022 and 2021, respectively. The change to the provision was primarily related to the decrease in pre-tax income and a tax benefit from the derecognition of a deferred tax liability related to the Mergers. The provision for income taxes includes federal, state, local and foreign income taxes resulting in an effective income tax rate of 18.4% and 12.2% for 2022 and 2021, respectively. The most significant reconciling items between the U.S. federal statutory income tax rate and the effective income tax rate were due to the following: (i) a benefit realized from the derecognition of a deferred tax liability related to the Company’s historical holdings in Athene, (ii) foreign, state and local income taxes, including NYC UBT, (iii) income attributable to non-controlling interests and (iv) equity-based compensation net of the limiting provisions for executive compensation under IRC Section 162(m) (see note 12 to the consolidated financial statements for further details regarding the Company’s income tax provision).
Managing Business Performance - Key Segment and Non-U.S. GAAP Performance Measures
We believe that the presentation of Adjusted Segment Income supplements a reader’s understanding of the economic operating performance of each of our segments.
Adjusted Segment Income and Adjusted Net Income
Adjusted Segment Income, or “ASI”, is the key performance measure used by management in evaluating the performance of the Asset Management, Retirement Services, and Principal Investing segments. See note 20 to the consolidated financial statements for more details regarding the components of ASI and management’s consideration of ASI.
We believe that ASI is helpful for an understanding of our business and that investors should review the same supplemental financial measure that management uses to analyze our segment performance. This measure supplements and should be considered in addition to and not in lieu of the results of operations discussed below in “—Overview of Results of Operations” that have been prepared in accordance with U.S. GAAP.
Adjusted Net Income (“ANI”) represents Adjusted Segment Income less HoldCo interest and other financing costs and estimated income taxes. For purposes of calculating the Adjusted Net Income tax rate, Adjusted Segment Income is reduced by HoldCo interest and financing costs. Income taxes on FRE and PII represents the total current corporate, local, and non-U.S. taxes as well as the current payable under Apollo’s tax receivable agreement. Income taxes on FRE and PII excludes the impacts of deferred taxes and the remeasurement of the tax receivable agreement, which arise from changes in estimated future tax rates. Certain assumptions and methodologies that impact the implied FRE and PII income tax provision are similar to those used under U.S. GAAP. Specifically, certain deductions considered in the income tax provision under U.S. GAAP relating to transaction related charges, equity-based compensation, and tax deductible interest expense are taken into account for the implied tax provision. Income Taxes on SRE represent the total current and deferred tax expense or benefit on income before taxes adjusted to eliminate the impact of the tax expense or benefit associated with the non-operating adjustments. Management believes the methodologies used to compute income taxes on FRE, SRE, and PII are meaningful to each segment and increases comparability of income taxes between periods.
Fee Related Earnings, Spread Related Earnings and Principal Investing Income
Fee Related Earnings, or “FRE”, is a component of ASI that is used as a supplemental performance measure to assess the performance of the Asset Management segment.
72
Spread Related Earnings, or “SRE”, is a component of ASI that is used as a supplemental performance measure to assess the performance of the Retirement Services segment, excluding certain market volatility and certain expenses related to integration, restructuring, equity-based compensation, and other expenses.
Principal Investing Income, or “PII”, is a component of ASI that is used as a supplemental performance measure to assess the performance of the Principal Investing segment.
See note 20 to the consolidated financial statements for more details regarding the components of FRE, SRE, and PII.
We use ASI, ANI, FRE, SRE and PII as measures of operating performance, not as measures of liquidity. These measures should not be considered in isolation or as a substitute for net income or other income data prepared in accordance with U.S. GAAP. The use of these measures without consideration of their related U.S. GAAP measures is not adequate due to the adjustments described above.
Net Invested Assets
In managing its business, Athene analyzes net invested assets, which does not correspond to total Athene investments, including investments in related parties, as disclosed in the consolidated statements of financial condition and notes thereto. Net invested assets represent the investments that directly back its net reserve liabilities as well as surplus assets. Net invested assets is used in the computation of net investment earned rate, which is used to analyze the profitability of Athene’s investment portfolio. Net invested assets includes (a) total investments on the consolidated statements of financial condition with AFS securities at cost or amortized cost, excluding derivatives, (b) cash and cash equivalents and restricted cash, (c) investments in related parties, (d) accrued investment income, (e) VIE and VOE assets, liabilities and non-controlling interest adjustments, (f) net investment payables and receivables, (g) policy loans ceded (which offset the direct policy loans in total investments) and (h) an adjustment for the allowance for credit losses. Net invested assets also excludes assets associated with funds withheld liabilities related to business exited through reinsurance agreements and derivative collateral (offsetting the related cash positions). Athene includes the underlying investments supporting its assumed funds withheld and modco agreements in its net invested assets calculation in order to match the assets with the income received. Athene believes the adjustments for reinsurance provide a view of the assets for which it has economic exposure. Net invested assets includes Athene’s proportionate share of ACRA investments, based on its economic ownership, but does not include the proportionate share of investments associated with the non-controlling interest. Net invested assets are averaged over the number of quarters in the relevant period to compute a net investment earned rate for such period. While Athene believes net invested assets is a meaningful financial metric and enhances the understanding of the underlying drivers of its investment portfolio, it should not be used as a substitute for Athene’s total investments, including related parties, presented under U.S. GAAP.
73
Segment Analysis
Discussed below are our results of operations for each of our reportable segments. They represent the segment information available and utilized by management to assess performance and to allocate resources. See note 20 to our consolidated financial statements for more information regarding our segment reporting.
Asset Management
The following table presents Fee Related Earnings, the performance measure of our Asset Management segment.
| Years ended December 31, | Total Change | Percentage Change | Years ended December 31, | Total Change | Percentage Change | ||||||||||||||||||||||||||||||||||||||||||
| 2022 | 2021 | 2021 | 2020 | ||||||||||||||||||||||||||||||||||||||||||||
| (In millions) | (In millions) | ||||||||||||||||||||||||||||||||||||||||||||||
| Asset Management: | |||||||||||||||||||||||||||||||||||||||||||||||
| Management fees - Yield | $ | 1,416.0 | $ | 1,172.0 | $ | 244.0 | 20.8% | $ | 1,172.0 | $ | 957.3 | $ | 214.7 | 22.4% | |||||||||||||||||||||||||||||||||
| Management fees - Hybrid | 211.3 | 184.8 | 26.5 | 14.3 | 184.8 | 137.2 | 47.6 | 34.7 | |||||||||||||||||||||||||||||||||||||||
| Management fees - Equity | 507.2 | 521.4 | (14.2) | (2.7) | 521.4 | 553.5 | (32.1) | (5.8) | |||||||||||||||||||||||||||||||||||||||
| Management fees | 2,134.5 | 1,878.2 | 256.3 | 13.6 | 1,878.2 | 1,648.0 | 230.2 | 14.0 | |||||||||||||||||||||||||||||||||||||||
| Capital solutions fees and other, net | 413.5 | 298.1 | 115.4 | 38.7 | 298.1 | 251.5 | 46.6 | 18.5 | |||||||||||||||||||||||||||||||||||||||
| Fee-related performance fees | 71.5 | 56.9 | 14.6 | 25.7 | 56.9 | 9.8 | 47.1 | 480.6 | |||||||||||||||||||||||||||||||||||||||
| Fee-related compensation | (753.5) | (653.3) | (100.2) | 15.3 | (653.3) | (532.6) | (120.7) | (22.7) | |||||||||||||||||||||||||||||||||||||||
| Other operating expenses | (456.0) | (313.2) | (142.8) | 45.6 | (313.2) | (275.1) | (38.1) | (13.8) | |||||||||||||||||||||||||||||||||||||||
| Fee Related Earnings (FRE) | $ | 1,410.0 | $ | 1,266.7 | $ | 143.3 | 11.3% | $ | 1,266.7 | $ | 1,101.6 | $ | 165.1 | 15.0% | |||||||||||||||||||||||||||||||||
In this section, references to 2022 refer to the year ended December 31, 2022, references to 2021 refer to the year ended December 31, 2021, and references to 2020 refer to the year ended December 31, 2020.
Year Ended December 31, 2022 Compared to Year Ended December 31, 2021
FRE was $1.4 billion in 2022, an increase of $143 million compared to $1.3 billion in 2021. This increase was primarily attributable to the continued growth in management fees, and record capital solutions fees and other, net. The increase in management fees was primarily attributable to management fees earned from Athene of $172 million and ADREF and ADCF of $66 million, as a result of higher fee-generating AUM and the management fee contribution from the Griffin Capital U.S. asset management business acquisition, respectively. Capital solutions fees earned in 2022 were primarily attributable to fees earned from companies in the consumer services, financial services, healthcare, energy, leisure, manufacturing, consumer and retail, business services, entertainment and real estate sectors. The growth in revenues was offset, in part, by increases in fee-related compensation expense associated with the re-basing of cost structure to support the Company’s next phase of growth, as well as costs associated with Griffin Capital’s U.S. asset management business.
Year Ended December 31, 2021 Compared to Year Ended December 31, 2020
FRE was $1.3 billion in 2021, an increase of $165 million compared to $1.1 billion in 2020. This increase was primarily attributable to the growth in management fees of $230 million in 2022. The increase in management fees was primarily attributable to management fees earned from Athene and Athora of $160 million and $49 million, respectively. The growth in revenues was offset, in part, by higher fee-related compensation expense due to an increase in headcount and increases in depreciation and amortization expenses, occupancy costs and recruiting fees, as we continued to expand our global team in 2021.
Asset Management Operating Metrics
We monitor certain operating metrics that are common to the alternative asset management industry and directly impact the performance of our Asset Management segment. These operating metrics include Assets Under Management, gross capital deployment and uncalled commitments.
74
Assets Under Management
The following presents Apollo’s Total AUM and Fee-Generating AUM by investing strategy (in billions):
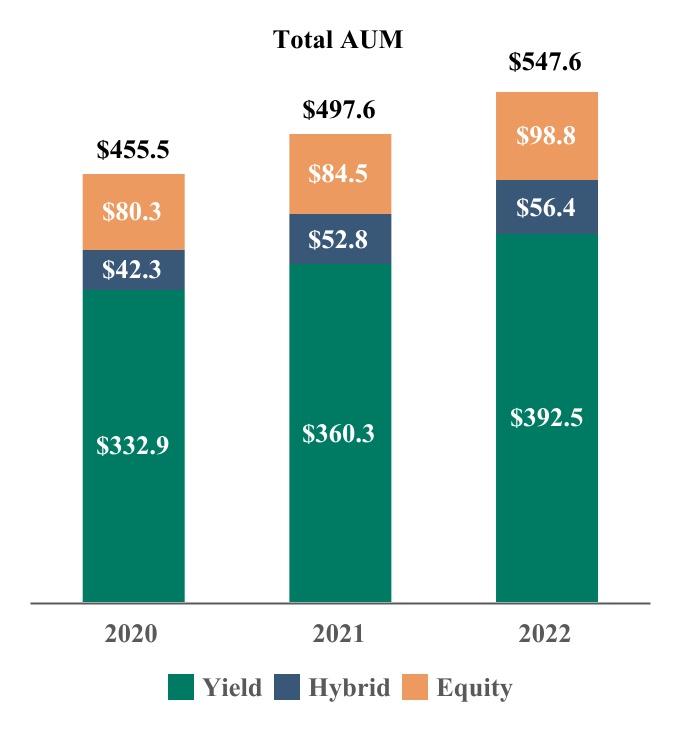
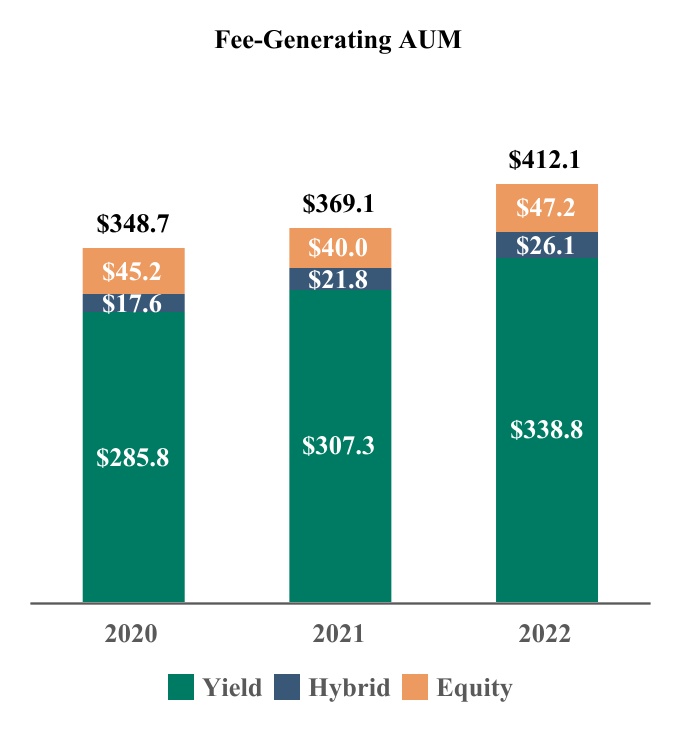 Note: Totals may not add due to rounding
The following presents Apollo’s AUM with Future Management Fee Potential by investing strategy (in billions):
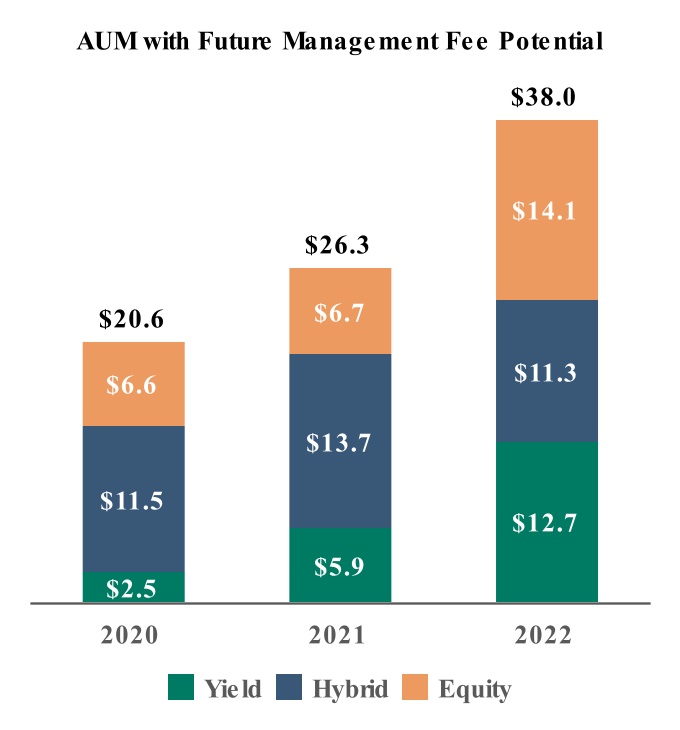
Note: Totals may not add due to rounding
75
The following tables present the components of Performance Fee-Eligible AUM for each of Apollo’s three investing strategies within the Asset Management segment:
| As of December 31, 2022 | |||||||||||||||||||||||
| Yield | Hybrid | Equity | Total | ||||||||||||||||||||
| (In millions) | |||||||||||||||||||||||
Performance Fee-Generating AUM 1
|
$ | 40,169 | $ | 12,177 | $ | 42,126 | $ | 94,472 | |||||||||||||||
| AUM Not Currently Generating Performance Fees | 15,912 | 17,777 | 3,166 | 36,855 | |||||||||||||||||||
| Uninvested Performance Fee-Eligible AUM | 4,628 | 12,839 | 30,836 | 48,303 | |||||||||||||||||||
| Total Performance Fee-Eligible AUM | $ | 60,709 | $ | 42,793 | $ | 76,128 | $ | 179,630 | |||||||||||||||
| As of December 31, 2021 | |||||||||||||||||||||||
| Yield | Hybrid | Equity | Total | ||||||||||||||||||||
| (In millions) | |||||||||||||||||||||||
Performance Fee-Generating AUM 1
|
$ | 37,756 | $ | 17,663 | $ | 37,447 | $ | 92,866 | |||||||||||||||
| AUM Not Currently Generating Performance Fees | 2,355 | 4,971 | 3,614 | 10,940 | |||||||||||||||||||
| Uninvested Performance Fee-Eligible AUM | 2,644 | 16,478 | 21,075 | 40,197 | |||||||||||||||||||
| Total Performance Fee-Eligible AUM | $ | 42,755 | $ | 39,112 | $ | 62,136 | $ | 144,003 | |||||||||||||||
1 Performance Fee-Generating AUM of $3.9 billion and $5.2 billion as of December 31, 2022 and December 31, 2021, respectively, are above the hurdle rates or preferred returns and have been deferred to future periods when the fees are probable to not be significantly reversed.
| |||||||||||||||||||||||
The components of Fee-Generating AUM by investing strategy are presented below:
| As of December 31, 2022 | |||||||||||||||||||||||
| Yield | Hybrid | Equity | Total | ||||||||||||||||||||
| (In millions) | |||||||||||||||||||||||
| Fee-Generating AUM based on capital commitments | $ | — | $ | 2,531 | $ | 19,434 | $ | 21,965 | |||||||||||||||
| Fee-Generating AUM based on invested capital | 3,381 | 9,528 | 26,695 | 39,604 | |||||||||||||||||||
| Fee-Generating AUM based on gross/adjusted assets | 293,240 | 4,827 | 593 | 298,660 | |||||||||||||||||||
| Fee-Generating AUM based on NAV | 42,200 | 9,227 | 431 | 51,858 | |||||||||||||||||||
| Total Fee-Generating AUM | $ | 338,821 | $ | 26,113 | $ | 47,153 | 1 |
$ | 412,087 | ||||||||||||||
1 The weighted average remaining life of the traditional private equity funds as of December 31, 2022 was 76 months.
| |||||||||||||||||||||||
| As of December 31, 2021 | |||||||||||||||||||||||
| Yield | Hybrid | Equity | Total | ||||||||||||||||||||
| (In millions) | |||||||||||||||||||||||
| Fee-Generating AUM based on capital commitments | $ | — | $ | 3,580 | $ | 27,277 | $ | 30,857 | |||||||||||||||
| Fee-Generating AUM based on invested capital | 2,321 | 6,826 | 12,075 | 21,222 | |||||||||||||||||||
| Fee-Generating AUM based on gross/adjusted assets | 273,695 | 4,293 | 406 | 278,394 | |||||||||||||||||||
| Fee-Generating AUM based on NAV | 31,290 | 7,146 | 192 | 38,628 | |||||||||||||||||||
| Total Fee-Generating AUM | $ | 307,306 | $ | 21,845 | $ | 39,950 | 1 |
$ | 369,101 | ||||||||||||||
1 The weighted average remaining life of the traditional private equity funds as of December 31, 2021 was 64 months.
| |||||||||||||||||||||||
Apollo, through its consolidated subsidiary, ISG, provides asset management services to Athene with respect to assets in the accounts owned by or related to Athene (“Athene Accounts”), including asset allocation services, direct asset management services, asset and liability matching management, mergers and acquisitions, asset diligence, hedging and other asset management services and receives management fees for providing these services. The Company, through ISG, also provides sub-allocation services with respect to a portion of the assets in the Athene Accounts. Apollo, through its asset management business, managed or advised $236.0 billion and $212.6 billion of AUM on behalf of Athene as of December 31, 2022 and 2021, respectively.
Apollo, through ISGI, provides investment advisory services with respect to certain assets in certain portfolio companies of Apollo funds and sub-advises the Athora Accounts and broadly refers to “Athora Sub-Advised” assets as those assets in the Athora Accounts which the Company explicitly sub-advises as well as those assets in the Athora Accounts which are invested
76
directly in funds and investment vehicles Apollo manages. The Company refers to the portion of the Athora AUM that is not Athora Sub-Advised AUM as “Athora Non-Sub Advised” AUM. See note 17 to the consolidated financial statements for more details regarding the fee arrangements with respect to the assets in the Athora Accounts. Apollo managed or advised $52.6 billion and $59.0 billion of AUM on behalf of Athora as of December 31, 2022 and 2021, respectively.
The following tables summarize changes in total AUM for each of Apollo’s three investing strategies within the Asset Management segment:
| For the Years Ended December 31, | |||||||||||||||||||||||||||||||||||||||||||||||
| 2022 | 2021 | ||||||||||||||||||||||||||||||||||||||||||||||
| Yield | Hybrid | Equity | Total | Yield | Hybrid | Equity | Total | ||||||||||||||||||||||||||||||||||||||||
| (in millions) | |||||||||||||||||||||||||||||||||||||||||||||||
Change in Total AUM1:
|
|||||||||||||||||||||||||||||||||||||||||||||||
| Beginning of Period | $ | 360,289 | $ | 52,772 | $ | 84,491 | $ | 497,552 | $ | 332,880 | $ | 42,317 | $ | 80,289 | $ | 455,486 | |||||||||||||||||||||||||||||||
| Inflows | 93,676 | 10,982 | 23,617 | 128,275 | 55,537 | 12,599 | 7,347 | 75,483 | |||||||||||||||||||||||||||||||||||||||
Outflows2
|
(38,132) | (1,487) | (859) | (40,478) | (22,470) | (759) | (1,664) | (24,893) | |||||||||||||||||||||||||||||||||||||||
| Net Flows | 55,544 | 9,495 | 22,758 | 87,797 | 33,067 | 11,840 | 5,683 | 50,590 | |||||||||||||||||||||||||||||||||||||||
| Realizations | (8,625) | (6,554) | (11,447) | (26,626) | (2,911) | (5,004) | (17,811) | (25,726) | |||||||||||||||||||||||||||||||||||||||
Market Activity3
|
(14,742) | 697 | 2,969 | (11,076) | (2,747) | 3,619 | 16,330 | 17,202 | |||||||||||||||||||||||||||||||||||||||
| End of Period | $ | 392,466 | $ | 56,410 | $ | 98,771 | $ | 547,647 | $ | 360,289 | $ | 52,772 | $ | 84,491 | $ | 497,552 | |||||||||||||||||||||||||||||||
1 At the individual strategy level, inflows include new subscriptions, commitments, capital raised, other increases in available capital, purchases, acquisitions and portfolio company appreciation. Outflows represent redemptions, other decreases in available capital and portfolio company depreciation. Realizations represent fund distributions of realized proceeds. Market activity represents gains (losses), the impact of foreign exchange rate fluctuations and other income.
| |||||||||||||||||||||||||||||||||||||||||||||||
2 Outflows for Total AUM include redemptions of $4.4 billion and $2.7 billion during the years ended December 31, 2022 and 2021, respectively.
| |||||||||||||||||||||||||||||||||||||||||||||||
3 Includes foreign exchange impacts of $(6.2) billion and $(5.8) billion during the years ended December 31, 2022 and 2021, respectively.
| |||||||||||||||||||||||||||||||||||||||||||||||
Year Ended December 31, 2022
Total AUM was $547.6 billion at December 31, 2022, an increase of $50.1 billion, or 10.1%, compared to $497.6 billion at December 31, 2021. The net increase was primarily due to growth of our retirement services assets, subscriptions across the platform, increased leverage, and the acquisition of Griffin Capital’s U.S. asset management business; partially offset by distributions driven by a one-time release of unfunded commitments, and market activity across our yield strategy due to foreign exchange depreciation and market related changes. More specifically, the net increase was due to:
•Net flows of $87.8 billion primarily attributable to:
•a $55.5 billion increase related to funds we manage in our yield strategy primarily consisting of (i) $21.3 billion related to the growth of our retirement services clients, (ii) $19.7 billion of subscriptions mostly related to the corporate credit funds we manage, (iii) a $14.9 billion increase in leverage, and (iv) $6.5 billion related to the acquisition of Griffin Capital’s U.S. asset management business; partially offsetting these increases were (i) $(4.3) billion of net transfers and (ii) $(3.0) billion of redemptions primarily in the corporate credit funds we manage;
•a $9.5 billion increase related to funds we manage in our hybrid strategy due to (i) $7.5 billion of fundraising primarily across the hybrid credit and hybrid value funds we manage, and (ii) $1.3 billion of net transfers primarily from the yield strategy; and
•a $22.8 billion increase related to funds we manage in our equity strategy primarily consisting of (i) $19.2 billion of fundraising primarily related to the traditional private equity funds we manage, and (ii) $3.0 billion of net transfers primarily from the yield strategy.
•Realizations of $(26.6) billion primarily attributable to:
•$(8.6) billion related to funds we manage in our yield strategy primarily consisting of a $5.8 billion one-time release of unfunded commitments;
•$(6.6) billion related to funds we manage in our hybrid strategy primarily consisting of distributions from the hybrid credit and illiquid opportunistic funds we manage; and
•$(11.4) billion related to funds we manage in our equity strategy primarily consisting of distributions across the traditional private equity funds we manage.
77
•Market activity of $(11.1) billion primarily attributable to:
•$(14.7) billion related to funds we manage in our yield strategy primarily consisting of $(14.0) billion driven by Athora and $(4.6) billion related to our corporate credit funds; partially offset by activity related to funds we manage in our equity strategy of $3.0 billion.
The following tables summarize changes in Fee-Generating AUM for each of Apollo’s three investing strategies within the Asset Management segment:
| For the Years Ended December 31, | |||||||||||||||||||||||||||||||||||||||||||||||
| 2022 | 2021 | ||||||||||||||||||||||||||||||||||||||||||||||
| Yield | Hybrid | Equity | Total | Yield | Hybrid | Equity | Total | ||||||||||||||||||||||||||||||||||||||||
| (in millions) | |||||||||||||||||||||||||||||||||||||||||||||||
Change in Fee-Generating AUM1:
|
|||||||||||||||||||||||||||||||||||||||||||||||
| Beginning of Period | $ | 307,306 | $ | 21,845 | $ | 39,950 | $ | 369,101 | $ | 285,830 | $ | 17,622 | $ | 45,222 | $ | 348,674 | |||||||||||||||||||||||||||||||
| Inflows | 81,797 | 9,497 | 19,757 | 111,051 | 49,767 | 7,575 | 2,282 | 59,624 | |||||||||||||||||||||||||||||||||||||||
Outflows2
|
(36,564) | (3,563) | (10,215) | (50,342) | (23,936) | (3,414) | (3,303) | (30,653) | |||||||||||||||||||||||||||||||||||||||
| Net Flows | 45,233 | 5,934 | 9,542 | 60,709 | 25,831 | 4,161 | (1,021) | 28,971 | |||||||||||||||||||||||||||||||||||||||
| Realizations | (1,300) | (1,869) | (2,211) | (5,380) | (1,958) | (948) | (3,967) | (6,873) | |||||||||||||||||||||||||||||||||||||||
Market Activity3
|
(12,418) | 203 | (128) | (12,343) | (2,397) | 1,010 | (284) | (1,671) | |||||||||||||||||||||||||||||||||||||||
| End of Period | $ | 338,821 | $ | 26,113 | $ | 47,153 | $ | 412,087 | $ | 307,306 | $ | 21,845 | $ | 39,950 | $ | 369,101 | |||||||||||||||||||||||||||||||
1 At the individual strategy level, inflows include new subscriptions, commitments, capital raised, other increases in available capital, purchases, acquisitions and portfolio company appreciation. Outflows represent redemptions, other decreases in available capital and portfolio company depreciation. Realizations represent fund distributions of realized proceeds. Market activity represents gains (losses), the impact of foreign exchange rate fluctuations and other income.
| |||||||||||||||||||||||||||||||||||||||||||||||
2 Outflows for Fee-Generating AUM include redemptions of $3.5 billion and $2.5 billion during the years ended December 31, 2022 and 2021, respectively.
| |||||||||||||||||||||||||||||||||||||||||||||||
3 Includes foreign exchange impacts of $(4.4) billion and $(4.9) billion during the years ended December 31, 2022 and 2021, respectively.
| |||||||||||||||||||||||||||||||||||||||||||||||
Year Ended December 31, 2022
Total Fee-Generating AUM was $412.1 billion at December 31, 2022, an increase of $43.0 billion, or 11.6%, compared to $369.1 billion at December 31, 2021. The net increase was primarily due to growth of our retirement services assets, deployment and fee commencement, fundraising, and the acquisition of Griffin Capital’s U.S. asset management business. This increase was partially offset by market activity across our yield strategy due to foreign exchange depreciation, market related changes and realizations. More specifically, the net increase was due to:
•Net flows of $60.7 billion primarily attributable to:
•a $45.2 billion increase related to funds we manage in our yield strategy primarily consisting of (i) a $21.3 billion increase in AUM related to the growth of our retirement services clients, (ii) $16.6 billion of fee-generating capital deployment primarily related to the corporate credit funds we manage and Athora, (iii) $6.5 billion related to the acquisition of Griffin Capital’s U.S. asset management business, and (iv) $6.2 billion of subscriptions primarily related to the corporate credit and corporate fixed income funds we manage; partially offset by $(3.0) billion of redemptions mostly related to the corporate credit funds we manage and $(1.2) billion of net transfers;
•a $5.9 billion increase related to funds we manage in our hybrid strategy primarily due to (i) $6.7 billion of fee-generating capital deployment across the hybrid credit and hybrid value funds we manage, (ii) $1.7 billion of subscriptions primarily related to the hybrid credit funds we manage, and (iii) $1.0 billion of transfers primarily from the yield strategy; offset by ($3.0) billion of fee-generating capital reductions related to the financial credit instruments strategy; and
•a $9.5 billion increase related to funds we manage in our equity strategy primarily related to (i) $15.3 billion of fee-generating capital deployment driven by Fund X’s fee commencement and (ii) $3.6 billion of fundraising; partially offset by $(10.2) billion of fee-generating capital reductions driven by the change in Fund IX’s fee basis from committed capital to invested capital.
78
•Net flows were partially offset by:
•$(12.3) billion of market activity primarily related to funds we manage in our yield strategy, consisting of $(11.7) billion related to Athora and $(3.3) billion related to the corporate credit funds we manage; and
•$(5.4) billion of realizations across the yield, hybrid and equity strategies.
Gross Capital Deployment and Uncalled Commitments
Gross capital deployment represents the gross capital that has been invested in investments by the funds and accounts we manage during the relevant period, but excludes certain investment activities primarily related to hedging and cash management functions at the Company. Gross Capital Deployment is not reduced or netted down by sales or refinancings, and takes into account leverage used by the funds and accounts we manage in gaining exposure to the various investments that they have made.
Uncalled commitments, by contrast, represent unfunded capital commitments that certain of Apollo’s funds have received from fund investors to fund future or current fund investments and expenses.
Gross capital deployment and uncalled commitments are indicative of the pace and magnitude of fund capital that is deployed or will be deployed, and which therefore could result in future revenues that include management fees, transaction fees and performance fees to the extent they are fee-generating. Gross capital deployment and uncalled commitments can also give rise to future costs that are related to the hiring of additional resources to manage and account for the additional capital that is deployed or will be deployed. Management uses gross capital deployment and uncalled commitments as key operating metrics since we believe the results are measures of investment activities of the funds we manage.
The following presents gross capital deployment and uncalled commitments (in billions):
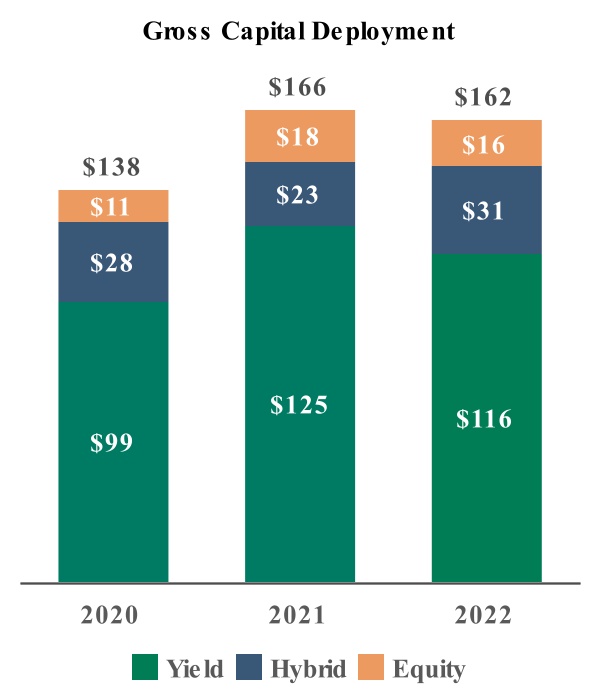
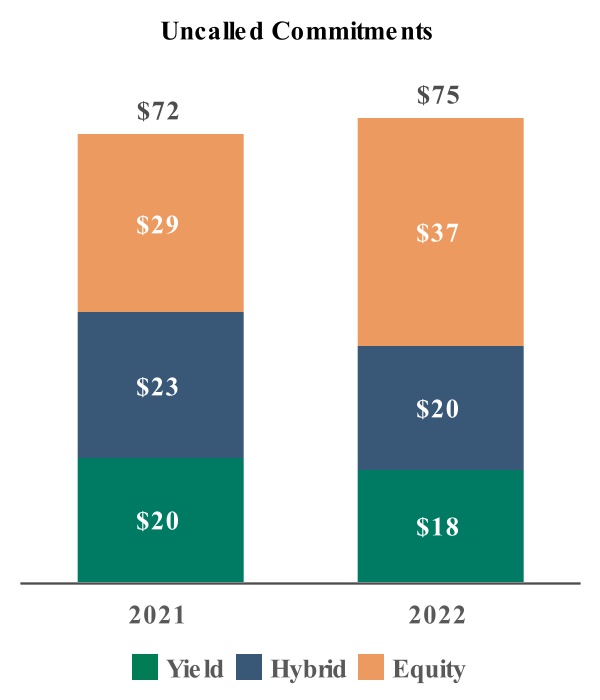
As of December 31, 2022 and December 31, 2021, Apollo had $51 billion and $47 billion of dry powder, respectively, which represents the amount of capital available for investment or reinvestment subject to the provisions of the applicable limited partnership agreements or other governing agreements of the funds, partnerships and accounts we manage. These amounts exclude uncalled commitments which can only be called for fund fees and expenses and commitments from perpetual capital vehicles.
79
Retirement Services
The following table presents Spread Related Earnings, the performance measure of our Retirement Services segment.
| Year Ended December 31, 2022 | |||||
| (In millions) | |||||
| Retirement Services: | |||||
| Fixed income and other investment income, net | $ | 5,705.8 | |||
| Alternative investment income, net | 1,205.6 | ||||
| Strategic capital management fees | 53.0 | ||||
| Cost of funds | (3,897.0) | ||||
| Net investment spread | 3,067.4 | ||||
| Other operating expenses | (461.7) | ||||
| Interest and other financing costs | (278.9) | ||||
| Spread Related Earnings (SRE) | $ | 2,326.8 | |||
Year Ended December 31, 2022
Spread Related Earnings
SRE was $2.3 billion for the year ended December 31, 2022. SRE for the year ended December 31, 2022 was mainly attributed to fixed income and other investment income and strong alternative investment income, partially offset by cost of funds, other operating expenses and interest and other financing costs. Fixed income and other investment income benefited from strong growth in organic inflows as well as floating rate income driven by the increase in rates. As a result of purchase accounting, the book value of Athene’s investment portfolio was marked up to fair value resulting in an adverse impact to fixed income and other investment income. Alternative investment income benefited from the deployment of inflows into alternative investments as well as strong performance on real estate funds, yield funds, Athora and MidCap, partially offset by unfavorable economics. Cost of funds was primarily driven by interest credited and option costs on annuity products, pension group annuity and payout annuity obligations, interest on funding agreement issuances, income rider reserve and DAC and VOBA amortization as well as other liability costs. As a result of purchase accounting, Athene marked its reserve liabilities to fair value resulting in a favorable impact to cost of funds. Additionally, cost of funds was favorably impacted by actuarial experience and unlocking. Unlocking, net of noncontrolling interests, was favorable $6 million primarily related to the impact of higher rates on future account values, partially offset by changes to projected interest crediting.
Net Investment Spread
| Year Ended December 31, 2022 | |||||
| Fixed income and other net investment earned rate | 3.22 | % | |||
| Alternative net investment earned rate | 10.42 | % | |||
| Net investment earned rate | 3.66 | % | |||
| Strategic capital management fees | 0.03 | % | |||
| Cost of funds | (2.06) | % | |||
| Net investment spread | 1.63 | % | |||
Net investment earned rate of 3.66% for the year ended December 31, 2022 is comprised of a fixed income and other net investment earned rate of 3.22% and alternative net investment earned rate of 10.42%. The fixed income earned rate was adversely impacted by unfavorable purchase accounting impacts, partially offset by floating rate income due to the increase in rates. The alternative investment earned rate was driven by strong performance on real estate funds, yield funds, Athora and MidCap, partially offset by unfavorable economics.
Strategic capital management fees of 0.03% for the year ended December 31, 2022 consisted of the management fees received by Athene for business managed for others, primarily the non-controlling interest portion of Athene’s business ceded to ACRA.
80
Cost of funds of 2.06% for the year ended December 31, 2022 was primarily driven by interest credited and option costs on annuity products, pension group annuity and payout annuity obligations, interest on funding agreement issuances, income rider reserve and DAC and VOBA amortization as well as other liability costs. As a result of purchase accounting, Athene marked its reserve liabilities to fair value resulting in a favorable impact to cost of funds. Additionally, cost of funds was favorably impacted by actuarial experience and unlocking.
Investment Portfolio
Athene had investments, including related parties and VIEs, of $212.1 billion as of December 31, 2022. Athene’s investment strategy seeks to achieve sustainable risk-adjusted returns through the disciplined management of its investment portfolio against its long-duration liabilities, coupled with the diversification of risk. The investment strategies focus primarily on a buy and hold asset allocation strategy that may be adjusted periodically in response to changing market conditions and the nature of Athene’s liability profile. Athene takes advantage of its generally persistent liability profile by identifying investment opportunities with an emphasis on earning incremental yield by taking liquidity and complexity risk rather than assuming incremental credit risk. Athene has selected a diverse array of primarily high-grade fixed income assets, including corporate bonds, structured securities and commercial and residential real estate loans, among others. Athene also maintains holdings in floating rate and less rate-sensitive instruments, including CLOs, non-agency RMBS and various types of structured products. In addition to its fixed income portfolio, Athene opportunistically allocates approximately 5% to 6% of its portfolio to alternative investments where it primarily focuses on fixed income-like, cash flow-based investments.
The following table presents the carrying values of Athene’s total investments, including related parties and VIEs:
| December 31, 2022 | |||||||||||
| (In millions, except percentages) | Carrying Value | Percent of Total | |||||||||
| AFS securities | |||||||||||
| U.S. government and agencies | $ | 2,577 | 1.2 | % | |||||||
| U.S. state, municipal and political subdivisions | 927 | 0.4 | % | ||||||||
| Foreign governments | 907 | 0.4 | % | ||||||||
| Corporate | 60,901 | 28.7 | % | ||||||||
| CLO | 16,493 | 7.8 | % | ||||||||
| ABS | 10,527 | 5.0 | % | ||||||||
| CMBS | 4,158 | 2.0 | % | ||||||||
| RMBS | 5,914 | 2.8 | % | ||||||||
| Total AFS securities, at fair value | 102,404 | 48.3 | % | ||||||||
| Trading securities, at fair value | 1,595 | 0.8 | % | ||||||||
| Equity securities | 1,487 | 0.7 | % | ||||||||
| Mortgage loans, at fair value | 27,454 | 12.9 | % | ||||||||
| Investment funds | 79 | — | % | ||||||||
| Policy loans | 347 | 0.2 | % | ||||||||
| Funds withheld at interest | 32,880 | 15.5 | % | ||||||||
| Derivative assets | 3,309 | 1.6 | % | ||||||||
| Short-term investments | 2,160 | 1.0 | % | ||||||||
| Other investments | 773 | 0.4 | % | ||||||||
| Total investments | 172,488 | 81.4 | % | ||||||||
| Investments in related parties | |||||||||||
| AFS securities | |||||||||||
| Corporate | 982 | 0.5 | % | ||||||||
| CLO | 3,079 | 1.4 | % | ||||||||
| ABS | 5,760 | 2.7 | % | ||||||||
| Total AFS securities, at fair value | 9,821 | 4.6 | % | ||||||||
| Trading securities, at fair value | 878 | 0.4 | % | ||||||||
| Equity securities, at fair value | 279 | 0.1 | % | ||||||||
| Mortgage loans, at fair value | 1,302 | 0.6 | % | ||||||||
| Investment funds | 1,569 | 0.7 | % | ||||||||
| Funds withheld at interest | 9,808 | 4.6 | % | ||||||||
| Other investments | 303 | 0.2 | % | ||||||||
| Total related party investments | 23,960 | 11.2 | % | ||||||||
81
| December 31, 2022 | |||||||||||
| (In millions, except percentages) | Carrying Value | Percent of Total | |||||||||
| Total investments, including related parties | 196,448 | 92.6 | % | ||||||||
| Investments owned by consolidated VIEs | |||||||||||
| Trading securities, at fair value | 1,063 | 0.5 | % | ||||||||
| Mortgage loans, at fair value | 2,055 | 1.0 | % | ||||||||
| Investment funds, at fair value | 12,480 | 5.9 | % | ||||||||
| Other investments, at fair value | 101 | — | % | ||||||||
| Total investments owned by consolidated VIEs | 15,699 | 7.4 | % | ||||||||
| Total investments, including related parties and VIEs | $ | 212,147 | 100.0 | % | |||||||
Athene’s investment portfolio consists largely of high quality fixed maturity securities, loans and short-term investments, as well as additional opportunistic holdings in investment funds and other instruments, including equity holdings. Fixed maturity securities and loans include publicly issued corporate bonds, government and other sovereign bonds, privately placed corporate bonds and loans, mortgage loans, CMBS, RMBS, CLOs and ABS. A significant majority of Athene’s AFS portfolio, 95.8% as of December 31, 2022, was invested in assets considered investment grade with a NAIC designation of 1 or 2.
Athene invests a portion of its investment portfolio in mortgage loans, which are generally comprised of high quality commercial first lien and mezzanine real estate loans. Athene has acquired mortgage loans through acquisitions and reinsurance arrangements, as well as through an active program to invest in new mortgage loans. It invests in CMLs on income producing properties, including hotels, apartments, retail and office buildings, and other commercial and industrial properties. Athene’s RML portfolio primarily consists of first lien RMLs collateralized by properties located in the U.S.
Funds withheld at interest represent a receivable for amounts contractually withheld by ceding companies in accordance with modco and funds withheld reinsurance agreements in which Athene acts as the reinsurer. Generally, assets equal to statutory reserves are withheld and legally owned by the ceding company.
While the substantial majority of Athene’s investment portfolio has been allocated to corporate bonds and structured credit products, a key component of Athene’s investment strategy is the opportunistic acquisition of investment funds with attractive risk and return profiles. Athene’s investment fund portfolio consists of funds that employ various strategies, including equity, hybrid and yield funds. Athene has a strong preference for assets that have some or all of the following characteristics, among others: (1) investments that constitute a direct investment or an investment in a fund with a high degree of co-investment; (2) investments with credit- or debt-like characteristics (for example, a stipulated maturity and par value), or alternatively, investments with reduced volatility when compared to pure equity; or (3) investments that Athene believes have less downside risk.
Athene holds derivatives for economic hedging purposes to reduce its exposure to the cash flow variability of assets and liabilities, equity market risk, interest rate risk, credit risk and foreign exchange risk. Athene’s primary use of derivative instruments relates to providing the income needed to fund the annual indexed credits on its FIA products. Athene primarily uses fixed indexed options to economically hedge indexed annuity products that guarantee the return of principal to the policyholder and credit interest based on a percentage of the gain in a specific market index.
82
Net Invested Assets
The following summarizes Athene’s net invested assets:
| December 31, 2022 | |||||||||||
| (In millions, except percentages) |
Net Invested Asset Value1
|
Percent of Total | |||||||||
| Corporate | $ | 80,800 | 41.1 | % | |||||||
| CLO | 19,881 | 10.1 | % | ||||||||
| Credit | 100,681 | 51.2 | % | ||||||||
| CML | 23,750 | 12.1 | % | ||||||||
| RML | 11,147 | 5.7 | % | ||||||||
| RMBS | 7,363 | 3.7 | % | ||||||||
| CMBS | 4,495 | 2.3 | % | ||||||||
| Real estate | 46,755 | 23.8 | % | ||||||||
| ABS | 20,680 | 10.5 | % | ||||||||
| Alternative investments | 12,079 | 6.1 | % | ||||||||
State, municipal, political subdivisions and foreign government |
2,715 | 1.4 | % | ||||||||
| Equity securities | 1,737 | 0.9 | % | ||||||||
| Short-term investments | 1,930 | 1.0 | % | ||||||||
| U.S. government and agencies | 2,691 | 1.4 | % | ||||||||
| Other investments | 41,832 | 21.3 | % | ||||||||
| Cash and equivalents | 5,481 | 2.8 | % | ||||||||
| Policy loans and other | 1,702 | 0.9 | % | ||||||||
| Net invested assets | 196,451 | 100.0 | % | ||||||||
1 See Managing Business Performance - Key Segment and Non-U.S. GAAP Performance Measures for the definition of net invested assets.
| |||||||||||
Athene’s net invested assets were $196.5 billion as of December 31, 2022. In managing its business, Athene utilizes net invested assets as presented in the above table. Net invested assets do not correspond to Athene’s total investments, including related parties, on the consolidated statements of financial condition, as discussed previously in Managing Business Performance - Key Segment and Non-U.S. GAAP Performance Measures. Net invested assets represent Athene’s investments that directly back the net reserve liabilities and surplus assets. Athene believes this view of its portfolio provides a view of the assets for which it has economic exposure. Athene adjusts the presentation for funds withheld and modco transactions to include or exclude the underlying investments based upon the contractual transfer of economic exposure to such underlying investments. Athene also adjusts for VIEs to show the net investment in the funds, which are included in the alternative investments line above, as well as adjusting for the allowance for credit losses. Net invested assets includes its proportionate share of ACRA investments, based on its economic ownership, but excludes the proportionate share of investments associated with the non-controlling interest.
Net invested assets is utilized by management to evaluate Athene’s investment portfolio. Net invested assets is used in the computation of net investment earned rate, which allows Athene to analyze the profitability of its investment portfolio. Net invested assets is also used in Athene’s risk management processes for asset purchases, product design and underwriting, stress scenarios, liquidity, and ALM.
83
Principal Investing
The following table presents Principal Investing Income, the performance measure of our Principal Investing segment.
| Years ended December 31, | Total Change | Percentage Change | Years ended December 31, | Total Change | Percentage Change | ||||||||||||||||||||||||||||||||||||||||||
| 2022 | 2021 | 2021 | 2020 | ||||||||||||||||||||||||||||||||||||||||||||
| (In millions) | (In millions) | ||||||||||||||||||||||||||||||||||||||||||||||
| Principal Investing: | |||||||||||||||||||||||||||||||||||||||||||||||
| Realized performance fees | $ | 595.3 | $ | 1,589.1 | $ | (993.8) | (62.5)% | $ | 1,589.1 | $ | 280.9 | $ | 1,308.2 | 465.7% | |||||||||||||||||||||||||||||||||
| Realized investment income | 330.1 | 437.3 | (107.2) | (24.5) | 437.3 | 29.3 | 408.0 | NM | |||||||||||||||||||||||||||||||||||||||
| Principal investing compensation | (585.1) | (876.4) | 291.3 | (33.2) | (876.4) | (222.4) | (654.0) | (294.1) | |||||||||||||||||||||||||||||||||||||||
| Other operating expenses | (55.8) | (42.4) | (13.4) | 31.6 | (42.4) | (52.6) | 10.2 | 19.4 | |||||||||||||||||||||||||||||||||||||||
| Principal Investing Income (PII) | $ | 284.5 | $ | 1,107.6 | $ | (823.1) | (74.3)% | $ | 1,107.6 | $ | 35.2 | $ | 1,072.4 | NM | |||||||||||||||||||||||||||||||||
As described in “Item 2. Management’s Discussion and Analysis of Financial Condition and Results of Operations—General”, earnings from our Principal Investing segment are inherently more volatile in nature than earnings from our Asset Management segment due to the intrinsic cyclical nature of performance fees, one of the key drivers of PII performance.
In this section, references to 2022 refer to the year ended December 31, 2022, references to 2021 refer to the year ended December 31, 2021, and references to 2020 refer to the year ended December 31, 2020.
Year Ended December 31, 2022 Compared to Year Ended December 31, 2021
PII was $285 million in 2022, a decrease of $823 million, as compared to $1.1 billion in 2021. This decrease was primarily attributable to reduced realized performance fees as market volatility delayed monetization activity in 2022, offset, in part, by a corresponding decrease in principal investing compensation. In any period, the blended profit sharing percentage is impacted by the respective profit sharing ratios of the funds generating performance allocations in the period. Additionally, included in principal investing compensation are expenses related to the Incentive Pool, a compensation program through which certain employees are allocated discretionary compensation based on realized performance fees in a given year. The Incentive Pool is separate from the fund related profit sharing expense and may result in greater variability in compensation and have a variable impact on the blended profit sharing percentage during a particular period.
Year Ended December 31, 2021 Compared to Year Ended December 31, 2020
PII was $1.1 billion in 2021, an increase of $1.1 billion, as compared to $35 million in 2020. This increase was primarily attributable to increases in realized performance fees and realized investment income, partially offset by an increase in principal investing compensation. Realized performance fees increased to $1.6 billion in 2021 from $281 million in 2020 driven by an increase in performance fees generated from Fund VIII and Fund IX of $700 million and $401 million, respectively. In 2020, the COVID-19 pandemic and the actions taken in response caused severe disruption to the global economy and financial markets. In line with public equity and credit indices, the Company experienced significant unrealized mark-to-market losses in underlying funds which significantly delayed monetization activity. The increase in realized investment income in 2021 was primarily attributable to an increase in realizations from the sale of a platform investment to certain funds we manage and Athora and an increase in realizations from Apollo’s equity ownership in Fund VIII. Principal investing compensation increased as a result of a corresponding increase in realized performance fees as described above.
The Historical Investment Performance of Our Funds
Below we present information relating to the historical performance of the funds we manage, including certain legacy Apollo funds that do not have a meaningful amount of unrealized investments, and in respect of which the general partner interest has not been contributed to us.
When considering the data presented below, you should note that the historical results of funds we manage are not indicative of the future results that you should expect from such funds, from any future funds we may raise or from your investment in our common shares.
An investment in our common stock is not an investment in any of the Apollo funds, and the assets and revenues of our funds are not directly available to us. The historical and potential future returns of the funds we manage are not directly linked to
84
returns on our common stock. Therefore, you should not conclude that continued positive performance of the funds we manage will necessarily result in positive returns on an investment in our common stock. However, poor performance of the funds that we manage would cause a decline in our revenue from such funds, and would therefore have a negative effect on our performance and in all likelihood the value of our common stock.
Moreover, the historical returns of funds we manage should not be considered indicative of the future results you should expect from such funds or from any future funds we may raise. There can be no assurance that any Apollo fund will continue to achieve the same results in the future.
Finally, our private equity IRRs have historically varied greatly from fund to fund. For example, Fund VI generated a 12% gross IRR and a 9% net IRR since its inception through December 31, 2022, while Fund V generated a 61% gross IRR and a 44% net IRR since its inception through December 31, 2022. Accordingly, the IRR going forward for any current or future fund may vary considerably from the historical IRR generated by any particular fund, or for our private equity funds as a whole. Future returns will also be affected by the applicable risks, including risks of the industries and businesses in which a particular fund invests. See “Item 1A. Risk Factors—Risks Relating to Our Asset Management Business—Historical performance metrics are unreliable indicators of our current or future results of operations.”
Investment Record
The following table summarizes the investment record by strategy of Apollo’s significant commitment-based funds that have a defined maturity date in which investors make a commitment to provide capital at the formation of such funds and deliver capital when called as investment opportunities become available.
All amounts are as of December 31, 2022, unless otherwise noted:
| (In millions, except IRR) | Vintage Year |
Total AUM | Committed Capital |
Total Invested Capital | Realized Value | Remaining Cost | Unrealized Value | Total Value | Gross IRR |
Net IRR |
|||||||||||||||||||||||||||||||||||||||||||||||||
| Equity: | |||||||||||||||||||||||||||||||||||||||||||||||||||||||||||
| Fund IX | 2018 | $ | 32,524 | $ | 24,729 | $ | 19,462 | $ | 7,983 | $ | 15,165 | $ | 23,150 | $ | 31,133 | 38 | % | 25 | % | ||||||||||||||||||||||||||||||||||||||||
| Fund VIII | 2013 | 10,864 | 18,377 | 16,437 | 21,020 | 5,322 | 7,792 | 28,812 | 15 | 11 | |||||||||||||||||||||||||||||||||||||||||||||||||
| Fund VII | 2008 | 409 | 14,677 | 16,461 | 34,209 | 16 | 75 | 34,284 | 33 | 25 | |||||||||||||||||||||||||||||||||||||||||||||||||
| Fund VI | 2006 | 365 | 10,136 | 12,457 | 21,136 | 405 | — | 21,136 | 12 | 9 | |||||||||||||||||||||||||||||||||||||||||||||||||
| Fund V | 2001 | 62 | 3,742 | 5,192 | 12,724 | 120 | — | 12,724 | 61 | 44 | |||||||||||||||||||||||||||||||||||||||||||||||||
Fund I, II, III, IV & MIA4
|
Various | 11 | 7,320 | 8,753 | 17,400 | — | — | 17,400 | 39 | 26 | |||||||||||||||||||||||||||||||||||||||||||||||||
Traditional Private Equity Funds5
|
$ | 44,235 | $ | 78,981 | $ | 78,762 | $ | 114,472 | $ | 21,028 | $ | 31,017 | $ | 145,489 | 39 | 24 | |||||||||||||||||||||||||||||||||||||||||||
EPF IV1
|
N/A | 2,090 | 2,076 | 445 | 1 | 445 | 476 | 477 |
NM2
|
NM2
|
|||||||||||||||||||||||||||||||||||||||||||||||||
| EPF III | 2017 | 4,267 | 4,444 | 4,759 | 3,359 | 2,239 | 3,026 | 6,385 | 16 | 9 | |||||||||||||||||||||||||||||||||||||||||||||||||
| Total Equity | $ | 50,592 | $ | 85,501 | $ | 83,966 | $ | 117,832 | $ | 23,712 | $ | 34,519 | $ | 152,351 | |||||||||||||||||||||||||||||||||||||||||||||
| Hybrid: | |||||||||||||||||||||||||||||||||||||||||||||||||||||||||||
| AIOF II | 2021 | $ | 2,563 | $ | 2,542 | $ | 1,214 | $ | 296 | $ | 1,074 | $ | 1,188 | $ | 1,484 | 24 | % | 20 | % | ||||||||||||||||||||||||||||||||||||||||
| AIOF I | 2018 | 443 | 897 | 802 | 1,031 | 200 | 238 | 1,269 | 24 | 19 | |||||||||||||||||||||||||||||||||||||||||||||||||
| HVF II | 2022 | 4,530 | 4,592 | 1,789 | 10 | 1,779 | 1,758 | 1,768 |
NM2
|
NM2
|
|||||||||||||||||||||||||||||||||||||||||||||||||
| HVF I | 2019 | 3,616 | 3,238 | 3,601 | 3,320 | 1,584 | 1,865 | 5,185 | 24 | 19 | |||||||||||||||||||||||||||||||||||||||||||||||||
Accord V3
|
2022 | 1,975 | 1,922 | 1,423 | 577 | 846 | 811 | 1,388 |
NM2
|
NM2
|
|||||||||||||||||||||||||||||||||||||||||||||||||
Accord I, II, III, III B & IV3
|
Various | — | 6,070 | 4,765 | 5,137 | — | — | 5,137 | 22 | 17 | |||||||||||||||||||||||||||||||||||||||||||||||||
| Accord+ | 2021 | 2,866 | 2,370 | 2,775 | 945 | 1,872 | 1,845 | 2,790 |
NM2
|
NM2
|
|||||||||||||||||||||||||||||||||||||||||||||||||
| Total Hybrid | $ | 15,993 | $ | 21,631 | $ | 16,369 | $ | 11,316 | $ | 7,355 | $ | 7,705 | $ | 19,021 | |||||||||||||||||||||||||||||||||||||||||||||
1 Vintage Year is not yet applicable as the fund has not had its final closing.
| |||||||||||||||||||||||||||||||||||||||||||||||||||||||||||
2 Data has not been presented as the fund’s effective date is less than 24 months prior to the period indicated and such information was deemed not meaningful.
| |||||||||||||||||||||||||||||||||||||||||||||||||||||||||||
3 Accord funds have investment periods shorter than 24 months, therefore Gross and Net IRR are presented after 12 months of investing.
| |||||||||||||||||||||||||||||||||||||||||||||||||||||||||||
4 The general partners and managers of Funds I, II and MIA, as well as the general partner of Fund III, were excluded assets in connection with the reorganization of the Company that occurred in 2007. As a result, Apollo did not receive the economics associated with these entities. The investment performance of these funds, combined with Fund IV, is presented to illustrate fund performance associated with Apollo’s investment professionals.
| |||||||||||||||||||||||||||||||||||||||||||||||||||||||||||
5 Total IRR is calculated based on total cash flows for all funds presented.
| |||||||||||||||||||||||||||||||||||||||||||||||||||||||||||
85
Equity
The following table summarizes the investment record for distressed investments made in our traditional private equity fund portfolios since the Company’s inception. All amounts are as of December 31, 2022:
| (In millions, except percentages) | Total Invested Capital | Total Value | Gross IRR | ||||||||||||||
| Distressed for Control | $ | 7,795 | $ | 18,874 | 29 | % | |||||||||||
| Non-Control Distressed | 6,302 | 10,837 | 71 | ||||||||||||||
| Total | 14,097 | 29,711 | 49 | ||||||||||||||
Corporate Carve-outs, Opportunistic Buyouts and Other Credit1
|
64,665 | 115,778 | 21 | ||||||||||||||
| Total | $ | 78,762 | $ | 145,489 | 39 | % | |||||||||||
1 Other Credit is defined as investments in debt securities of issuers other than portfolio companies that are not considered to be distressed.
| |||||||||||||||||
The following tables provide additional detail on the composition of the Fund IX, Fund VIII and Fund VII private equity portfolios based on investment strategy. Amounts for Fund I, II, III, IV, V and VI are included in the table above but not presented below as their remaining value is less than $100 million or the fund has been liquidated and such information was deemed not meaningful. All amounts are as of December 31, 2022:
Fund IX1
| (In millions) | Total Invested Capital | Total Value | |||||||||
| Corporate Carve-outs | $ | 4,082 | $ | 8,066 | |||||||
| Opportunistic Buyouts | 14,596 | 20,653 | |||||||||
Distressed2
|
784 | 2,414 | |||||||||
| Total | $ | 19,462 | $ | 31,133 | |||||||
Fund VIII1
| (In millions) | Total Invested Capital | Total Value | |||||||||
| Corporate Carve-outs | $ | 2,704 | $ | 6,935 | |||||||
| Opportunistic Buyouts | 13,166 | 21,123 | |||||||||
Distressed2
|
567 | 754 | |||||||||
| Total | $ | 16,437 | $ | 28,812 | |||||||
Fund VII1
| (In millions) | Total Invested Capital | Total Value | |||||||||
| Corporate Carve-outs | $ | 2,539 | $ | 4,848 | |||||||
| Opportunistic Buyouts | 4,338 | 10,799 | |||||||||
Distressed/Other Credit2
|
9,584 | 18,637 | |||||||||
| Total | $ | 16,461 | $ | 34,284 | |||||||
1Committed capital less unfunded capital commitments for Fund IX, Fund VIII and Fund VII were $16.9 billion, $17.7 billion and $14.7 billion, respectively, which represents capital commitments from limited partners to invest in such funds less capital that is available for investment or reinvestment subject to the provisions of the applicable governing agreements.
2The distressed investment strategy includes distressed for control, non-control distressed and other credit. Other Credit is defined as investments in debt securities of issuers other than portfolio companies that are not considered to be distressed.
Our average entry multiple for a private equity fund is the average of the total enterprise value over an applicable adjusted earnings before interest, taxes, depreciation and amortization, which may incorporate certain adjustments based on the investment team’s estimates and we believe captures the true economics of our funds’ investments in portfolio companies. The average entry multiple of actively investing funds may include committed investments not yet closed.
86
Perpetual Capital
The following table summarizes the investment record for the perpetual capital vehicles we manage, excluding Athene-related and Athora-related assets managed or advised by ISG and ISGI:
Total Returns1
|
|||||||||||||||||||||||
IPO Year2
|
Total AUM | For the Year Ended December 31, 2022 | For the Year Ended December 31, 2021 | ||||||||||||||||||||
| (In millions) | |||||||||||||||||||||||
MidCap3
|
N/A | $ | 12,216 | 19 | % | 20 | % | ||||||||||||||||
| AIF | 2013 | 343 | (13) | % | 13 | % | |||||||||||||||||
| AFT | 2011 | 354 | (17) | % | 19 | % | |||||||||||||||||
MFIC/Other4
|
2004 | 10,312 | — | % | 34 | % | |||||||||||||||||
| ARI | 2009 | 9,660 | (7) | % | 30 | % | |||||||||||||||||
| Total | $ | 32,885 | |||||||||||||||||||||
1 Total returns are based on the change in closing trading prices during the respective periods presented taking into account dividends and distributions, if any, as if they were reinvested without regard to commission.
|
|||||||||||||||||||||||
2 An initial public offering (“IPO”) year represents the year in which the vehicle commenced trading on a national securities exchange.
|
|||||||||||||||||||||||
3 MidCap is not a publicly traded vehicle and therefore IPO year is not applicable. The returns presented are a gross return based on NAV. The net returns based on NAV were 15% and 15% for the years ended December 31, 2022 and 2021, respectively.
|
|||||||||||||||||||||||
4 Included within total AUM of MFIC/Other, is $5.5 billion of AUM related to ADS, a non-traded business development company, and $1.9 billion of AUM related to a publicly traded business development company, as of September 2022, from which Apollo earns investment-related service fees, but for which Apollo does not provide management or advisory services. Total returns exclude performance related to this AUM.
|
|||||||||||||||||||||||
87
Summary of Non-U.S. GAAP Measures
The table below sets forth a reconciliation of net income attributable to Apollo Global Management, Inc. common stockholders to Adjusted Segment Income and Adjusted Net Income:
| Years ended December 31, | |||||||||||||||||
| (In millions) | 2022 | 2021 | 2020 | ||||||||||||||
| GAAP Net Income (Loss) Attributable to Apollo Global Management, Inc. | $ | (3,213) | $ | 1,802 | $ | 120 | |||||||||||
| Preferred dividends | — | 37 | 37 | ||||||||||||||
| Net income (loss) attributable to non-controlling interests | (1,533) | 2,428 | 310 | ||||||||||||||
| GAAP Net Income (Loss) | $ | (4,746) | $ | 4,267 | $ | 467 | |||||||||||
| Income tax provision (benefit) | (1,069) | 594 | 86 | ||||||||||||||
| GAAP Income (Loss) Before Income Tax Provision (Benefit) | $ | (5,815) | $ | 4,861 | $ | 553 | |||||||||||
Asset Management Adjustments: |
|||||||||||||||||
Equity-based profit sharing expense and other1
|
276 | 146 | 129 | ||||||||||||||
| Equity-based compensation | 185 | 80 | 68 | ||||||||||||||
| Preferred dividends | — | (37) | (37) | ||||||||||||||
Transaction-related charges2
|
(42) | 35 | 39 | ||||||||||||||
Merger-related transaction and integration costs3
|
70 | 67 | — | ||||||||||||||
| Changes associated with corporate conversion | — | — | 4 | ||||||||||||||
| (Gains) losses from change in tax receivable agreement liability | 26 | (10) | (12) | ||||||||||||||
| Net (income) loss attributable to non-controlling interests in consolidated entities | 1,486 | (418) | (118) | ||||||||||||||
| Unrealized performance fees | (2) | (1,465) | (35) | ||||||||||||||
| Unrealized profit sharing expense | 20 | 649 | 33 | ||||||||||||||
One-time equity-based compensation and other charges5
|
— | 949 | — | ||||||||||||||
HoldCo interest and other financing costs4
|
122 | 170 | 154 | ||||||||||||||
| Unrealized principal investment income (loss) | 176 | (222) | (62) | ||||||||||||||
| Unrealized net (gains) losses from investment activities and other | (148) | (2,431) | 421 | ||||||||||||||
Retirement Services Adjustments: |
|||||||||||||||||
| Investment (gains) losses, net of offsets | 7,024 | — | — | ||||||||||||||
| Non-operating change in insurance liabilities and related derivatives, net of offsets | 454 | — | — | ||||||||||||||
| Integration, restructuring and other non-operating expenses | 133 | — | — | ||||||||||||||
| Equity-based compensation expense | 56 | — | — | ||||||||||||||
| Adjusted Segment Income | 4,021 | 2,374 | 1,137 | ||||||||||||||
HoldCo interest and other financing costs4
|
(122) | (170) | (154) | ||||||||||||||
| Taxes and related payables | (764) | (172) | (90) | ||||||||||||||
| Adjusted Net Income | $ | 3,135 | $ | 2,032 | $ | 893 | |||||||||||
1 Equity-based profit sharing expense and other includes certain profit sharing arrangements in which a portion of performance fees distributed to the general partner are required to be used by employees of Apollo to purchase restricted shares of common stock or is delivered in the form of RSUs, which are granted under the Equity Plan. Equity-based profit sharing expense and other also includes performance grants which are tied to the Company’s receipt of performance fees, within prescribed periods, sufficient to cover the associated equity-based compensation expense.
| |||||||||||||||||
2 Transaction-related charges include contingent consideration, equity-based compensation charges and the amortization of intangible assets and certain other charges associated with acquisitions, and restructuring charges.
| |||||||||||||||||
3 Merger-related transaction and integration costs includes advisory services, technology integration, equity-based compensation charges and other costs associated with the Mergers.
| |||||||||||||||||
4 Represents interest and other financing costs related to AGM not attributable to any specific segment.
| |||||||||||||||||
5 Includes one-time equity-based compensation expense and associated taxes related to the Company’s compensation reset.
| |||||||||||||||||
88
The table below sets forth a reconciliation of common stock outstanding to our Adjusted Net Income Shares Outstanding:
| As of December 31, 2022 | As of December 31, 2021 | ||||||||||
| Total GAAP Common Stock Outstanding | 570,276,188 | 248,896,649 | |||||||||
| Non-GAAP Adjustments: | |||||||||||
| Participating Apollo Operating Group Units | — | 184,787,638 | |||||||||
| Vested RSUs | 15,656,775 | 17,700,688 | |||||||||
| Unvested RSUs Eligible for Dividend Equivalents | 12,827,921 | 9,809,245 | |||||||||
| Adjusted Net Income Shares Outstanding | 598,760,884 | 461,194,220 | |||||||||
The table below sets forth a reconciliation of Athene’s total investments, including related parties, to net invested assets:
| (In millions) | December 31, 2022 | |||||||
| Total investments, including related parties | $ | 196,448 | ||||||
| Derivative assets | (3,309) | |||||||
| Cash and cash equivalents (including restricted cash) | 8,407 | |||||||
| Accrued investment income | 1,328 | |||||||
| Net receivable (payable) for collateral on derivatives | (1,486) | |||||||
| Reinsurance funds withheld and modified coinsurance | 1,423 | |||||||
| VIE and VOE assets, liabilities and noncontrolling interest | 12,747 | |||||||
| Unrealized (gains) losses | 22,284 | |||||||
| Ceded policy loans | (179) | |||||||
| Net investment receivables (payables) | 186 | |||||||
| Allowance for credit losses | 471 | |||||||
| Other investments | (10) | |||||||
| Total adjustments to arrive at gross invested assets | 41,862 | |||||||
| Gross invested assets | 238,310 | |||||||
| ACRA noncontrolling interest | (41,859) | |||||||
| Net invested assets | $ | 196,451 | ||||||
Liquidity and Capital Resources
Overview
The Company primarily derives revenues and cash flows from the assets it manages and the retirement savings products it issues, reinsures and acquires. Based on management’s experience, we believe that the Company’s current liquidity position, together with the cash generated from revenues will be sufficient to meet the Company’s anticipated expenses and other working capital needs for at least the next 12 months. For the longer-term liquidity needs of the asset management business, we expect to continue to fund the asset management business’ operations through management fees and performance fees received. The principal sources of liquidity for the retirement services business, in the ordinary course of business, are operating cash flows and holdings of cash, cash equivalents and other readily marketable assets.
AGM is a holding company whose primary source of cash flow is distributions from its subsidiaries, which are expected to be sufficient to fund cash flow requirements based on current estimates of future obligations. AGM’s primary liquidity needs include the cash-flow requirements relating to its corporate activities, including its day-to-day operations, common stock dividend payments and strategic transactions, such as acquisitions.
At December 31, 2022, the Company had $9.0 billion of unrestricted cash and cash equivalents and $0.7 billion of U.S. Treasury securities as well as $4.8 billion of available funds from the 2022 AMH credit facility, AHL credit facility, and AHL liquidity facility.
89
Primary Uses of Cash
Over the next 12 months, we expect the Company’s primary liquidity needs will be to:
•support the future growth of Apollo’s businesses through strategic corporate investments;
•pay the Company’s operating expenses, including, compensation, general, administrative, and other expense;
•make payments to policyholders for surrenders, withdrawals and payout benefits;
•make interest and principal payments on funding agreements;
•make payments to satisfy pension group annuity obligations and policy acquisition costs;
•pay taxes and tax related payments;
•pay cash dividends;
•make payments related to the AOG Unit Payment;
•repurchase common stock; and
•make payments under the tax receivable agreement.
Over the long term, we believe we will be able to (i) grow Apollo’s Assets Under Management and generate positive investment performance in the funds we manage, which we expect will allow us to grow the Company’s management fees and performance fees and (ii) grow the investment portfolio of retirement services, in each case in amounts sufficient to cover our long-term liquidity requirements, which may include:
•supporting the future growth of our businesses;
•creating new or enhancing existing products and investment platforms;
•making payments to policyholders;
•pursuing new strategic corporate investment opportunities;
•paying interest and principal on the Company’s financing arrangements;
•repurchasing common stock;
•making payments under the tax receivable agreement;
•making payments related to the AOG Unit Payment; and
•paying cash dividends.
Cash Flow Analysis
The section below discusses in more detail the Company’s primary sources and uses of cash and the primary drivers of cash flows within the Company’s consolidated statements of cash flows:
| Years ended December 31, | |||||||||||||||||
| (In millions) | 2022 | 2021 | 2020 | ||||||||||||||
| Operating Activities | $ | 3,789 | $ | 1,064 | $ | (1,616) | |||||||||||
| Investing Activities | (23,444) | (1,552) | (838) | ||||||||||||||
| Financing Activities | 28,710 | 109 | 3,300 | ||||||||||||||
| Effect of exchange rate changes on cash and cash equivalents | (15) | — | — | ||||||||||||||
| Net Increase (Decrease) in Cash and Cash Equivalents, Restricted Cash and Cash Equivalents, and Cash and Cash Equivalents Held at Consolidated Variable Interest Entities | $ | 9,040 | $ | (379) | $ | 846 | |||||||||||
The assets of our consolidated funds and VIEs, on a gross basis, could have a substantial effect on the accompanying statement of cash flows. Because our consolidated funds and VIEs are generally treated as investment companies for accounting purposes, their investing cash flow amounts are included in our cash flows from operating activities. The table below summarizes our consolidated statements of cash flow by activity attributable to the Company and to our consolidated funds and VIEs.
90
| Years ended December 31, | |||||||||||||||||
| (In millions) | 2022 | 2021 | 2020 | ||||||||||||||
| Net cash provided by the Company's operating activities | $ | 7,021 | $ | 2,165 | $ | 888 | |||||||||||
| Net cash used in the Consolidated Funds and VIEs operating activities | (3,232) | (1,101) | (2,504) | ||||||||||||||
| Net cash provided by (used in) operating activities | 3,789 | 1,064 | (1,616) | ||||||||||||||
| Net cash used in the Company's investing activities | (21,840) | (1,229) | (68) | ||||||||||||||
| Net cash used in the Consolidated Funds and VIEs investing activities | (1,604) | (323) | (770) | ||||||||||||||
| Net cash used in investing activities | (23,444) | (1,552) | (838) | ||||||||||||||
| Net cash provided by (used in) the Company's financing activities | 23,786 | (1,576) | (822) | ||||||||||||||
| Net cash provided by the Consolidated Funds and VIEs financing activities | 4,924 | 1,685 | 4,122 | ||||||||||||||
| Net cash provided by financing activities | $ | 28,710 | $ | 109 | $ | 3,300 | |||||||||||
Operating Activities
The Company’s operating activities support its Asset Management, Retirement Services and Principal Investing activities. The primary sources of cash within operating activities include: (a) management fees, (b) advisory and transaction fees, (c) realized performance revenues, (d) realized principal investment income, (e) investment sales from our consolidated funds and VIEs, (f) net investment income, (g) annuity considerations and (h) insurance premiums. The primary uses of cash within operating activities include: (a) compensation and non-compensation related expenses, (b) interest and taxes, (c) investment purchases from our consolidated funds and VIEs, (d) benefit payments and (e) other operating expenses.
•During the year ended December 31, 2022, cash provided by operating activities primarily includes net cash used in our consolidated funds and VIEs for purchases of investments and proceeds from sale of VIEs investments. Net cash provided by operating activities reflects cash inflows of management fees, advisory and transaction fees, realized performance revenues, and realized principal investment income, as well as cash received from pension group annuity transactions net of outflows.
•During the year ended December 31, 2021, cash provided by operating activities primarily includes cash inflows from the receipt of management fees, advisory and transaction fees, realized performance revenues, and realized principal investment income, offset by cash outflows for compensation, general, administrative, other expenses and activities of our consolidated funds and VIEs. Net cash used in operating activities also reflects operating activities of our consolidated funds and VIEs, which includes cash outflows for purchases of investments, offset by cash inflows from consolidated funds.
•During the year ended December 31, 2020, cash used by operating activities primarily reflects the operating activities of our consolidated funds and VIEs, which includes cash outflows for purchases of investments, offset by cash inflows from consolidated funds. Net cash used in operating activities also reflects cash outflows for compensation, general, administrative, and other expenses, offset by cash inflows from the receipt of management fees, advisory and transaction fees, realized performance revenues, and realized principal investment income.
Investing Activities
The Company’s investing activities support the growth of its business. The primary sources of cash within investing activities include: (a) distributions from investments and (b) sales, maturities and repayments of investments. The primary uses of cash within investing activities include: (a) capital expenditures, (b) purchases and acquisitions of new investments, including purchases of U.S. Treasury securities and (c) equity method investments in the funds we manage.
•During the year ended December 31, 2022, cash used in investing activities primarily reflects the purchase of investments due to the deployment of significant cash inflows from Athene’s organic growth, partially offset by Athene cash acquired as a result of the Mergers and the sale, repayment and maturity of investments.
•During the year ended December 31, 2021, cash used in investing activities primarily reflects purchases of investments in Motive Partners and Challenger Ltd., net purchases of U.S. Treasury securities, and net contributions to equity method investments. Net cash used in investing activities also reflects the investing activities of our consolidated funds and VIEs, which primarily includes net proceeds from maturities of U.S. Treasury securities.
91
•During the year ended December 31, 2020, cash used in investing activities primarily reflects purchases of U.S. Treasury securities and other investments and net contributions to equity method investments, partially offset by proceeds from maturities of U.S. Treasury securities.
Financing Activities
The Company’s financing activities reflect its capital market transactions and transactions with equity holders. The primary sources of cash within the financing activities section includes: (a) proceeds from debt and preferred equity issuances, (b) inflows on Athene’s investment-type policies, (c) changes of cash collateral posted for derivative transactions, and (d) capital contributions and proceeds from other borrowing activities. The primary uses of cash within the financing activities section include: (a) dividends, (b) payments under the tax receivable agreement, (c) share repurchases, (d) cash paid to settle tax withholding obligations in connection with net share settlements of equity-based awards, (e) repayments of debt, (f) withdrawals on Athene’s investment-type policies and (g) changes of cash collateral posted for derivative transactions.
•During the year ended December 31, 2022, cash provided by financing activities primarily reflects the strong organic inflows from retail and funding agreements, net of withdrawals, net capital contributions from non-controlling interests, and the issuance of debt and preferred stock by our subsidiary, partially offset by the payment of stock dividends. Cash provided by financing activities of our consolidated funds and VIEs primarily includes proceeds from the issuance of debt, including repurchase agreements.
•During the year ended December 31, 2021, cash provided by financing activities primarily reflects the financing activities of our consolidated funds and VIEs, which primarily includes cash inflows from the issuance of debt, net contributions from non-controlling interest in consolidated entities, proceeds from issuance of securities of SPACs sponsored by Apollo, partially offset by payment of underwriting discounts and cash outflows for the principal repayment of debt. Net cash used in financing activities also reflects dividends to common shareholders, distributions to non-controlling interest holders, and repurchases of common stock.
•During the year ended December 31, 2020, cash provided by financing activities primarily reflects the financing activity of our consolidated funds and VIEs, which primarily includes cash inflows from the issuance of debt, net contributions from non-controlling interest in consolidated entities, contributions from redeemable non-controlling interests, offset by cash outflows for the principal repayment of debt. Net cash provided by financing activities also reflects proceeds from the issuance of the 2030 Senior Notes, partially offset by dividends to common shareholders, distributions to non-controlling interest holders, and repurchases of common stock.
Contractual Obligations, Commitments and Contingencies
For a summary and a description of the nature of the Company’s commitments, contingencies and contractual obligations, see note 18 to the consolidated financial statements and “—Contractual Obligations, Commitments and Contingencies.” The Company’s commitments are primarily fulfilled through cash flows from operations and financing activities.
Consolidated Funds and VIEs
The Company manages its liquidity needs by evaluating unconsolidated cash flows; however, the Company’s financial statements reflect the financial position of Apollo as well as Apollo’s consolidated funds and VIEs (including SPACs). The primary sources and uses of cash at Apollo’s consolidated funds and VIEs include: (a) raising capital from their investors, which have been reflected historically as non-controlling interests of the consolidated subsidiaries in our financial statements, (b) using capital to make investments, (c) generating cash flows from operations through distributions, interest and the realization of investments, (d) distributing cash flow to investors, (e) issuing debt to finance investments (CLOs) and (f) raising capital through SPAC vehicles for future acquisition of targeted entities.
Dividends and Distributions
For information regarding the quarterly dividends and distributions that were made to common stockholders and non-controlling interest holders in the Apollo Operating Group and participating securities, see note 15 to the consolidated financial statements. Although the Company currently expects to pay dividends, we may not pay dividends if, among other things, we do not have the cash necessary to pay the dividends. To the extent we do not have cash on hand sufficient to pay dividends, we
92
may have to borrow funds to pay dividends, or we may determine not to pay dividends. The declaration, payment and determination of the amount of our dividends are at the sole discretion of our board of directors.
Because AGM is a holding company, the primary source of funds for AGM’s dividends are distributions from its operating subsidiaries, AAM and AHL, which are expected to be adequate to fund AGM’s dividends and other cash flow requirements based on current estimates of future obligations. The ability of these operating subsidiaries to make distributions to AGM will depend on satisfying applicable law with respect to such distributions, including surplus and minimum solvency requirements among others, as well as making prior distributions on the AAM and AHL outstanding preferred stock. Moreover, the ability of AAM and AHL to receive distributions from their own respective subsidiaries will continue to depend on applicable law with respect to such distributions.
On February 9, 2023, AGM declared a cash dividend of $0.40 per share of its common stock, which will be paid on February 28, 2023 to holders of record at the close of business on February 21, 2023.
Repurchase of Securities
Share Repurchase Program
For information regarding the Company’s share repurchase program, see note 15 to the consolidated financial statements.
Repurchase of Other Securities
We may from time to time seek to retire or purchase our other outstanding debt or equity securities through cash purchases and/or exchanges for other securities, purchases in the open market, privately negotiated transactions or otherwise. Any such repurchases will be dependent upon several factors, including our liquidity requirements, contractual restrictions, general market conditions and applicable regulatory, legal and accounting factors. Whether or not we repurchase any of our other securities and the size and timing of any such repurchases will be determined at our discretion.
Asset Management Liquidity
Our asset management business requires limited capital resources to support the working capital or operating needs of the business. For the asset management business’ longer-term liquidity needs, we expect to continue to fund the asset management business’ operations through management fees and performance fees received. Liquidity needs are also met (to a limited extent) through proceeds from borrowings and equity issuances as described in notes 13 and 15 to the consolidated financial statements, respectively. From time to time, if the Company determines that market conditions are favorable after taking into account our liquidity requirements, we may seek to raise proceeds through the issuance of additional debt or equity instruments.
At December 31, 2022, the asset management business had $1.2 billion of unrestricted cash and cash equivalents and $0.7 billion of U.S. Treasury securities as well as $1.0 billion of available funds from the 2022 AMH credit facility.
Future Debt Obligations
The asset management business had long-term debt of $2.8 billion at December 31, 2022, which includes notes with maturities in 2024, 2026, 2029, 2030, 2048 and 2050. See note 13 to the consolidated financial statements for further information regarding the asset management business’ debt arrangements.
Future Cash Flows
Our ability to execute our business strategy, particularly our ability to increase our AUM, depends on our ability to establish new funds and to raise additional investor capital within such funds. Our liquidity will depend on a number of factors, such as our ability to project our financial performance, which is highly dependent on the funds we manage and our ability to manage our projected costs, fund performance, access to credit facilities, compliance with existing credit agreements, as well as industry and market trends. Also during economic downturns the funds we manage might experience cash flow issues or liquidate entirely. In these situations we might be asked to reduce or eliminate the management fee and performance fees we charge, which could adversely impact our cash flow in the future.
93
An increase in the fair value of the investments of the funds we manage, by contrast, could favorably impact our liquidity through higher management fees where the management fees are calculated based on the net asset value, gross assets or adjusted assets. Additionally, higher performance fees not yet realized would generally result when investments appreciate over their cost basis which would not have an impact on the asset management business’ cash flow until realized.
Consideration of Financing Arrangements
As noted above, in limited circumstances, the asset management business may issue debt or equity to supplement its liquidity. The decision to enter into a particular financing arrangement is made after careful consideration of various factors, including the asset management business’ cash flows from operations, future cash needs, current sources of liquidity, demand for the asset management business’ debt or equity, and prevailing interest rates.
Revolver Facility
Under the 2022 AMH credit facility, AMH may borrow in an aggregate amount not to exceed $1.0 billion and may incur incremental facilities in an aggregate amount not to exceed $250 million plus additional amounts so long as AMH is in compliance with a net leverage ratio not to exceed 4.00 to 1.00. Borrowings under the 2022 AMH credit facility may be used for working capital and general corporate purposes, including without limitation, permitted acquisitions. The 2022 AMH credit facility has a final maturity date of October 12, 2027.
Tax Receivable Agreement
The tax receivable agreement provides for the payment to the Former Managing Partners and Contributing Partners of 85% of the amount of cash savings, if any, in U.S. federal, state, local and foreign income taxes that AGM and its subsidiaries realizes subject to the agreement. For more information regarding the tax receivable agreement, see note 17 to the consolidated financial statements.
AOG Unit Payment
On December 31, 2021, holders of AOG Units (other than Athene and Apollo) sold and transferred a portion of such AOG Units to a wholly-owned subsidiary of the Company, in exchange for an amount equal to $3.66 multiplied by the total number of AOG Units held by such holders immediately prior to such transaction (such payment, the “AOG Unit Payment”). The remainder of the AOG Units held by such holders were exchanged for shares of AGM common stock concurrently with the consummation of the Mergers on January 1, 2022.
As of December 31, 2022, the outstanding AOG Unit Payment amount was $351 million, payable in equal installments through December 31, 2024. See note 17 for more information.
Athora
Athora is a strategic liabilities platform that acquires and reinsures traditional closed life insurance policies and provides capital and reinsurance solutions to insurers in Europe. In 2017, Apollo made a €125 million commitment to Athora, which was fully drawn as of April 2020. Apollo committed an incremental €58 million in 2020 to purchase new equity interests. Additionally, in 2021, Apollo acquired approximately €21.9 million of new equity interests in Athora.
In December 2021, Apollo committed an additional €250 million to purchase new equity interests to support Athora’s ongoing growth initiatives, of which €180 million was drawn as of December 31, 2022.
Apollo Asset Management and Athene are minority investors in Athora with a long-term strategic relationship. Through its share ownership, Apollo Asset Management has approximately 19.9% of the total voting power in Athora, and Athene holds shares in Athora representing 10% of the total voting power in Athora. In addition, Athora shares held by funds and other accounts managed by Apollo represent, in the aggregate, approximately 15.1% of the total voting power in Athora.
Fund Escrow
As of December 31, 2022, the remaining investments and escrow cash of Fund VII was valued at 112% of the fund’s unreturned capital which was below the required escrow ratio of 115%. As a result, the fund is required to place in escrow
94
current and future performance fee distributions to the general partner until the specified return ratio of 115% is met (at the time of a future distribution) or upon liquidation. Realized performance fees currently distributed to the general partner are limited to potential tax distributions and interest on escrow balances per the fund’s partnership agreement.
Clawback
Performance fees from certain of the funds we manage are subject to contingent repayment by the general partner in the event of future losses to the extent that the cumulative performance fees distributed from inception to date exceeds the amount computed as due to the general partner at the final distribution. See “—Overview of Results of Operations—Performance Fees” for the maximum performance fees subject to potential reversal by each fund.
Indemnification Liability
The asset management business recorded an indemnification liability in the event that the Former Managing Partners, Contributing Partners and certain investment professionals are required to pay amounts in connection with a general partner obligation to return previously distributed performance fees. See note 17 to the consolidated financial statements for further information regarding the asset management business’ indemnification liability.
Retirement Services Liquidity
There are two forms of liquidity relevant to our retirement services business, funding liquidity and balance sheet liquidity. Funding liquidity relates to the ability to fund operations. Balance sheet liquidity relates to the ability to liquidate or rebalance Athene’s balance sheet without incurring significant costs from fees, bid-offer spreads, or market impact. Athene manages its liquidity position by matching projected cash demands with adequate sources of cash and other liquid assets. The principal sources of liquidity for our retirement services business, in the ordinary course of business, are operating cash flows and holdings of cash, cash equivalents and other readily marketable assets.
Athene’s investment portfolio is structured to ensure a strong liquidity position over time in order to permit timely payment of policy and contract benefits without requiring asset sales at inopportune times or at depressed prices. In general, liquid assets include cash and cash equivalents, highly rated corporate bonds, unaffiliated preferred stock and public common stock, all of which generally have liquid markets with a large number of buyers. Assets included in modified coinsurance and funds withheld portfolios are available to fund the benefits for the associated obligations but are restricted from other uses. Although the investment portfolio of our retirement services business does contain assets that are generally considered illiquid for liquidity monitoring purposes (primarily mortgage loans, policy loans, real estate, investment funds, and affiliated common stock), there is some ability to raise cash from these assets if needed. Athene has access to additional liquidity through the $1.25 billion AHL credit facility, with potential increases up to $1.75 billion, the AHL liquidity facility with a borrowing capacity of $2.5 billion, with potential increases up to $3.0 billion, and $2.0 billion of committed repurchase facilities. The AHL credit facility was undrawn as of December 31, 2022. On February 7, 2023, Athene borrowed $1.0 billion from the AHL liquidity facility for short-term cash flow needs. Athene also has a registration statement on Form S-3 to provide it with access to the capital markets, subject to market conditions and other factors. Athene is also the counterparty to repurchase agreements with several different financial institutions, pursuant to which it may obtain short-term liquidity, to the extent available. In addition, through Athene’s membership in the FHLB, it is eligible to borrow under variable rate short-term federal funds arrangements to provide additional liquidity.
Athene proactively manages its liquidity position to meet cash needs while minimizing adverse impacts on investment returns. Athene analyzes its cash-flow liquidity over the upcoming 12 months by modeling potential demands on liquidity under a variety of scenarios, taking into account the provisions of its policies and contracts in force, its cash flow position, and the volume of cash and readily marketable securities in its portfolio.
Liquidity risk is monitored, managed and mitigated through a number of stress tests and analyses to assess Athene’s ability to meet its cash flow requirements, as well as the ability of its reinsurance and insurance subsidiaries to meet their collateral obligations, under various stress scenarios. Athene further seeks to mitigate liquidity risk by maintaining access to alternative, external sources of liquidity.
95
Insurance Subsidiaries’ Operating Liquidity
The primary cash flow sources for Athene’s insurance subsidiaries include retirement services product inflows (premiums and deposits), investment income, principal repayments on its investments, net transfers from separate accounts and financial product inflows. Uses of cash include investment purchases, payments to policyholders for surrenders, withdrawals and payout benefits, interest and principal payments on funding agreements, payments to satisfy pension group annuity obligations, policy acquisition costs and general operating costs.
Athene’s policyholder obligations are generally long-term in nature. However, policyholders may elect to withdraw some, or all, of their account value in amounts that exceed our estimates and assumptions over the life of an annuity contract. Athene includes provisions within its annuity policies, such as surrender charges and MVAs, which are intended to protect it from early withdrawals. As of December 31, 2022, approximately 76% of Athene’s deferred annuity liabilities were subject to penalty upon surrender. In addition, as of December 31, 2022, approximately 60% of policies contained MVAs that may also have the effect of limiting early withdrawals if interest rates increase, but may encourage early withdrawals by effectively subsidizing a portion of surrender charges when interest rates decrease. As of December 31, 2022, approximately 29% of Athene’s net reserve liabilities were generally non-surrenderable, including funding agreements, group annuities and payout annuities, while 53% were subject to penalty upon surrender.
Membership in Federal Home Loan Bank
Through its membership in the FHLB, Athene is eligible to borrow under variable rate short-term federal funds arrangements to provide additional liquidity. The borrowings must be secured by eligible collateral such as mortgage loans, eligible CMBS or RMBS, government or agency securities and guaranteed loans. As of December 31, 2022, Athene had no outstanding borrowings under these arrangements.
Athene has issued funding agreements to the FHLB. These funding agreements were issued in an investment spread strategy, consistent with other investment spread operations. As of December 31, 2022, Athene had funding agreements outstanding with the FHLB in the aggregate principal amount of $3.7 billion.
The maximum FHLB indebtedness by a member is determined by the amount of collateral pledged and cannot exceed a specified percentage of the member’s total statutory assets dependent on the internal credit rating assigned to the member by the FHLB. As of December 31, 2022, the total maximum borrowing capacity under the FHLB facilities was limited to $52.4 billion. However, Athene’s ability to borrow under the facilities is constrained by the availability of assets that qualify as eligible collateral under the facilities and certain other limitations. Considering these limitations, as of December 31, 2022 Athene had the ability to draw up to an estimated $5.8 billion, inclusive of borrowings then outstanding. This estimate is based on Athene’s internal analysis and assumptions and may not accurately measure collateral which is ultimately acceptable to the FHLB.
Securities Repurchase Agreements
Athene engages in repurchase transactions whereby it sells fixed income securities to third parties, primarily major brokerage firms or commercial banks, with a concurrent agreement to repurchase such securities at a determined future date. Athene requires that, at all times during the term of the repurchase agreements, it maintains sufficient cash or other liquid assets sufficient to allow it to fund substantially all of the repurchase price. Proceeds received from the sale of securities pursuant to these arrangements are generally invested in short-term investments, with the offsetting obligation to repurchase the security included within payables for collateral on derivatives and securities to repurchase on the consolidated statements of financial condition. As per the terms of the repurchase agreements, Athene monitors the market value of the securities sold and may be required to deliver additional collateral (which may be in the form of cash or additional securities) to the extent that the value of the securities sold decreases prior to the repurchase date.
As of December 31, 2022, the payables for repurchase agreements were $4.7 billion, while the fair value of securities and collateral held by counterparties backing the repurchase agreements was $5.0 billion. As of December 31, 2022, payables for repurchase agreements were comprised of $1.9 billion of short-term and $2.9 billion of long-term repurchase agreements.
96
Dividends from Insurance Subsidiaries
AHL is a holding company whose primary liquidity needs include the cash-flow requirements relating to its corporate activities, including its day-to-day operations, debt servicing, preferred and common stock dividend payments and strategic transactions, such as acquisitions. The primary source of AHL’s cash flow is dividends from its subsidiaries, which are expected to be adequate to fund cash flow requirements based on current estimates of future obligations.
The ability of AHL’s insurance subsidiaries to pay dividends is limited by applicable laws and regulations of the jurisdictions where the subsidiaries are domiciled, as well as agreements entered into with regulators. These laws and regulations require, among other things, the insurance subsidiaries to maintain minimum solvency requirements and limit the amount of dividends these subsidiaries can pay.
Subject to these limitations and prior notification to the appropriate regulatory agency, Athene’s U.S. insurance subsidiaries are permitted to pay ordinary dividends based on calculations specified under insurance laws of the relevant state of domicile. Any distributions above the amount permitted by statute in any twelve month period are considered to be extraordinary dividends, and require the approval of the appropriate regulator prior to payment. AHL does not currently plan on having the U.S. subsidiaries pay any dividends to their parents.
Dividends from AHL’s subsidiaries are projected to be the primary source of AHL’s liquidity. Under the Bermuda Insurance Act, each of Athene’s Bermuda insurance subsidiaries is prohibited from paying a dividend in an amount exceeding 25% of the prior year’s statutory capital and surplus, unless at least two members of the board of directors of the Bermuda insurance subsidiary and its principal representative in Bermuda sign and submit to the Bermuda Monetary Authority (“BMA”) an affidavit attesting that a dividend in excess of this amount would not cause the Bermuda insurance subsidiary to fail to meet its relevant margins. In certain instances, the Bermuda insurance subsidiary would also be required to provide prior notice to the BMA in advance of the payment of dividends. In the event that such an affidavit is submitted to the BMA in accordance with the Bermuda Insurance Act, and further subject to the Bermuda insurance subsidiary meeting its relevant margins, the Bermuda insurance subsidiary is permitted to distribute up to the sum of 100% of statutory surplus and an amount less than 15% of its total statutory capital. Distributions in excess of this amount require the approval of the BMA.
The maximum distribution permitted by law or contract is not necessarily indicative of the insurance subsidiaries’ actual ability to pay such distributions, which may be further restricted by business and other considerations, such as the impact of such distributions on surplus, which could affect Athene’s ratings or competitive position and the amount of premiums that can be written. Specifically, the level of capital needed to maintain desired financial strength ratings from rating agencies, including S&P, A.M. Best, Fitch and Moody’s, is of particular concern when determining the amount of capital available for distributions. AHL believes its insurance subsidiaries have sufficient statutory capital and surplus, combined with additional capital available to be provided by AHL, to meet their financial strength ratings objectives. Finally, state insurance laws and regulations require that the statutory surplus of Athene’s insurance subsidiaries following any dividend or distribution must be reasonable in relation to their outstanding liabilities and adequate for the insurance subsidiaries’ financial needs.
Other Sources of Funding
Athene may seek to secure additional funding at the AHL level by means other than dividends from subsidiaries, such as by drawing on the undrawn $1.25 billion AHL credit facility, drawing on the remaining $1.5 billion of the AHL liquidity facility or by pursuing future issuances of debt or preference shares to third-party investors. The AHL credit facility contains various standard covenants with which Athene must comply, including maintaining a Consolidated Debt to Capitalization Ratio (as such term is defined in the AHL credit facility) of not greater than 35% at the end of any quarter, maintaining a minimum Consolidated Net Worth (as such term is defined in the AHL credit facility) of no less than $7.3 billion, and restrictions on the ability to incur debt and liens, in each case with certain exceptions. The AHL liquidity facility also contains various standard covenants with which Athene must comply, including maintaining an ALRe minimum Consolidated Net Worth (as such term is defined in the AHL liquidity facility) of no less than $9.3 billion and restrictions on the ability to incur debt and liens, in each case with certain exceptions.
97
Future Debt Obligations
Athene had long-term debt of $3.7 billion as of December 31, 2022, which includes notes with maturities in 2028, 2030, 2031, 2033, 2051, and 2052. See note 13 to the consolidated financial statements for further information regarding Athene’s debt arrangements.
Capital
Athene believes it has a strong capital position and that it is well positioned to meet policyholder and other obligations. Athene measures capital sufficiency using an internal capital model which reflects management’s view on the various risks inherent to its business, the amount of capital required to support its core operating strategies and the amount of capital necessary to maintain its current ratings in a recessionary environment. The amount of capital required to support Athene’s core operating strategies is determined based upon internal modeling and analysis of economic risk, as well as inputs from rating agency capital models and consideration of both NAIC RBC and Bermuda capital requirements. Capital in excess of this required amount is considered excess equity capital, which is available to deploy. As of December 31, 2022, Athene’s U.S. RBC ratio was 387%, its Bermuda RBC ratio was 407% and its consolidated RBC ratio was 416%. The formulas for determining the amount of RBC specify various weighting factors that are applied to financial balances or various levels of activity based on the perceived degree of risk.
ACRA
ACRA provides Athene with access to on-demand capital to support its growth strategies and capital deployment opportunities. ACRA provides a capital source to fund both Athene’s inorganic and organic channels, including pension group annuity, funding agreement and retail channels. This strategic capital solution allows Athene the flexibility to simultaneously deploy capital across multiple accretive avenues, while maintaining a strong financial position.
Critical Accounting Estimates and Policies
This Management’s Discussion and Analysis of Financial Condition and Results of Operations is based upon the consolidated financial statements, which have been prepared in accordance with U.S. GAAP. The preparation of financial statements in accordance with U.S. GAAP requires the use of estimates and assumptions that could affect the reported amounts of assets and liabilities, the disclosure of contingent assets and liabilities and the reported amounts of revenues and expenses. Actual results could differ from these estimates. A summary of our significant accounting policies is presented in note 2 to our consolidated financial statements. The following is a summary of our accounting policies that are affected most by judgments, estimates and assumptions.
Critical Accounting Estimates and Policies - Overall
Consolidation
We consolidate entities on a variable interest or voting interest model or, if applicable, apply specialized accounting guidance for investment companies. Significant judgment may be required for the application of the VIE guidance and to determine whether entities qualify as investment companies.
The assessment of whether an entity is a variable interest entity and the determination of whether Apollo should consolidate requires judgment. Those judgments include, but are not limited to: (i) determining whether the total equity investment at risk is sufficient to permit the entity to finance its activities without additional subordinated financial support, (ii) evaluating whether the holders of equity investment at risk, as a group, can make decisions that have a significant effect on the success of the entity, (iii) determining whether the equity investors have proportionate voting rights to their obligations to absorb losses or rights to receive the expected residual returns from an entity and (iv) evaluating the nature of the relationship and activities of those related parties with shared power or under common control for purposes of determining which party within the related-party group is most closely associated with the VIE. Judgments are also made in determining whether a member in the equity group has a controlling financial interest, including power to direct activities that most significantly impact the VIE’s economic performance and rights to receive benefits or obligations to absorb losses that could be potentially significant to the VIE. This analysis considers all relevant economic interests, including proportionate interests held through related parties.
98
Additionally, evaluating an entity to determine whether it meets the characteristics of an investment company is qualitative in nature and may involve significant judgment. The Company has retained this specialized accounting for investment companies in consolidation.
Equity-Based Compensation
Equity-based compensation is generally measured based on the grant date fair value of the award. Certain RSUs granted by the Company vest subject to continued employment and the Company’s receipt of performance fees, within prescribed periods, sufficient to cover the associated equity-based compensation expense. Equity-based compensation expense for such awards, if and when granted, will be recognized on an accelerated recognition method over the requisite service period to the extent the performance fee metrics are met or deemed probable. The addition of these performance measures helps to promote the interests of our shareholders and fund investors by making RSU vesting contingent on the realization and distribution of profits on our funds. For more information regarding Apollo’s equity-based compensation awards, see note 14 to our consolidated financial statements. The Company’s assumptions made to determine the fair value on grant date are embodied in the calculations of compensation expense.
A significant part of our compensation expense is derived from amortization of RSUs. The fair value of all RSU grants after March 29, 2011 is based on the grant date fair value, which considers the public share price of AGM. The Company has three types of RSU grants, which we refer to as Plan Grants, Bonus Grants, and Performance Grants. Plan Grants may or may not provide the right to receive dividend equivalents until the RSUs vest and, for grants made after 2011, the underlying shares are generally issued by March 15th after the year in which they vest. For Plan Grants, the grant date fair value is based on the public share price of the Company, and is discounted for transfer restrictions and lack of dividends until vested if applicable. Bonus Grants provide the right to receive dividend equivalents on both vested and unvested RSUs and Performance Grants provide the right to receive dividend equivalents on vested RSUs and may also provide the right to receive dividend equivalents on unvested RSUs. Both Bonus Grants and Performance Grants are generally issued by March 15th of the year following the year in which they vest. For Bonus Grants and Performance Grants, the grant date fair value for the periods presented is based on the public share price of AGM, and is discounted for transfer restrictions.
We utilized the present value of a growing annuity formula to calculate a discount for the lack of pre-vesting dividends on certain Plan Grant and Performance Grant RSUs. The weighted average for the inputs utilized for the shares granted are presented in the table below for Plan Grants and Performance Grants:
| For the Years Ended December 31, | |||||||||||||||||
| 2022 | 2021 | 2020 | |||||||||||||||
| Plan Grants: | |||||||||||||||||
Dividend Yield1
|
3.0% | 3.0% | 5.0% | ||||||||||||||
Cost of Equity Capital Rate3
|
12.3% | 11.7% | 11.6% | ||||||||||||||
| Performance Grants: | |||||||||||||||||
Dividend Yield2
|
2.9% | 2.2% | 5.1% | ||||||||||||||
Cost of Equity Capital Rate3
|
12.3% | 12.0% | 10.9% | ||||||||||||||
1 Calculated based on the historical dividends paid during the year ended December 31, 2022 and the price of the Company’s common stock as of the measurement date of the grant on a weighted average basis.
| |||||||||||||||||
2 Calculated based on the historical dividends paid during the three months ended December 31, 2022 and the price of the Company’s common stock as of the measurement date of the grant on a weighted average basis.
| |||||||||||||||||
3 Assumes a discount rate that was equivalent to the opportunity cost of foregoing distributions on unvested Plan Grant and Performance Grant RSUs as of the valuation date, based on the Capital Asset Pricing Model (“CAPM”). CAPM is a commonly used mathematical model for developing expected returns.
| |||||||||||||||||
We utilize the Finnerty Model to calculate a marketability discount on the Plan Grant, Bonus Grant and Performance Grant RSUs to account for the lag between vesting and issuance. The Finnerty Model provides for a valuation discount reflecting the holding period restriction embedded in a restricted security preventing its sale over a certain period of time.
The Finnerty Model proposes to estimate a discount for lack of marketability such as transfer restrictions by using an option pricing theory. This model has gained recognition through its ability to address the magnitude of the discount by considering the volatility of a company’s stock price and the length of restriction. The concept underpinning the Finnerty Model is that a restricted security cannot be sold over a certain period of time. Further simplified, a restricted share of equity in a company can be viewed as having forfeited a put on the average price of the marketable equity over the restriction period (also known as an
99
“Asian Put Option”). If we price an Asian Put Option and compare this value to that of the assumed fully marketable underlying security, we can effectively estimate the marketability discount. The inputs utilized in the Finnerty Model are (i) length of holding period, (ii) volatility and (iii) dividend yield.
The weighted average for the inputs utilized for the shares granted are presented in the table below for Plan Grants, Bonus Grants and Performance Grants:
| For the Years Ended December 31, | |||||||||||||||||
| 2022 | 2021 | 2020 | |||||||||||||||
| Plan Grants: | |||||||||||||||||
| Holding Period Restriction (in years) | 1.2 | 4.6 | 0.6 | ||||||||||||||
Volatility1
|
44.8% | 32.8% | 58.8% | ||||||||||||||
Dividend Yield2
|
3.0% | 3.0% | 5.0% | ||||||||||||||
| Bonus Grants: | |||||||||||||||||
| Holding Period Restriction (in years) | 0.2 | 0.2 | 0.2 | ||||||||||||||
Volatility1
|
34.5% | 34.9% | 29.2% | ||||||||||||||
Dividend Yield2
|
2.9% | 3.9% | 5.0% | ||||||||||||||
| Performance Grants: | |||||||||||||||||
| Holding Period Restriction (in years) | 0.9 | 0.6 | 1.0 | ||||||||||||||
Volatility1
|
37.4% | 27.0% | 47.6% | ||||||||||||||
Dividend Yield2
|
2.9% | 2.2% | 5.1% | ||||||||||||||
1 The Company determined the expected volatility based on the volatility of the Company’s common stock price as of the grant date with consideration to comparable companies.
| |||||||||||||||||
2 Calculated based on the historical dividends paid during the twelve months ended December 31, 2022, 2021 and 2020 and the Company’s common stock price as of the measurement date of the grant on a weighted average basis.
| |||||||||||||||||
Income Taxes
Significant judgment is required in determining tax expense and in evaluating certain and uncertain tax positions. The Company recognizes the tax benefit of uncertain tax positions when the position is “more likely than not” to be sustained upon examination, including resolution of any related appeals or litigation processes, based on the technical merits of the position. The tax benefit is measured as the largest amount of benefit that has a greater than 50% likelihood of being realized upon ultimate settlement. If a tax position is not considered more likely than not to be sustained, then no benefits of the position are recognized. The Company’s tax positions are reviewed and evaluated quarterly to determine whether the Company has uncertain tax positions that require financial statement recognition.
Deferred tax assets and liabilities are recognized for the expected future tax consequences of differences between the carrying amount of assets and liabilities and their respective tax bases using currently enacted tax rates. The effect on deferred tax assets and liabilities of a change in tax rates is recognized in income in the period during which the change is enacted. Deferred tax assets are reduced by a valuation allowance when it is more likely than not that all or a portion of the deferred tax assets will not be realized.
Critical Accounting Estimates and Policies - Asset Management
Investments, at Fair Value
On a quarterly basis, Apollo utilizes valuation committees consisting of members from senior management, to review and approve the valuation results related to the investments of the funds it manages. For certain publicly traded vehicles managed by Apollo, a review is performed by an independent board of directors. The Company also retains external valuation firms to provide third-party valuation consulting services to Apollo, which consist of certain limited procedures that management identifies and requests them to perform. The limited procedures provided by the external valuation firms assist management with validating their valuation results or determining fair value. The Company performs various back-testing procedures to validate their valuation approaches, including comparisons between expected and observed outcomes, forecast evaluations and
100
variance analyses. However, because of the inherent uncertainty of valuation, the estimated values may differ significantly from the values that would have been used had a ready market for the investments existed, and the differences could be material.
The fair values of the investments in the funds we manage can be impacted by changes to the assumptions used in the underlying valuation models. For further discussion on the impact of changes to valuation assumptions see “Item 7A. Quantitative and Qualitative Disclosures About Market Risk—Sensitivity” in this report. There have been no material changes to the valuation approaches utilized during the periods that our financial results are presented in this report.
Fair Value of Financial Instruments
Except for the Company’s debt obligations (each as defined in note 13 to our consolidated financial statements), Apollo’s financial instruments are recorded at fair value or at amounts whose carrying values approximate fair value. See “—Investments, at Fair Value” above. While Apollo’s valuations of portfolio investments are based on assumptions that Apollo believes are reasonable under the circumstances, the actual realized gains or losses will depend on, among other factors, future operating results, the value of the assets and market conditions at the time of disposition, any related transaction costs and the timing and manner of sale, all of which may ultimately differ significantly from the assumptions on which the valuations were based. Financial instruments’ carrying values generally approximate fair value because of the short-term nature of those instruments or variable interest rates related to the borrowings.
Revenue Recognition
Performance Fees
Apollo earns performance fees from funds we manage as a result of such funds achieving specified performance criteria. Such performance fees generally are earned based upon a fixed percentage of realized and unrealized gains of various funds after meeting any applicable hurdle rate or threshold minimum.
Performance allocations are performance fees that are generally structured from a legal standpoint as an allocation of capital to the Company. Performance allocations from certain of the funds that we manage are subject to contingent repayment and are generally paid to us as particular investments made by the funds are realized. If, however, upon liquidation of a fund, the aggregate amount paid to us as performance fees exceeds the amount actually due to us based upon the aggregate performance of the fund, the excess (in certain cases net of taxes) is required to be returned by us to that fund. We account for performance allocations as an equity method investment, and accordingly, we accrue performance allocations quarterly based on fair value of the underlying investments and separately assess if contingent repayment is necessary. The determination of performance allocations and contingent repayment considers both the terms of the respective partnership agreements and the current fair value of the underlying investments within the funds. Estimates and assumptions are made when determining the fair value of the underlying investments within the funds and could vary depending on the valuation methodology that is used. See “Investments, at Fair Value” below for further discussion related to significant estimates and assumptions used for determining fair value of the underlying investments in our credit, private equity and real assets funds.
Incentive fees are performance fees structured as a contractual fee arrangement rather than a capital allocation. Incentive fees are generally received from the management of CLOs, managed accounts and MFIC. For a majority of our incentive fees, once the quarterly or annual incentive fees have been determined, there is no look-back to prior periods for a potential contingent repayment, however, certain other incentive fees can be subject to contingent repayment at the end of the life of the entity. In accordance with the revenue recognition standard, certain incentive fees are considered a form of variable consideration and therefore are deferred until fees are probable to not be significantly reversed. There is significant judgment involved in determining if the incentive fees are probable to not be significantly reversed, but generally the Company will defer the revenue until the fees are crystallized or are no longer subject to clawback or reversal.
Management Fees
Management fees related to the yield funds we manage can be based on net asset value, gross assets, adjusted cost of all unrealized portfolio investments, capital commitments, adjusted assets, capital contributions, or stockholders’ equity, all as defined in the respective partnership agreements. The management fee calculations for the yield funds we manage that consider net asset value, gross assets, adjusted cost of all unrealized portfolio investments and adjusted assets are normally based on the terms of the respective partnership agreements and the current fair value of the underlying investments within the funds. Estimates and assumptions are made when determining the fair value of the underlying investments within the funds and could
101
vary depending on the valuation methodology that is used. The management fees related to equity funds we manage, by contrast, are generally based on a fixed percentage of the committed capital or invested capital. The corresponding fee calculations that consider committed capital or invested capital are both objective in nature and therefore do not require the use of significant estimates or assumptions. The management fees related to the hybrid funds we manage are generally based on net asset value, gross assets, or committed or invested capital. See “Investments, at Fair Value” below for further discussion related to significant estimates and assumptions used for determining fair value of the underlying investments in the yield, hybrid and equity funds.
Profit Sharing Expense
Profit sharing expense is primarily a result of agreements with employees to compensate them based on the ownership interest they have in the general partners of the Apollo funds. Therefore, changes in the fair value of the underlying investments in the funds we manage and advise affect profit sharing expense. Employees are generally allocated approximately 30% to 61%, of the total performance fees which is driven primarily by changes in fair value of the underlying fund’s investments and is treated as compensation expense. Additionally, profit sharing expenses paid may be subject to clawback from employees and former employees to the extent not indemnified. When applicable, the accrual for potential clawback of previously distributed profit sharing amounts, which is a component of due from related parties on the consolidated statements of financial condition, represents all amounts previously distributed to employees and former employees that would need to be returned to the general partner if the Apollo funds were to be liquidated based on the current fair value of the underlying funds’ investments as of the reporting date. The actual general partner receivable, however, would not become realized until the end of a fund’s life.
Several of the Company’s employee remuneration programs are dependent upon performance fee realizations, including the Incentive Pool, and dedicated performance fee rights and certain RSU awards for which vesting is contingent, in part, on the realization of performance fees in a specified period. The Company established these programs to attract and retain, and provide incentive to, partners and employees of the Company and to more closely align the overall compensation of partners and employees with the overall realized performance of the Company. Dedicated performance fee rights entitle their holders to payments arising from performance fee realizations. The Incentive Pool enables certain employees to earn discretionary compensation based on realized performance fees in a given year, which amounts are reflected in profit sharing expense in the Company’s consolidated financial statements. Amounts earned by participants as a result of their performance fee rights (whether dedicated or Incentive Pool) will vary year-to-year depending on the overall realized performance of the Company (and, in the case of the Incentive Pool, on their individual performance). There is no assurance that the Company will continue to compensate individuals through the same types of arrangements in the future and there may be periods when the Company determines that allocations of realized performance fees are not sufficient to compensate individuals, which may result in an increase in salary, bonus and benefits, the modification of existing programs or the use of new remuneration programs. Reductions in performance fee revenues could also make it harder to retain employees and cause employees to seek other employment opportunities.
Critical Accounting Estimates and Policies - Retirement Services
Investments
The Company is responsible for the fair value measurement of investments presented in the consolidated financial statements. The Company performs regular analysis and review of its valuation techniques, assumptions and inputs used in determining fair value to evaluate if the valuation approaches are appropriate and consistently applied, and the various assumptions are reasonable. The Company also performs quantitative and qualitative analysis and review of the information and prices received from commercial pricing services and broker-dealers, to verify it represents a reasonable estimate of the fair value of each investment. In addition, the Company uses both internally-developed and commercially-available cash flow models to analyze the reasonableness of fair values using credit spreads and other market assumptions, where appropriate. For investment funds, the Company typically recognizes its investment, including those for which it has elected the fair value option, based on net asset value information provided by the general partner or related asset manager. For a discussion of investment funds for which it has elected the fair value option, see note 7 to the consolidated financial statements.
102
Valuation of Fixed Maturity Securities, Equity Securities and Mortgage Loans
The following table presents the fair value of fixed maturity securities, equity securities and mortgage loans, including those with related parties and those held by consolidated VIEs, by pricing source and fair value hierarchy:
| December 31, 2022 | |||||||||||||||||||||||
| (In millions) | Total | Level 1 | Level 2 | Level 3 | |||||||||||||||||||
| Fixed maturity securities | |||||||||||||||||||||||
| AFS securities | |||||||||||||||||||||||
| Priced via commercial pricing services | $ | 78,335 | $ | 2,570 | $ | 75,758 | $ | 7 | |||||||||||||||
| Priced via independent broker-dealer quotations | 23,166 | — | 20,475 | 2,691 | |||||||||||||||||||
| Priced via models or other methods | 10,724 | — | — | 10,724 | |||||||||||||||||||
| Trading securities | |||||||||||||||||||||||
| Priced via commercial pricing services | 1,087 | 21 | 1,066 | — | |||||||||||||||||||
| Priced via independent broker-dealer quotations | 506 | 2 | 453 | 51 | |||||||||||||||||||
| Priced via models or other methods | 880 | — | — | 880 | |||||||||||||||||||
| Trading securities of consolidated VIEs | 1,063 | 5 | 436 | 622 | |||||||||||||||||||
| Total fixed maturity securities, including related parties and VIEs | 115,761 | 2,598 | 98,188 | 14,975 | |||||||||||||||||||
| Equity securities | |||||||||||||||||||||||
| Priced via commercial pricing services | 995 | 150 | 845 | — | |||||||||||||||||||
| Priced via independent broker-dealer quotations | 15 | — | — | 15 | |||||||||||||||||||
| Priced via models or other methods | 356 | — | — | 356 | |||||||||||||||||||
| Total equity securities, including related parties and VIEs | 1,366 | 150 | 845 | 371 | |||||||||||||||||||
| Mortgage loans | |||||||||||||||||||||||
| Priced via commercial pricing services | 27,644 | — | — | 27,644 | |||||||||||||||||||
| Priced via models or other methods | 1,112 | — | — | 1,112 | |||||||||||||||||||
| Mortgage loans of consolidated VIEs | 2,055 | — | — | 2,055 | |||||||||||||||||||
| Total mortgage loans, including related parties and VIEs | 30,811 | — | — | 30,811 | |||||||||||||||||||
| Total fixed maturity securities, equity securities and mortgage loans, including related parties and consolidated VIEs | $ | 147,938 | $ | 2,748 | $ | 99,033 | $ | 46,157 | |||||||||||||||
| Percent of total | 100.0 | % | 1.9 | % | 66.9 | % | 31.2 | % | |||||||||||||||
The Company measures the fair value of its securities based on assumptions used by market participants in pricing the assets, which may include inherent risk, restrictions on the sale or use of an asset, or nonperformance risk. The estimate of fair value is the price that would be received to sell a security in an orderly transaction between market participants in the principal market, or the most advantageous market in the absence of a principal market, for that security. Market participants are assumed to be independent, knowledgeable, able and willing to transact an exchange while not under duress. The valuation of securities involves judgment, is subject to considerable variability and is revised as additional information becomes available. As such, changes in, or deviations from, the assumptions used in such valuations can significantly affect the Company’s consolidated financial statements. Financial markets are susceptible to severe events evidenced by rapid depreciation in security values accompanied by a reduction in asset liquidity. The Company’s ability to sell securities, or the price ultimately realized upon the sale of securities, depends upon the demand and liquidity in the market and increases the use of judgment in determining the estimated fair value of certain securities. Accordingly, estimates of fair value are not necessarily indicative of the amounts that could be realized in a current or future market exchange.
For fixed maturity securities, the Company obtains the fair values, when available, based on quoted prices in active markets that are regularly and readily obtainable. Generally, these are liquid securities and the valuation does not require significant management judgment. When quoted prices in active markets are not available, fair value is based on market standard valuation techniques, giving priority to observable inputs. The Company obtains the fair value for most marketable bonds without an active market from several commercial pricing services. The pricing services incorporate a variety of market observable information in their valuation techniques, including benchmark yields, broker-dealer quotes, credit quality, issuer spreads, bids, offers, and other reference data. For certain fixed maturity securities without an active market, an internally-developed discounted cash flow or other approach is utilized to calculate the fair value. A discount rate is used, which adjusts a market
103
comparable base rate for securities with similar characteristics for credit spread, market illiquidity or other adjustments. The fair value of privately placed fixed maturity securities are based on the credit quality and duration of comparable marketable securities, which may be securities of another issuer with similar characteristics. In some instances, the Company uses a matrix-based pricing model, which considers the current level of risk-free interest rates, corporate spreads, credit quality of the issuer, and cash flow characteristics of the security. The Company also considers additional factors, such as net worth of the borrower, value of collateral, capital structure of the borrower, presence of guarantees and its evaluation of the borrower’s ability to compete in its relevant market.
For equity securities, the Company obtains the fair value, when available, based on quoted market prices. Other equity securities, typically private equities or equity securities not traded on an exchange, are valued based on other sources, such as commercial pricing services or brokers.
The Company has elected the fair value option on its mortgage loan portfolio. The Company uses independent commercial pricing services to value its mortgage loan portfolio. Discounted cash flow analysis is performed through which the loans’ contractual cash flows are modeled and an appropriate discount rate is determined to discount the cash flows to arrive at a present value. Financial factors, credit factors, collateral characteristics and current market conditions are all taken into consideration when performing the discounted cash flow analysis. The Company performs vendor due diligence exercises annually to review vendor processes, models and assumptions. Additionally, the Company reviews price movements on a quarterly basis to ensure reasonableness.
Future Policy Benefits
The future policy benefit liabilities associated with long duration contracts include term and whole-life products, accident and health, disability, and deferred and immediate annuities with life contingencies. Liabilities for non-participating long duration contracts are established using accepted actuarial valuation methods which require Athene to make certain assumptions regarding expenses, investment yields, mortality, morbidity, and persistency, with a provision for adverse deviation, at the date of issue or acquisition. As of December 31, 2022, the reserve investment yield assumptions for non-participating contracts range from 2.3% to 6.6% and are specific to Athene’s expected earned rate on the asset portfolio supporting the reserves. Athene bases other key assumptions, such as mortality and morbidity, on industry standard data adjusted to align with actual company experience, if necessary. Premium deficiency tests are performed periodically using current assumptions, without provisions for adverse deviation, to test the appropriateness of the established reserves. If the reserves using current assumptions are greater than the existing reserves, the excess is recorded and the initial assumptions are revised.
Liabilities for Guaranteed Living Withdrawal Benefits and Guaranteed Minimum Death Benefits
Athene issues and reinsures deferred annuity contracts which contain GLWB and GMDB riders. It establishes future policy benefits for GLWB and GMDB by estimating the expected value of withdrawal and death benefits in excess of the projected account balance. Athene recognizes the excess proportionally over the accumulation period based on total actual and expected assessments. The methods used to estimate the liabilities have assumptions about policyholder behavior, which includes lapses, withdrawals and utilization of the benefit riders, mortality, and market conditions affecting the account balance.
Projected policyholder lapse and withdrawal behavior assumptions are set in one of two ways. For certain blocks of business, this behavior is a function of Athene’s predictive analytics model which considers various observable inputs. For the remaining blocks of business, these assumptions are set at the product level by grouping individual policies sharing similar features and guarantees and reviewed periodically against experience. Base lapse rates consider the level of surrender charges and are dynamically adjusted based on the level of current interest rates relative to the guaranteed rates and the amount by which any rider guarantees are in a net positive position. Rider utilization assumptions consider the number and timing of policyholders electing the riders. Athene tracks and updates this assumption as experience emerges. Mortality assumptions are set at the product level and generally based on standard industry tables, adjusted for historical experience and a provision for mortality improvement. Projected guaranteed benefit amounts in excess of the underlying account balances are considered over a range of scenarios in order to capture Athene’s exposure to the guaranteed withdrawal and death benefits.
The assessments used to accrue liabilities are based on interest margins, rider charges, surrender charges and realized gains (losses). As such, future reserve changes can be sensitive to changes in investment results and the impacts of shadow adjustments, which represent the impact of assuming unrealized gains (losses) are realized in future periods. As of December 31, 2022, the GLWB and GMDB liability balance, including the impacts of shadow adjustments, totaled $5.3 billion. The relative sensitivity of the GLWB and GMDB liability balance from changes to these assumptions, including the impacts of
104
shadow adjustments from hypothetical changes in projected assessments, changes in the discount rate and annual equity growth, has decreased and are not significant following the business combination and purchase accounting election described in note 3.
Derivatives
Valuation of Embedded Derivatives on Indexed Annuities
Athene issues and reinsures products, primarily indexed annuity products, or purchases investments that contain embedded derivatives. If Athene determines the embedded derivative has economic characteristics not clearly and closely related to the economic characteristics of the host contract, and a separate instrument with the same terms would qualify as a derivative instrument, the embedded derivative is bifurcated from the host contract and accounted for separately, unless the fair value option is elected on the host contract.
Indexed annuities and indexed universal life insurance contracts allow the policyholder to elect a fixed interest rate return or an equity market component for which interest credited is based on the performance of certain equity market indices. The equity market option is an embedded derivative, similar to a call option. The benefit reserve is equal to the sum of the fair value of the embedded derivative and the host (or guaranteed) component of the contracts. The fair value of the embedded derivatives represents the present value of cash flows attributable to the indexed strategies. The embedded derivative cash flows are based on assumptions for future policy growth, which include assumptions for expected index credits on the next policy anniversary date, future equity option costs, volatility, interest rates, and policyholder behavior. The embedded derivative cash flows are discounted using a rate that reflects Athene’s credit rating. The host contract is established at contract inception as the initial account value less the initial fair value of the embedded derivative and accreted over the policy’s life. Contracts acquired through a business combination which contain an embedded derivative are re-bifurcated as of the acquisition date.
In general, the change in the fair value of the embedded derivatives will not directly correspond to the change in fair value of the hedging derivative assets. The derivatives are intended to hedge the index credits expected to be granted at the end of the current term. The options valued in the embedded derivatives represent the rights of the policyholder to receive index credits over the period indexed strategies are made available to the policyholder, which is typically longer than the current term of the options. From an economic basis, Athene believes it is suitable to hedge with options that align with index terms of our indexed annuity products because policyholder accounts are credited with index performance at the end of each index term. However, because the value of an embedded derivative in an indexed annuity contract is longer-dated, there is a duration mismatch which may lead to differences in the recognition of income and expense for accounting purposes.
A significant assumption in determining policy liabilities for indexed annuities is the vector of rates used to discount indexed strategy cash flows. The change in risk free rates is expected to drive most of the movement in the discount rates between periods. Changes to credit spreads for a given credit rating as well as any change to Athene’s credit rating requiring a revised level of nonperformance risk would also be factors in the changes to the discount rate. If the discount rates used to discount the indexed strategy cash flows were to fluctuate, there would be a resulting change in reserves for indexed annuities recorded through the consolidated statements of operations.
As of December 31, 2022, Athene had embedded derivative liabilities classified as Level 3 in the fair value hierarchy of $5.8 billion. The increase (decrease) to the embedded derivatives on indexed annuity products from hypothetical changes in discount rates is summarized as follows:
| (In millions) | December 31, 2022 | ||||
| +100 bps discount rate | $ | (299) | |||
| –100 bps discount rate | 331 | ||||
However, these estimated effects do not take into account potential changes in other variables, such as equity price levels and market volatility, which can also contribute significantly to changes in carrying values. Therefore, the quantitative impact presented in the table above does not necessarily correspond to the ultimate impact on the consolidated financial statements. In determining the ranges, Athene has considered current market conditions, as well as the market level of discount rates that can reasonably be anticipated over the near-term. For additional information regarding sensitivities to interest rate risk and public equity risk, see “Item 7A. Quantitative and Qualitative Disclosures About Market Risk—Sensitivity”.
105
Deferred Acquisition Costs, Deferred Sales Inducements, and Value of Business Acquired
Costs related directly to the successful acquisition of new or renewal insurance or investment contracts are deferred to the extent they are recoverable from future premiums or gross profits. These costs consist of commissions and policy issuance costs, as well as sales inducements credited to policyholder account balances. Athene performs periodic tests, including at issuance, to determine if the deferred costs are recoverable. If it is determined that the deferred costs are not recoverable, Athene records a cumulative charge to the current period.
Deferred costs related to universal life-type policies and investment contracts with significant revenue streams from sources other than investment of the policyholder funds are amortized over the lives of the policies, based upon the proportion of the present value of actual and expected deferred costs to the present value of actual and expected gross profits to be earned over the life of the policies. Gross profits include investment spread margins, surrender charge income, policy administration, changes in the GLWB and GMDB reserves, and realized gains (losses) on investments. Current period gross profits for indexed annuities also include the change in fair value of both freestanding and embedded derivatives.
The estimates of expected gross profits and margins are based on assumptions using accepted actuarial methods related to policyholder behavior, including lapses and the utilization of benefit riders, mortality, yields on investments supporting the liabilities, future interest credited amounts (including indexed related credited amounts on fixed indexed annuity products), and other policy changes as applicable, and the level of expenses necessary to maintain the policies over their expected lives. Each reporting period, Athene updates estimated gross profits with actual gross profits as part of the amortization process. Athene also periodically revises the key assumptions used in the amortization calculation which results in revisions to the estimated future gross profits. The effects of changes in assumptions are recorded as unlocking in the period in which the changes are made.
Athene establishes VOBA for blocks of insurance contracts acquired through the acquisition of insurance entities. The fair value of the liabilities purchased is determined using market participant assumptions at the time of acquisition and represents the amount an acquirer would expect to be compensated to assume the contracts. Athene records the fair value of the liabilities assumed in two components: reserves and VOBA. Reserves are established using best estimate assumptions, plus a provision for adverse deviation where applicable, as of the business combination date. VOBA is the difference between the fair value of the liabilities and the reserves. VOBA can be either positive or negative. Any negative VOBA is recorded to the same financial statement line on the consolidated statements of financial condition as the associated reserves. Positive VOBA is recorded in DAC, DSI and VOBA on the consolidated statements of financial condition.
VOBA and negative VOBA are amortized in relation to applicable policyholder liabilities. Significant assumptions which impact VOBA and negative VOBA amortization are consistent with those which impact the measurement of policyholder liabilities.
Estimated future gross profits vary based on a number of factors but are typically most sensitive to changes in investment spread margins, which are the most significant component of gross profits. If estimated gross profits for all future years on business in force were to change, including the impacts of shadow adjustments, there would be a resulting increase or decrease to the balances of DAC and DSI recorded as an increase or decrease to amortization of DAC and DSI on the consolidated statements of operations or AOCI.
Actual gross profits will depend on actual margins, including the changes in the value of embedded derivatives. The most sensitive assumption in determining the value of the embedded derivative is the vector of rates used to discount the embedded derivative cash flows. If the discount rates used to discount the embedded derivative cash flows were to change, there would be a resulting increase or decrease to the balances of DAC and DSI recorded as an increase or decrease in amortization of DAC and DSI on the consolidated statements of operations.
Following the business combination and application of purchase accounting described in note 3, DAC and DSI balances exhibit less sensitivity to hypothetical changes in estimated future gross profits and changes in the embedded derivative discount rate as they are relatively less material following the business combination. VOBA balances do not amortize based on estimated gross profits, and accordingly, are not sensitive to changes to actual or estimated gross profits.
106
Recent Accounting Pronouncements
A list of recent accounting pronouncements that are relevant to Apollo and its industries is included in note 2 to our consolidated financial statements.
Contractual Obligations, Commitments and Contingencies
Fixed and determinable payments due in connection with the Company’s material contractual obligations are as follows as of December 31, 2022:
| 2023 |
2024 - 2025
|
2026 - 2027
|
2028 and Thereafter | Total | |||||||||||||||||||||||||
| (In millions) | |||||||||||||||||||||||||||||
| Asset Management | |||||||||||||||||||||||||||||
Operating lease obligations1
|
$ | 70 | $ | 152 | $ | 147 | $ | 545 | $ | 914 | |||||||||||||||||||
Other long-term obligations2
|
14 | 1 | — | — | 15 | ||||||||||||||||||||||||
2022 AMH credit facility3
|
1 | 2 | 1 | — | 4 | ||||||||||||||||||||||||
Debt obligations3
|
136 | 723 | 662 | 2,482 | 4,003 | ||||||||||||||||||||||||
AOG Unit payment 4
|
175 | 175 | — | — | 350 | ||||||||||||||||||||||||
| 396 | 1,053 | 810 | 3,027 | 5,286 | |||||||||||||||||||||||||
| Retirement Services | |||||||||||||||||||||||||||||
| Interest sensitive contract liabilities | 20,431 | 40,875 | 33,971 | 78,376 | 173,653 | ||||||||||||||||||||||||
| Future policy benefits | 2,168 | 4,115 | 4,070 | 44,975 | 55,328 | ||||||||||||||||||||||||
| Other policy claims and benefits | 129 | — | — | — | 129 | ||||||||||||||||||||||||
| Dividends payable to policyholders | 5 | 9 | 9 | 73 | 96 | ||||||||||||||||||||||||
Debt3
|
153 | 306 | 306 | 4,592 | 5,357 | ||||||||||||||||||||||||
Securities to repurchase5
|
2,036 | 1,360 | 1,919 | — | 5,315 | ||||||||||||||||||||||||
| 24,922 | 46,665 | 40,275 | 128,016 | 239,878 | |||||||||||||||||||||||||
| Obligations | $ | 25,318 | $ | 47,718 | $ | 41,085 | $ | 131,043 | $ | 245,164 | |||||||||||||||||||
1 Operating lease obligations excludes $225 million of other operating expenses associated with operating leases.
| |||||||||||||||||||||||||||||
2 Includes (i) payments on management service agreements related to certain assets and (ii) payments with respect to certain consulting agreements entered into by the Company. Note that a significant portion of these costs are reimbursable by funds.
| |||||||||||||||||||||||||||||
3 The obligations for debt payments include contractual maturities of principal and estimated future interest payments based on the terms of the debt agreements. See note 13 of the consolidated financial statements for further discussion of these debt obligations.
| |||||||||||||||||||||||||||||
4 On December 31, 2021, each holder of AOG Units (other than those held by the Company and Athene) sold a portion of their limited partnership interests to the Company in exchange for the AOG Unit Payment. See note 17 to the consolidated financial statements for more information.
| |||||||||||||||||||||||||||||
5 The obligations for securities for repurchase payments include contractual maturities of principal and estimated future interest payments based on the terms of the agreements. Future interest payments on floating rate repurchase agreements were calculated using the December 31, 2022 interest rate.
| |||||||||||||||||||||||||||||
Note: Due to the fact that the timing of certain amounts to be paid cannot be determined or for other reasons discussed below, the following contractual commitments have not been presented in the table above.
(i)As noted previously, the tax receivable agreement requires us to pay to our Former Managing Partners and Contributing Partners 85% of any tax savings received by AGM and its subsidiaries from our step-up in tax basis. The tax savings achieved may not ensure that we have sufficient cash available to pay this liability and we might be required to incur additional debt to satisfy this liability.
(ii)Debt amounts related to the consolidated VIEs are not presented in the table above as the Company is not a guarantor of these non-recourse liabilities.
(iii)In connection with the Stone Tower acquisition, Apollo agreed to pay the former owners of Stone Tower a specified percentage of any future performance fees earned from certain of the Stone Tower funds, CLOs and strategic investment accounts. In connection with the acquisition of Griffin Capital’s U.S. asset management business on May 3, 2022, Apollo agreed to pay the former owners certain share-based consideration contingent on specified AUM and capital raising thresholds. These contingent consideration liabilities are remeasured to fair value at each reporting period until the obligations are satisfied. See note 18 to the consolidated financial statements for further information regarding the contingent consideration liabilities.
(iv)Commitments from certain of our subsidiaries to contribute to the funds we manage and certain related parties.
Atlas Securitized Products Holdings LP
On February 8, 2023, the Company and CS undertook the first close of their previously announced transaction whereby certain subsidiaries of Atlas acquired certain assets of the CS Securitized Products Group (the “Transaction”). A subsequent closing was held on February 23, 2023. Under the terms of the Transaction, Atlas has agreed to pay CS $3.3 billion, $0.4 billion of which is deferred until February 8, 2026, and $2.9 billion of which is deferred until February 8, 2028. This deferred purchase price is an obligation first of Atlas, second of AAA, third of AAM, fourth of AHL and fifth of AARe. Each of AARe and AHL has issued an assurance letter to CS for the full deferred purchase obligation amount of $3.3 billion. In exchange for the
107
purchase price, Atlas expects to receive, by the Transaction’s final close, approximately $0.4 billion in cash and a portfolio of senior secured warehouse assets, subject to debt, with approximately $1 billion of tangible equity value (to the extent that the warehouse assets received by Atlas constitute less than $1 billion of tangible equity value, the amount of cash is expected to increase by an offsetting amount). These warehouse assets are senior secured assets at industry standard loan-to-value ratios, structured to investment grade-equivalent criteria, and were approved by Atlas in connection with this Transaction. In addition, Atlas has received an investment management contract to manage certain unrelated assets on behalf of CS, providing for quarterly payments expected to total approximately $1.1 billion net to Atlas over 5 years. Finally, Atlas shall also benefit generally from the net spread earned on its assets in excess of its cost of financing. As a result, the fair value of the liability related to the Company’s assurance letter is not material to the consolidated financial statements.
ITEM 7A. QUANTITATIVE AND QUALITATIVE DISCLOSURES ABOUT MARKET RISK
Market risk is the risk of incurring losses due to adverse changes in market rates and prices. Included in market risk are potential losses in value due to credit and counterparty risk, interest rate risk, currency risk, commodity price risk, equity price risk and inflation risk.
In our asset management business, our predominant exposure to market risk is related to our role as investment manager and general partner for the funds we manage and the sensitivity to movements in the fair value of their investments and resulting impact on performance fees and management fee revenues. Our direct investments in the funds we manage also expose us to market risk whereby movements in the fair values of the underlying investments will increase or decrease both net gains (losses) from investment activities and income (loss) from equity method investments.
Our retirement services business is exposed to market risk through its investment portfolio, its counterparty exposures, and its hedging and reinsurance activities. Athene’s primary market risk exposures are to credit risk, interest rate risk, equity price risk, currency risk and inflation risk.
Risk Management Framework
The Company’s risk management frameworks are designed to identify, assess and prioritize risks to ensure that senior management understands and can manage our risk profile. Governance over risk exists at both the board level and management level for both the asset management and retirement services businesses. The audit committee of the board of directors of AGM is tasked with reviewing major financial risk exposures of the Company and management’s risk assessment and risk management policies.
Asset Management
In our asset management business, risks are analyzed across strategies from both a “bottom up” and “top down” perspective. We gather and analyze data, monitor investments and markets in detail, and constantly strive to better quantify, qualify and circumscribe relevant risks.
Each risk management process is subject to our overall risk tolerance and philosophy and our asset management enterprise risk management framework. This framework governs all business units within the asset management business and (1) conveys our risk culture; (2) outlines our risk management methodology; (3) identifies key roles and responsibilities, and (4) summarizes our core risk areas including, but not limited to, market, credit and operational risks.
Each fund runs its own investment and risk management process subject to our overall risk tolerance and philosophy:
•With respect to the yield and hybrid funds we manage, we continuously monitor a variety of markets for attractive trading opportunities, applying a number of traditional and customized risk management metrics to analyze risk related to specific assets or portfolios, as well as, fund-wide risks.
•The investment process of the equity funds, we manage involves a detailed analysis of potential acquisitions, and investment management teams assigned to monitor the strategic development, financing and capital deployment decisions of each portfolio investment.
The Apollo Global Risk Committee (“AGRC”) is tasked with assisting AAM in monitoring and managing enterprise risk for the asset management business. The AGRC is chaired by a Co-President of AAM and includes other members of senior
108
management of Apollo’s asset management business. Managing risk is the responsibility of all AAM employees. Businesses and investment professionals are responsible for all the risk taken on and managed in their business areas and risk management groups are accountable for providing an objective challenge to, and oversight of, the business’ risk management.
Risk management groups, such as the market risk group and credit risk team, of the Company’s asset management business provide summary analysis of fund level market and credit risk to the portfolio managers of the funds managed by Apollo and the heads of the various business units. On a periodic basis, risk owners also provide analyses of select market and credit risk components to various members of senior management. In addition, the business and risk leaders of the Company’s asset management business review specific investments from the perspective of risk mitigation and discusses such analysis with the AGRC or other members of senior management when needed.
Retirement Services
The processes supporting risk management for our retirement services business are designed to ensure that Athene’s risk profile is consistent with its stated risk appetite and that it maintains sufficient capital and liquidity to support its corporate plan, while meeting the requirements imposed by its policyholders, regulators and other stakeholders. The risk management function at Athene strives to maximize the value of its existing business platform to the Company’s shareholders, preserve the ability to realize business and market opportunities under stressed market conditions, and to withstand the impact of severely adverse events.
AHL’s risk management framework includes a governance committee structure that supports accountability in current risk-based decision making and effective risk management. Governance committees are established at three levels: the AHL board of directors, AHL management, and subsidiary management. AHL utilizes a host of assessment tools to monitor and assess its risk profile, results of which are shared with senior management periodically at management level committees, such as the management risk committee (“MRC”) and the management investment and asset liability committee (“MIALC”), and with the AHL board of directors quarterly. Business management retains the primary responsibility for day-to-day management of risk.
The risk management team at Athene consists of eight teams: Business and Operational Risk, ALM, Regulatory and Risk Analytics, Derivative Governance & Risk Policy, Derivatives and Structured Solutions, Asset Risk Management, Strategic & Emerging Risk and Risk Operations & Change Management. The risk management team is led by AHL’s Chief Risk Officer, who reports to the chair of the AHL Risk Committee. AHL’s risk management team is comprised of more than 50 dedicated, full-time employees.
Asset and Liability Management
Asset and liability risk management is a joint effort that spans business management and the entire risk management team. Processes established to analyze and manage the risks of Athene’s assets and liabilities include but are not limited to:
•analyzing AHL’s liabilities to ascertain their sensitivity to behavioral variations and changes in market conditions and actuarial assumptions;
•analyzing interest rate risk, cash flow mismatch, and liquidity risk;
•performing scenario and stress analyses to examine their impacts on capital and earnings;
•performing cash flow testing and capital modeling;
•modeling the values of the derivatives embedded in its policy liabilities so that they can be effectively hedged;
•hedging unwanted risks, including from embedded derivatives, interest rate exposures and currency risks;
•reviewing its corporate plan and strategic objectives, and identifying prospective risks to those objectives under normal and stressed economic, behavioral and actuarial conditions; and
•providing appropriate risk reports that show consolidated risk exposures from assets and liabilities as well as the economic consequences of stress events and scenarios.
Market Risk and Management of Market Risk Exposures
Asset Management
Impact on Management Fees
Our management fees are based on one of the following:
109
•capital commitments to an Apollo fund;
•capital invested in an Apollo fund;
•the gross, net or adjusted asset value of an Apollo fund, as defined; or
•as otherwise defined in the respective agreements.
Management fees could be impacted by changes in market risk factors, including (i) changes in invested capital or in market values to below cost, due to which management could consider an investment permanently impaired, in the case of certain funds or (ii) changes in gross or net asset value, for the yield funds. The proportion of our management fees that are based on NAV is dependent on the number and types of funds in existence and the current stage of each fund’s life cycle.
Impact on Advisory and Transaction Fees—We earn transaction fees relating to certain yield, hybrid and equity transactions and may obtain reimbursement for certain out-of-pocket expenses incurred. Subsequently, on a quarterly or annual basis, ongoing advisory fees, and additional transaction fees in connection with additional purchases, dispositions, or follow-on transactions, may be earned. Management Fee Offsets and any broken deal costs, if applicable, are reflected as a reduction to advisory and transaction fees. Advisory and transaction fees will be impacted by changes in market risk factors to the extent that they limit our opportunities to engage in yield, hybrid, and equity transactions or impair our ability to consummate such transactions. The impact of changes in market risk factors on advisory and transaction fees is not readily predicted or estimated.
Impact on Performance Fees
We earn performance fees from the funds we manage as a result of such funds achieving specified performance criteria. Our performance fees will be impacted by changes in market risk factors. However, several major factors will influence the degree of impact:
•the performance criteria for each individual fund in relation to how that fund’s results of operations are impacted by changes in market risk factors;
•whether such performance criteria are annual or over the life of the fund;
•to the extent applicable, the previous performance of each fund in relation to its performance criteria; and
•whether each fund’s performance fee distributions are subject to contingent repayment.
As a result, the impact of changes in market risk factors on performance fees will vary widely from fund to fund. The impact is heavily dependent on the prior and future performance of each fund, and therefore is not readily predicted or estimated.
Market Risk
We are directly and indirectly affected by changes in market conditions. Market risk generally represents the risk that values of investments will be adversely affected by changes in market conditions. Market risk is inherent in each of the investments of the funds we manage, including equity investments, loans, short-term borrowings, long-term debt, hedging instruments, credit default swaps and derivatives. Just a few of the market conditions that may shift from time to time, thereby exposing us to market risk, include fluctuations in interest, currency exchange rates and credit spreads, equity prices, changes in the implied volatility of interest rates and price deterioration. Volatility in debt and equity markets can impact our pace of capital deployment, the timing of receipt of transaction fee revenues and the timing of realizations. These market conditions could have an impact on the value of fund investments and rates of return. Accordingly, depending on the instruments or activities impacted, market risks can have wide ranging, complex adverse effects on our results from operations and our overall financial condition. We monitor market risk using certain strategies and methodologies which management evaluates periodically for appropriateness. We intend to continue to monitor this risk going forward and continue to monitor our exposure to all market factors.
The Company is subject to a concentration risk related to the investors in the funds it manages. There are more than 1,000 investors in Apollo’s active yield, hybrid, and equity funds, and no individual investor accounts for more than 10% of the total committed capital to Apollo’s active funds.
Interest Rate Risk
Interest rate risk represents exposure we and the funds we manage have to instruments whose values vary with the change in interest rates. These instruments include, but are not limited to, loans, borrowings, investments in interest bearing securities and
110
derivative instruments. We may seek to mitigate risks associated with the exposures by having the funds take offsetting positions in derivative contracts. Hedging instruments allow us to seek to mitigate risks by reducing the effect of movements in the level of interest rates, changes in the shape of the yield curve, as well as, changes in interest rate volatility. Hedging instruments used to mitigate these risks may include related derivatives such as options, futures and swaps.
Credit Risk
Credit risk represents exposure we and the funds we manage have to investments or other activity whose value varies with the change in credit spreads, the change in the probability of default by the borrow or the actual default and failure to repay a loan or contractual obligation. Certain of the funds we manage are subject to certain inherent risks through their investments.
Certain entities we manage invest substantially all of their excess cash in open-end money market funds and money market demand accounts, which are included in cash and cash equivalents. The money market funds invest primarily in government securities and other short-term, highly liquid instruments with a low risk of loss. We continually monitor the funds’ performance in order to manage any risk associated with these investments.
Certain funds we manage hold derivative instruments that contain an element of risk in the event that the counterparties may be unable to meet the terms of such agreements. We seek to minimize risk exposure by limiting the counterparties with which the funds enter into contracts to banks and investment banks who meet established credit and capital guidelines. Counterparty risk may be further mitigated by the exchange of collateral with a counterparty as a form of credit support for derivative transactions. As of December 31, 2022, we do not expect any counterparty to default on its obligations and therefore do not expect to incur any loss due to counterparty default.
Certain investments of the funds we manage include lower-rated and comparable quality unrated distressed investments and other instruments. Investments in such debt instruments are accompanied by a greater degree of risk of loss due to default by the issuer because such debt instruments are generally unsecured and subordinated to other creditors of the issuer. These issuers generally have high levels of indebtedness and can be more sensitive to adverse market conditions, such as a recession or increasing interest rates, as compared to higher rated issuers. We seek to minimize risk exposure by subjecting each prospective investment to rigorous credit analysis and by making investment decisions based upon objectives that include capital preservation and appreciation, and industry and issuer diversification.
Foreign Exchange Risk
Foreign exchange risk represents exposures the funds we manage have to changes in the values of current fund holdings and future cash flows denominated in other currencies and investments in non-U.S. companies. The types of investments exposed to this risk include investments in foreign subsidiaries, foreign currency-denominated loans, foreign currency-denominated transactions, and various foreign exchange derivative instruments whose values fluctuate with changes in currency exchange rates or foreign interest rates. Instruments used to mitigate this risk are foreign exchange options, currency swaps, futures and forwards. These instruments may be used to help insulate the funds we manage against losses that may arise due to volatile movements in foreign exchange rates and/or interest rates.
In our capacity as investment manager of the funds we manage, we continuously monitor a variety of markets for attractive opportunities for managing risk. For example, certain of the funds we manage may put in place foreign exchange hedges or borrowings with respect to certain foreign currency denominated investments to provide a hedge against foreign exchange exposure.
Non-U.S. Operations
We have offices and conduct business throughout the world and are continuing to expand into foreign markets. Our fund investments and our revenues are primarily derived from our U.S. operations. With respect to our non-U.S. operations, we are subject to risk of loss from currency fluctuations, social instability, changes in governmental policies or policies of central banks, expropriation, nationalization, unfavorable political and diplomatic developments and changes in legislation relating to non-U.S. ownership. The funds we manage also invest in the securities of companies which are located in non-U.S. jurisdictions. As we continue to expand globally, we will continue to focus on monitoring and managing these risk factors as they relate to specific non-U.S. investments.
111
Retirement Services
Credit Risk and Counterparty Risk
To operate Athene’s business model, which is based on generating spread related earnings, it must bear credit risk. However, as Athene assumes credit risk through its investment, reinsurance and hedging activities, it endeavors to ensure that risk exposures remain diversified, that it is adequately compensated for the risks it assumes and that the level of risk is consistent with its risk appetite and objectives.
Credit risk is a key risk taken in the asset portfolio, as the credit spread on Athene’s investments is what drives its spread related earnings. Athene manages credit risk by avoiding idiosyncratic risk concentrations, understanding and managing its systematic exposure to economic and market conditions through stress testing, monitoring investment activity daily and distinguishing between price and default risk from credit exposures. Concentration and portfolio limits are designed to ensure that exposure to default and impairment risk is sufficiently modest to not represent a solvency risk, even in severe economic conditions.
The approach to taking credit risk in our retirement services business is formulated based on:
•a fundamental view on existing and potential opportunities at the security level;
•an assessment of the current risk/reward proposition for each market segment;
•identification of downside risks and assigning a probability for those risks; and
•establishing a plan for best execution of the investment action.
A dedicated set of AHL risk managers monitor the asset risks to ensure that such risks are consistent with Athene’s risk appetite, standards for committing capital, and overall strategic objectives. Athene’s risk management team is also a key contributor to the credit impairment evaluation process.
In addition to credit-risk exposures from its investment portfolio, Athene is also exposed to credit risk from its counterparty exposures from its derivative hedging and reinsurance activities. Derivative counterparty risk is managed by trading on a collateralized basis with counterparties under International Swaps and Derivatives Association documents with a credit support annex having low or zero-dollar collateral thresholds.
Athene utilizes reinsurance to mitigate risks that are inconsistent with its strategy or objectives. For example, Athene has reinsured much of the mortality risk it would otherwise have accumulated through its various acquisitions, allowing it to focus on its core annuity business. These reinsurance agreements expose Athene to the credit risk of its counterparties. Athene manages this risk to avoid counterparty risk concentrations through various mechanisms: utilization of reinsurance structures such as funds withheld or modco to retain ownership of the assets and limit counterparty risk to the cost of replacing the counterparty; diversification across counterparties; and when possible, novating policies to eliminate counterparty risk altogether.
Interest Rate Risk—Significant interest rate risk may arise from mismatches in the timing of cash flows from Athene’s assets and liabilities. Management of interest rate risk at the company-wide level, and at the various operating company levels, is one of the main risk management activities in which AHL senior management engages.
Depending upon the materiality of the risk and an assessment of how Athene would perform across a spectrum of interest rate environments, it may seek to mitigate interest rate risk using on-balance-sheet strategies (portfolio management) or off-balance-sheet strategies (derivative hedges such as interest rate swaps and futures). Athene monitors ALM metrics (such as key-rate durations and convexity) and employs quarterly cash flow testing requirements across all of its insurance companies to assure the asset and liability portfolios are managed to maintain net interest rate exposures at levels that are consistent with its risk appetite. Athene has established a set of exposure and stress limits to communicate its risk tolerance and to ensure adherence to those risk tolerance levels. Risk management personnel and the MRC and/or MIALC (together, management committees) are notified in the event that risk tolerance levels are exceeded. Depending on the specific risk threshold that is exceeded, the appropriate management committee then makes a decision as to what actions, if any, should be undertaken.
Active portfolio management is performed by our asset management business, with direction from the management committees. ALM risk is also managed by the management committees. The performance of Athene’s investment portfolio is reviewed periodically by the AHL management committees and board of directors. The management committees strive to improve returns to shareholders and protect policyholders, while dynamically managing the risk within Athene’s expectations.
112
Equity Risk—Athene’s FIAs require it to make payments to policyholders that are dependent on the performance of equity market indices. Athene seeks to minimize the equity risk from its liabilities by economically defeasing this equity exposure with granular, policy-level-based hedging. In addition, Athene’s investment portfolio can be invested in strategies involving public and private equity positions, though in general, it has limited appetite for passive, public equity investments.
The equity index hedging framework implemented is one of static and dynamic replication. Unique policy-level liability options are matched with static OTC options and residual risk arising from policyholder behavior and other trading constraints (for example minimum trade size) are managed dynamically by decomposing the risk of the portfolio (asset and liability positions) into market risk measures which are managed to pre-established risk limits. The portfolio risks are measured overnight and rebalanced daily to ensure that the risk profile remains within risk appetite. Valuation is done at the position level, and risks are aggregated and shown at the level of each underlying index. Risk measures that have term structure sensitivity, such as index volatility risk and interest rate risk, are monitored and risk managed along the term structure.
Athene is also exposed to equity risk in its alternative investment portfolio. The form of those investments is typically a limited partnership interest in a fund. Athene currently targets fund investments that have characteristics resembling fixed income investments versus those resembling pure equity investments, but as holders of partnership positions, Athene’s investments are generally held as equity positions. Alternative investments are comprised of several categories, including at the most liquid end of the spectrum “liquid strategies”, (which is mostly exposure to publicly traded equities), followed by “differentiated investments”, “yield”, “equity” and “hybrid” strategies. Athene’s alternatives portfolio also includes strategic equity investments in origination platforms, insurance platforms and others.
Athene’s investment mandate in its alternative investment portfolio is inherently opportunistic. Each investment is examined and analyzed on its own merits to gain a full understanding of the risks present, and with a view toward determining likely return scenarios, including the ability to withstand stress in a downturn. Athene has a strong preference for alternative investments that have some or all of the following characteristics, among others: (1) investments that constitute a direct investment or an investment in a fund with a high degree of co-investment; (2) investments with credit- or debt-like characteristics (for example, a stipulated maturity and par value), or alternatively, investments with reduced volatility when compared to pure equity; or (3) investments that Athene believes have less downside risk.
The alternative investment portfolio is monitored to ensure diversification across asset classes and strategy, and the portfolio's performance under stress scenarios is evaluated routinely as part of management and board reviews. Since alternative investments are marked-to-market on the balance sheet, risk analyses focus on potential changes in market value across a variety of market stresses.
Currency Risk—Athene manages its currency risk to maintain minimal exposure to currency fluctuations. It attempts to hedge completely the currency risk arising in its investment portfolio, funding agreements or indexed annuity liabilities. In general, Athene matches currency exposure of assets and liabilities. When the currency denominations of the assets and liabilities do not match, Athene generally undertakes hedging activities to eliminate or mitigate currency mismatch risk.
Inflation Risk—Athene manages its inflation risk to maintain minimal exposure to changes in purchasing power. In general, it attempts to match inflation exposure of assets and liabilities. When the inflation exposure profiles of assets and liabilities do not match, Athene generally undertakes hedging activities to eliminate or mitigate inflation mismatch risk. Athene attempts to hedge the majority of inflation risk arising from the pension group annuity business that it reinsures.
Scenario Analysis— Athene evaluates exposure to credit risk by analyzing its portfolio’s performance during simulated periods of economic stress. Athene manages business, capital and liquidity needs to withstand stress scenarios and target capital it believes will maintain its current ratings in a moderate recession scenario and maintain investment grade ratings under a deep recession scenario, a substantially severe financial crisis akin to the Lehman scenario in 2008. In the recession scenario, Athene calibrates recessionary shocks to several key risk factors (including but not limited to default rates, recoveries, credit spreads and U.S. Treasury yields) using data from the 1991, 2001, and 2008 recessions, and estimate impacts to the various sectors in its portfolio. In the deep recession scenario, Athene uses default probabilities from the 2008-2009 period, along with recovery and ratings migration rates, to estimate impairment impacts, and uses credit spread and interest rate movements from the 2008–2009 period to estimate mark to market changes. Management reviews the impacts of its stress test analyses on a quarterly basis.
113
Sensitivities
Asset Management
Interest Rate Risk
We are primarily subject to interest rate risk through the investments of the funds we manage. For funds that pay management fees based on NAV or other bases that are sensitive to market value fluctuations, we anticipate our management fees would change consistent with the increase or decrease experienced by the underlying funds’ portfolios. In the event that interest rates were to increase by one percentage point, we estimate that management fees earned that were dependent upon estimated fair value would decrease by approximately $9 million and $41 million during the years ended December 31, 2022 and 2021, respectively.
Credit Risk
Similar to interest rate risk, we are also subject to credit risk through the investments of the funds we manage. In the event that credit spreads were to increase by one percentage point, we estimate that management fees earned that were dependent upon estimated fair value would decrease by approximately $18 million and $51 million during the years ended December 31, 2022 and 2021, respectively.
Foreign Exchange Risk
We estimate for the years ended December 31, 2022 and 2021, a 10% decline in the rate of exchange of all foreign currencies against the U.S. dollar would result in the following declines in management fees and investment income (loss):
Years ended December 31, |
|||||||||||
| (In millions) | 2022 | 2021 | |||||||||
| Management fees | $ | 21 | $ | 20 | |||||||
| Investment income (loss) | 9 | 19 | |||||||||
Net Gains from Investment Activities and Principal Investment Income
Our assets and unrealized gains, and our related equity and net income are sensitive to changes in the valuations of the underlying investments of the funds we manage and could vary materially as a result of changes in our valuation assumptions and estimates. See “Item 7. Management’s Discussion and Analysis of Financial Conditions and Results of Operations—Critical Accounting Policies—Investments, at Fair Value” for details related to the valuation methods that are used and the key assumptions and estimates employed by such methods. We also quantify the Level 3 investments that are included on our consolidated statements of financial condition by valuation methodology in note 7 to the consolidated financial statements. We employ a variety of valuation methods. Furthermore, the investments that we manage but are not on our consolidated statements of financial condition, and therefore impact performance fees, also employ a variety of valuation methods of which no single methodology is used more than any other.
Management Fees
Management fees are primarily based on the net asset value of the relevant fund, gross assets, adjusted equity, capital commitments, invested capital, or as defined in the respective fund’s management agreements. Changes in the fair values of the investments that earn management fees based on net asset value, gross assets or adjusted equity will have a direct impact on the amount of management fees that are earned. Management fees earned that were dependent upon estimated fair value during the years ended December 31, 2022 and 2021 would decrease by approximately $51 million and $112 million, respectively, if the fair values of the investments held by such funds were 10% lower during the same respective periods.
Management fees for equity and certain hybrid funds we manage are generally charged on either (a) a fixed percentage of committed capital over a stated investment period or (b) a fixed percentage of invested capital of unrealized portfolio investments. Changes in values of investments could indirectly affect future management fees from such funds by, among other things, reducing the funds’ access to capital or liquidity and their ability to currently pay the management fees or if such change resulted in a write-down of investments below their associated invested capital.
114
Investment Income (Loss)
Performance Fees—Performance fees from the funds we manage generally are earned based on achieving specified performance criteria and is impacted directly by changes in the fair value of the funds’ investments. We anticipate that a 10% decline in the fair values of investments held by all of the funds we manage would decrease performance fees by approximately $1.1 billion at both December 31, 2022 and 2021.
Principal Investment Income—For select funds managed by Apollo, our share of income from equity method investments as a general partner in such funds is derived from unrealized gains or losses on investments in funds included in the consolidated financial statements. For funds in which we have an interest, but are not consolidated, our share of investment income is limited to our direct investments in the funds.
We anticipate that a 10% decline in the fair value of investments at December 31, 2022 and 2021 would result in an approximate $235 million and $203 million decrease in principal investment income in our consolidated financial statements, respectively.
Retirement Services
Interest Rate Risk
Athene assesses interest rate exposure for financial assets and liabilities using hypothetical stress tests and exposure analyses. Assuming all other factors are constant, if there was an immediate parallel increase in interest rates of 25 basis points from levels as of December 31, 2022, Athene estimates a net decrease to its point-in-time pre-tax income from changes in the fair value of these financial instruments of $707 million. The net change in fair value for these financial instruments would directly impact the current period gross profits and assessments used in the calculations of DAC and DSI amortization and changes to rider reserves, resulting in an offsetting increase to Athene’s pre-tax income of $23 million. If there was a similar parallel increase in interest rates from levels as of December 31, 2021, Athene estimates a net decrease to its point-in-time pre-tax income from changes in the fair value of these financial instruments of $511 million with an offsetting increase to pre-tax income of $17 million from DAC, DSI and VOBA amortization and changes in rider reserves. The increase in sensitivity to point-in-time pre-tax income from changes in the fair value of financial instruments in the estimated outcome as of December 31, 2022, when compared to December 31, 2021, was primarily due to the election of the fair value accounting option for Athene’s mortgage loan portfolio. The financial instruments included in the sensitivity analysis are carried at fair value and changes in fair value are recognized in earnings. These financial instruments include derivative instruments, embedded derivatives and certain fixed maturity securities. The sensitivity analysis excludes those financial instruments carried at fair value for which changes in fair value are recognized in equity, such as AFS fixed maturity securities.
Assuming a 25 basis point increase in interest rates that persists for a 12-month period, the estimated impact to spread related earnings would be an increase of approximately $30 – $40 million, and a 25 basis point decrease would generally result in a similar decrease. This is driven by a change in investment income from floating rate assets and liabilities, offset by DAC and DSI amortization and rider reserve change, all calculated without regard to future changes to assumptions. Athene is unable to make forward-looking estimates regarding the impact on net income (loss) of changes in interest rates that persist for a period of time as a result of an inability to determine how such changes will affect certain of the items that Athene characterizes as “adjustments to income (loss) before income taxes” in its reconciliation between net income (loss) available to AHL common shareholder and spread related earnings. See “Item 7. Management’s Discussion and Analysis of Financial Condition and Results of Operations—Summary of Non-U.S. GAAP Measures” for the reconciliation of net income (loss) attributable to AGM common stockholders to adjusted net income, of which spread related earnings is a component. The impact of changing rates on these adjustments is likely to be significant. See above for a discussion regarding the estimated impact on net income (loss) of an immediate, parallel increase in interest rates of 25 basis points from levels as of December 31, 2022, which discussion encompasses the impact of such an increase on certain of the adjustment items.
The models used to estimate the impact of a 25 basis point change in market interest rates incorporate numerous assumptions, require significant estimates and assume an immediate change in interest rates without any discretionary management action to counteract such a change. Consequently, potential changes in Athene’s valuations indicated by these simulations will likely be different from the actual changes experienced under any given interest rate scenarios and these differences may be material. Because Athene actively manages its assets and liabilities, the net exposure to interest rates can vary over time. However, any such decreases in the fair value of fixed maturity securities, unless related to credit concerns of the issuer requiring recognition
115
of credit losses, would generally be realized only if Athene were required to sell such securities at losses to meet liquidity needs.
Public Equity Risk
Athene assesses public equity market risk for financial assets and liabilities using hypothetical stress tests and exposure analyses. Assuming all other factors are constant, if there was a decline in public equity market prices of 10% as of December 31, 2022, Athene estimates a net decrease to its pre-tax income from changes in the fair value of these financial instruments of $269 million. The net change in fair value for these financial instruments would directly impact the current period gross profits and assessments used in the calculations of DAC and DSI amortization and changes in rider reserves, resulting in an offsetting increase to its pre-tax income of $20 million. As of December 31, 2021, Athene estimates that a decline in public equity market prices of 10% would cause a net decrease to its pre-tax income from changes in the fair value of these financial instruments of $392 million with an offsetting increase to its pre-tax income of $131 million from DAC, DSI and VOBA amortization and changes in rider reserves. The decline in the DAC, DSI and VOBA amortization as of December 31, 2022, when compared to that as of December 31, 2021, is driven by the decline in the market value of the equity options. The financial instruments included in the sensitivity analysis are carried at fair value and changes in fair value are recognized in earnings. These financial instruments include public equity investments, derivative instruments and the FIA embedded derivative.
116
ITEM 8. FINANCIAL STATEMENTS AND SUPPLEMENTARY DATA
Index to Consolidated Financial Statements
Report of Independent Registered Public Accounting Firm (PCAOB ID No. |
|||||||||||
117
REPORT OF INDEPENDENT REGISTERED PUBLIC ACCOUNTING FIRM
To the Stockholders and the Board of Directors of Apollo Global Management, Inc.
Opinions on the Financial Statements and Internal Control over Financial Reporting
We have audited the accompanying consolidated statements of financial condition of Apollo Global Management, Inc. and subsidiaries (the "Company") as of December 31, 2022 and 2021, the related consolidated statements of operations, comprehensive income (loss), stockholders' equity, and cash flows, for each of the three years in the period ended December 31, 2022, and the related notes and the schedule listed in the Index at Item 15 (collectively referred to as the "financial statements"). We also have audited the Company’s internal control over financial reporting as of December 31, 2022, based on criteria established in Internal Control — Integrated Framework (2013) issued by the Committee of Sponsoring Organizations of the Treadway Commission (COSO).
In our opinion, the financial statements referred to above present fairly, in all material respects, the financial position of the Company as of December 31, 2022 and 2021, and the results of its operations and its cash flows for each of the three years in the period ended December 31, 2022, in conformity with accounting principles generally accepted in the United States of America. Also, in our opinion, the Company maintained, in all material respects, effective internal control over financial reporting as of December 31, 2022, based on criteria established in Internal Control — Integrated Framework (2013) issued by COSO.
Basis for Opinions
The Company’s management is responsible for these financial statements, for maintaining effective internal control over financial reporting, and for its assessment of the effectiveness of internal control over financial reporting, included in the accompanying Management’s Report on Internal Control over Financial Reporting. Our responsibility is to express an opinion on these financial statements and an opinion on the Company’s internal control over financial reporting based on our audits. We are a public accounting firm registered with the Public Company Accounting Oversight Board (United States) (PCAOB) and are required to be independent with respect to the Company in accordance with the U.S. federal securities laws and the applicable rules and regulations of the Securities and Exchange Commission and the PCAOB.
We conducted our audits in accordance with the standards of the PCAOB. Those standards require that we plan and perform the audits to obtain reasonable assurance about whether the financial statements are free of material misstatement, whether due to error or fraud, and whether effective internal control over financial reporting was maintained in all material respects.
Our audits of the financial statements included performing procedures to assess the risks of material misstatement of the financial statements, whether due to error or fraud, and performing procedures to respond to those risks. Such procedures included examining, on a test basis, evidence regarding the amounts and disclosures in the financial statements. Our audits also included evaluating the accounting principles used and significant estimates made by management, as well as evaluating the overall presentation of the financial statements. Our audit of internal control over financial reporting included obtaining an understanding of internal control over financial reporting, assessing the risk that a material weakness exists, and testing and evaluating the design and operating effectiveness of internal control based on the assessed risk. Our audits also included performing such other procedures as we considered necessary in the circumstances. We believe that our audits provide a reasonable basis for our opinions.
Definition and Limitations of Internal Control over Financial Reporting
A company’s internal control over financial reporting is a process designed to provide reasonable assurance regarding the reliability of financial reporting and the preparation of financial statements for external purposes in accordance with generally accepted accounting principles. A company’s internal control over financial reporting includes those policies and procedures that (1) pertain to the maintenance of records that, in reasonable detail, accurately and fairly reflect the transactions and dispositions of the assets of the company; (2) provide reasonable assurance that transactions are recorded as necessary to permit preparation of financial statements in accordance with generally accepted accounting principles, and that receipts and expenditures of the company are being made only in accordance with authorizations of management and directors of the company; and (3) provide reasonable assurance regarding prevention or timely detection of unauthorized acquisition, use, or disposition of the company’s assets that could have a material effect on the financial statements.
118
Because of its inherent limitations, internal control over financial reporting may not prevent or detect misstatements. Also, projections of any evaluation of effectiveness to future periods are subject to the risk that controls may become inadequate because of changes in conditions, or that the degree of compliance with the policies or procedures may deteriorate.
Critical Audit Matters
The critical audit matters communicated below are matters arising from the current-period audit of the financial statements that were communicated or required to be communicated to the audit committee and that (1) relate to accounts or disclosures that are material to the financial statements and (2) involved our especially challenging, subjective, or complex judgments. The communication of critical audit matters does not alter in any way our opinion on the financial statements, taken as a whole, and we are not, by communicating the critical audit matters below, providing a separate opinion on the critical audit matters or on the accounts or disclosures to which they relate.
Performance Allocations— Refer to Note 2, Summary of Significant Accounting Policies
Critical Audit Matter Description
The Company, through its asset management business, recognizes performance allocations from the funds it manages within investment income to the extent these funds meet or achieve certain performance criteria. The Company recognizes performance allocations each reporting period based on the terms outlined in the respective fund governing agreements. Further, the fair value of the underlying investments held by the funds is a significant input to the evaluation and recognition of performance allocations.
Certain funds may hold significant illiquid investments whose fair values are based on unobservable inputs. These investments have limited observable market activity and changes in the fair value of these investments directly impact the amount of performance allocations the Company is entitled to recognize as investment income for the period.
Auditing the performance allocation calculations involves critical evaluation of the appropriate legal interpretation and application of the terms of the respective fund governing agreements, inclusive of any contingent repayment provisions. Auditing the fair value of illiquid investments, which are based on unobservable inputs, involves especially subjective auditor judgment and the subject matter expertise of our fair value specialists to evaluate the appropriateness of the valuation methods, assumptions, and unobservable inputs used by the Company to determine fair value.
How the Critical Audit Matter Was Addressed in the Audit
Our audit procedures related to the funds’ performance allocation calculations and the testing of fair value of illiquid investments held by the funds included the following, among others:
•We involved senior, more experienced audit team members in the performance of our audit procedures.
•We tested the design and operating effectiveness of controls over management’s performance allocation calculations and the determination of the fair value of illiquid investments.
•We evaluated, on a sample basis, whether the Company’s performance allocation calculations were performed in accordance with the terms of the funds’ governing agreements.
•We utilized our fair value specialists to assist in our evaluation of the valuation methods, assumptions and unobservable inputs used by the Company to determine the fair value of certain illiquid investments held by the funds.
•We evaluated the Company’s historical ability to accurately estimate the fair value of illiquid investments by comparing previous estimates of fair value to market transactions with third parties.
Valuation of Certain Structured Level 3 Asset-Backed Securities - Refer to Note 4, Investments, Note 7, Fair Value, and Note 17, Related Parties
Critical Audit Matter Description
Investments in certain structured Level 3 asset-backed securities held by the Company, through its retirement services business, are reported at fair value in the consolidated financial statements. These investments without readily determinable market values, are valued using significant unobservable inputs that involve considerable judgment by management. The Company uses internal modeling techniques based on projected cash flows and certain other unobservable inputs to value its structured
119
Level 3 asset-backed securities. The significant unobservable inputs may include discount rates, issue specific credit adjustments, material non-public financial information, estimation of future earnings and cash flows, default rate assumptions, and liquidity assumptions.
Given that the Company utilizes valuation models and significant unobservable inputs to estimate the fair value for certain of its structured Level 3 asset-backed securities, performing audit procedures to evaluate these inputs requires a high degree of auditor judgment and an increased extent of effort, including the involvement of our fair value specialists.
How the Critical Audit Matter Was Addressed in the Audit
Our audit procedures related to the valuation models and significant unobservable inputs utilized by the Company to estimate the fair value of investments in certain structured Level 3 asset-backed securities included the following, among others:
•We involved senior, more experienced audit team members in the performance of our audit procedures.
•We tested the design and operating effectiveness of controls over management’s determination of the fair value of these securities.
•With the assistance of our fair value specialists, we:
–Evaluated the valuation models and unobservable inputs used by the Company to estimate fair value for a sample of these securities.
–Developed independent fair value estimates and compared our estimates to the Company’s estimates for a sample of these securities.
•On a sample basis, we evaluated the Company’s historical ability to accurately estimate the fair value of these securities by comparing previous estimates of fair value to market transactions with third parties adjusted for changes in market conditions.
Certain Assumptions Used in the Valuation of Value of Business Acquired (VOBA), Future Policy Benefits, and Interest Sensitive Contract Liabilities - Refer to Note 2 , Summary of Significant Accounting Policies, Note 7, Fair Value, and Note 9, Deferred Acquisition Costs, Deferred Sales Inducements and Value of Business Acquired
Critical Audit Matter Description
On January 1, 2022, the Company completed its merger with Athene Holding Ltd. (“Athene”) and allocated the consideration to the fair value of Athene’s assets and liabilities at the time of the merger. In conjunction with the merger and in subsequent period evaluations, the Company determined estimated valuations of VOBA, negative VOBA, Future Policy Benefits and Interest Sensitive Contract Liabilities, which include embedded derivatives. The Company’s valuations are based on actuarial methodologies and include significant unobservable inputs associated with underlying economic and future policyholder behavior assumptions.
Significant judgment is applied by the Company in determining these assumptions. Specifically, the future policyholder behavior assumptions related to lapses and the use of benefit riders, as well as the assumptions for the future equity option costs or option budget and risk margin involve significant unobservable inputs and may materially impact the estimated valuation of VOBA, negative VOBA, Future Policy Benefits and Interest Sensitive Contract Liabilities, which include embedded derivatives.
Given the significant judgement involved with determining these economic and policyholder behavior assumptions, auditing these estimates requires a high degree of auditor judgment and an increased extent of effort, including the involvement of our fair value and actuarial specialists.
How the Critical Audit Matter Was Addressed in the Audit
Our audit procedures related to these economic and policyholder behavior assumptions determined by the Company included the following, among others:
•We involved senior, more experienced audit team members, including fair value and actuarial specialists, to plan and perform audit procedures.
120
•We tested the effectiveness of controls over management’s development of these assumptions, including those controls over the underlying data.
•With the assistance of our fair value and actuarial specialists, we:
–Evaluated the methods, models, and judgements applied by the Company in determining these assumptions, including evaluating the results of experience studies or other data used as a basis for setting those assumptions.
–Evaluated the reasonableness of the Company’s assumptions by comparing those selected by management to those independently developed by our fair value and actuarial specialists, drawing upon standard actuarial and industry practices.
/s/ Deloitte & Touche LLP
February 28, 2023
We have served as the Company's auditor since 2007.
121
| (In millions, except share data) | As of December 31, 2022 |
As of December 31, 2021 |
|||||||||
| Assets | |||||||||||
| Asset Management | |||||||||||
| Cash and cash equivalents | $ | $ | |||||||||
| Restricted cash and cash equivalents | |||||||||||
| Investments | |||||||||||
| Assets of consolidated variable interest entities | |||||||||||
| Cash and cash equivalents | |||||||||||
| Investments | |||||||||||
| Other assets | |||||||||||
| Due from related parties | |||||||||||
| Goodwill | |||||||||||
| Other assets | |||||||||||
| Retirement Services | |||||||||||
| Cash and cash equivalents | |||||||||||
| Restricted cash and cash equivalents | |||||||||||
| Investments | |||||||||||
| Investments in related parties | |||||||||||
| Assets of consolidated variable interest entities | |||||||||||
| Cash and cash equivalents | |||||||||||
| Investments | |||||||||||
| Other assets | |||||||||||
| Reinsurance recoverable | |||||||||||
| Deferred acquisition costs, deferred sales inducements and value of business acquired | |||||||||||
| Goodwill | |||||||||||
| Other assets | |||||||||||
| Total Assets | $ |
|
$ |
|
|||||||
| (Continued) | |||||||||||
See accompanying notes to the consolidated financial statements. | |||||||||||
122
| (In millions, except share data) | As of December 31, 2022 |
As of December 31, 2021 |
|||||||||
| Liabilities, Redeemable non-controlling interests and Equity | |||||||||||
| Liabilities | |||||||||||
| Asset Management | |||||||||||
| Accounts payable, accrued expenses, and other liabilities | $ | $ | |||||||||
| Due to related parties | |||||||||||
| Debt | |||||||||||
| Liabilities of consolidated variable interest entities | |||||||||||
| Debt, at fair value | |||||||||||
| Notes payable | |||||||||||
| Other liabilities | |||||||||||
| Retirement Services | |||||||||||
| Interest sensitive contract liabilities | |||||||||||
| Future policy benefits | |||||||||||
| Debt | |||||||||||
| Payables for collateral on derivatives and securities to repurchase | |||||||||||
| Other liabilities | |||||||||||
| Liabilities of consolidated variable interest entities | |||||||||||
| Other liabilities | |||||||||||
| Total Liabilities |
|
|
|||||||||
Commitments and Contingencies (note 18) |
|||||||||||
| Redeemable non-controlling interests | |||||||||||
| Redeemable non-controlling interests | |||||||||||
| Equity | |||||||||||
Series A Preferred Stock, 0 and 11,000,000 shares issued and outstanding as of December 31, 2022 and December 31, 2021, respectively |
|||||||||||
Series B Preferred Stock, 0 and 12,000,000 shares issued and outstanding as of December 31, 2022 and December 31, 2021, respectively |
|||||||||||
Class A Common Stock, $0.00001 par value, 0 and 90,000,000,000 shares authorized, 0 and 248,896,649 shares issued and outstanding as of December 31, 2022 and December 31, 2021, respectively |
|||||||||||
Class B Common Stock, $0.00001 par value, 0 and 999,999,999 shares authorized, 0 shares issued and outstanding as of December 31, 2022 and December 31, 2021, respectively |
|||||||||||
Class C Common Stock, $0.00001 par value, 0 and 1 share authorized, 0 shares issued and outstanding as of December 31, 2022 and December 31, 2021, respectively |
|||||||||||
Common Stock, $0.00001 par value, 90,000,000,000 shares authorized, 570,276,188 shares issued and outstanding as of December 31, 2022 |
|||||||||||
| Additional paid in capital | |||||||||||
| Retained earnings (accumulated deficit) | ( |
||||||||||
| Accumulated other comprehensive income (loss) | ( |
( |
|||||||||
| Total Apollo Global Management, Inc. Stockholders’ Equity | |||||||||||
| Non-controlling interests | |||||||||||
| Total Equity |
|
|
|||||||||
| Total Liabilities, Redeemable non-controlling interests and Equity | $ |
|
$ |
|
|||||||
| (Concluded) | |||||||||||
See accompanying notes to the consolidated financial statements. | |||||||||||
123
| Years ended December 31, | |||||||||||||||||
| (In millions, except per share data) | 2022 | 2021 | 2020 | ||||||||||||||
| Revenues | |||||||||||||||||
| Asset Management | |||||||||||||||||
| Management fees | $ | $ | $ | ||||||||||||||
| Advisory and transaction fees, net | |||||||||||||||||
| Investment income (loss) | |||||||||||||||||
| Incentive fees | |||||||||||||||||
| Retirement Services | |||||||||||||||||
| Premiums | |||||||||||||||||
| Product charges | |||||||||||||||||
| Net investment income | |||||||||||||||||
| Investment related gains (losses) | ( |
||||||||||||||||
| Revenues of consolidated variable interest entities | |||||||||||||||||
| Other revenues | ( |
||||||||||||||||
| Total Revenues | |||||||||||||||||
| Expenses | |||||||||||||||||
| Asset Management | |||||||||||||||||
| Compensation and benefits | |||||||||||||||||
| Interest expense | |||||||||||||||||
| General, administrative and other | |||||||||||||||||
| Retirement Services | |||||||||||||||||
| Interest sensitive contract benefits | |||||||||||||||||
| Future policy and other policy benefits | |||||||||||||||||
| Amortization of deferred acquisition costs, deferred sales inducements and value of business acquired | |||||||||||||||||
| Policy and other operating expenses | |||||||||||||||||
| Total Expenses | |||||||||||||||||
Other income (loss) – Asset Management |
|||||||||||||||||
| Net gains (losses) from investment activities | ( |
||||||||||||||||
| Net gains (losses) from investment activities of consolidated variable interest entities | |||||||||||||||||
| Other income (loss), net | ( |
||||||||||||||||
| Total Other income (loss) | ( |
||||||||||||||||
| Income (loss) before income tax (provision) benefit | ( |
||||||||||||||||
| Income tax (provision) benefit | ( |
( |
|||||||||||||||
| Net income (loss) | ( |
||||||||||||||||
| Net (income) loss attributable to non-controlling interests | ( |
( |
|||||||||||||||
| Net income (loss) attributable to Apollo Global Management, Inc. | ( |
||||||||||||||||
| Preferred stock dividends | ( |
( |
|||||||||||||||
| Net income (loss) attributable to Apollo Global Management, Inc. common stockholders | $ | ( |
$ | $ | |||||||||||||
| Earnings (loss) per share | |||||||||||||||||
| Net income (loss) attributable to common stockholders - Basic | $ | ( |
$ | $ | |||||||||||||
| Net income (loss) attributable to common stockholders - Diluted | $ | ( |
$ | $ | |||||||||||||
| Weighted average shares outstanding – Basic | |||||||||||||||||
| Weighted average shares outstanding – Diluted | |||||||||||||||||
See accompanying notes to the consolidated financial statements. |
|||||||||||||||||
124
APOLLO GLOBAL MANAGEMENT, INC.
CONSOLIDATED STATEMENTS OF COMPREHENSIVE INCOME (LOSS)
| Years ended December 31, | |||||||||||||||||
| (In millions) | 2022 | 2021 | 2020 | ||||||||||||||
| Net income (loss) | $ | ( |
$ | $ | |||||||||||||
| Other comprehensive income (loss), before tax | |||||||||||||||||
| Unrealized investment gains (losses) on available-for-sale securities, net of offsets | ( |
( |
|||||||||||||||
| Unrealized gains (losses) on hedging instruments | |||||||||||||||||
| Foreign currency translation and other adjustments | ( |
( |
|||||||||||||||
| Other comprehensive income (loss), before tax | ( |
( |
|||||||||||||||
| Income tax expense (benefit) related to other comprehensive income (loss) | ( |
||||||||||||||||
| Other comprehensive income (loss) | ( |
( |
|||||||||||||||
| Comprehensive income (loss) | ( |
||||||||||||||||
| Comprehensive (income) loss attributable to non-controlling interests | ( |
( |
|||||||||||||||
| Comprehensive income (loss) attributable to Apollo Global Management, Inc. | $ | ( |
$ | $ | |||||||||||||
See accompanying notes to the consolidated financial statements. | |||||||||||||||||
125
For the year ended December 31, 2020 |
|||||||||||||||||||||||||||||||||||||||||||||||||||||||||||||||||
| Apollo Global Management, Inc. Stockholders | |||||||||||||||||||||||||||||||||||||||||||||||||||||||||||||||||
| (In millions) | Class A Common Stock | Class B Common Stock | Class C Common Stock | Series A Preferred Stock | Series B Preferred Stock | Additional Paid in Capital |
Retained Earnings (Accumulated Deficit) | Accumulated Other Comprehensive Loss |
Total Apollo Global Management, Inc. Stockholders’ Equity (Deficit) |
Non-Controlling Interests |
Total Equity | ||||||||||||||||||||||||||||||||||||||||||||||||||||||
| Balance at January 1, 2020 |
|
|
|
$ |
|
$ |
|
$ |
|
$ |
|
$ | ( |
$ |
|
$ |
|
$ |
|
||||||||||||||||||||||||||||||||||||||||||||||
| Equity transaction with Athene Holding | — | — | — | — | — | ( |
— | — | ( |
||||||||||||||||||||||||||||||||||||||||||||||||||||||||
| Consolidation of VIEs | — | — | — | — | — | — | — | — | — | ||||||||||||||||||||||||||||||||||||||||||||||||||||||||
| Dilution impact of issuance of common stock | — | — | — | — | — | — | — | — | |||||||||||||||||||||||||||||||||||||||||||||||||||||||||
| Capital increase related to equity-based compensation | — | — | — | — | — | — | — | — | |||||||||||||||||||||||||||||||||||||||||||||||||||||||||
| Capital contributions | — | — | — | — | — | — | — | — | — | ||||||||||||||||||||||||||||||||||||||||||||||||||||||||
| Dividends/ Distributions | — | — | — | ( |
( |
( |
( |
— | ( |
( |
( |
||||||||||||||||||||||||||||||||||||||||||||||||||||||
| Payments related to issuances of common stock for equity-based awards | — | — | — | — | ( |
— | ( |
— | ( |
||||||||||||||||||||||||||||||||||||||||||||||||||||||||
| Repurchase of common stock | ( |
— | — | — | — | ( |
— | — | ( |
— | ( |
||||||||||||||||||||||||||||||||||||||||||||||||||||||
| Exchange of AOG Units for common stock | — | — | — | — | ( |
— | ( |
||||||||||||||||||||||||||||||||||||||||||||||||||||||||||
| Net income (loss) | — | — | — | — | — | ||||||||||||||||||||||||||||||||||||||||||||||||||||||||||||
| Accumulated other comprehensive income | — | — | — | — | — | — | — | ||||||||||||||||||||||||||||||||||||||||||||||||||||||||||
| Balance at December 31, 2020 |
|
|
|
$ |
|
$ |
|
$ |
|
$ |
|
$ | ( |
$ |
|
$ |
|
$ |
|
||||||||||||||||||||||||||||||||||||||||||||||
| (Continued) | |||||||||||||||||||||||||||||||||||||||||||||||||||||||||||||||||
See accompanying notes to the consolidated financial statements. | |||||||||||||||||||||||||||||||||||||||||||||||||||||||||||||||||
126
For the year ended December 31, 2021 |
|||||||||||||||||||||||||||||||||||||||||||||||||||||||||||||||||
| Apollo Global Management, Inc. Stockholders | |||||||||||||||||||||||||||||||||||||||||||||||||||||||||||||||||
| (In millions) | Class A Common Stock | Class B Common Stock | Class C Common Stock | Series A Preferred Stock | Series B Preferred Stock | Additional Paid in Capital |
Retained Earnings (Accumulated Deficit) | Accumulated Other Comprehensive Loss |
Total Apollo Global Management, Inc. Stockholders’ Equity (Deficit) |
Non-Controlling Interests |
Total Equity | ||||||||||||||||||||||||||||||||||||||||||||||||||||||
Balance at January 1, 2021 |
|
|
|
$ |
|
$ |
|
$ |
|
$ |
|
$ | ( |
$ |
|
$ |
|
$ |
|
||||||||||||||||||||||||||||||||||||||||||||||
| Deconsolidation of VIEs | — | — | — | — | — | — | — | — | — | ( |
( |
||||||||||||||||||||||||||||||||||||||||||||||||||||||
| Accretion of redeemable non-controlling interests | — | — | — | — | — | ( |
— | — | ( |
— | ( |
||||||||||||||||||||||||||||||||||||||||||||||||||||||
| Issuance of common stock related to equity transactions | — | — | — | — | — | — | — | — | |||||||||||||||||||||||||||||||||||||||||||||||||||||||||
| Pledge of common stock | — | — | — | — | — | — | — | — | |||||||||||||||||||||||||||||||||||||||||||||||||||||||||
| Purchase of limited partnership interests | — | — | — | — | — | ( |
— | — | ( |
( |
( |
||||||||||||||||||||||||||||||||||||||||||||||||||||||
| Dilution impact of issuance of common stock | — | — | — | — | — | ( |
— | — | ( |
— | ( |
||||||||||||||||||||||||||||||||||||||||||||||||||||||
| Capital increase related to equity-based compensation | — | — | — | — | — | — | — | — | |||||||||||||||||||||||||||||||||||||||||||||||||||||||||
| Capital contributions | — | — | — | — | — | — | — | — | — | ||||||||||||||||||||||||||||||||||||||||||||||||||||||||
| Dividends/ distributions | — | — | — | ( |
( |
— | ( |
— | ( |
( |
( |
||||||||||||||||||||||||||||||||||||||||||||||||||||||
| Payments related to issuances of common stock for equity-based awards | — | — | — | — | ( |
— | ( |
— | ( |
||||||||||||||||||||||||||||||||||||||||||||||||||||||||
| Repurchase of common stock | ( |
— | — | — | — | ( |
— | — | ( |
— | ( |
||||||||||||||||||||||||||||||||||||||||||||||||||||||
| Exchange of AOG Units for common stock | — | — | — | — | — | — | ( |
||||||||||||||||||||||||||||||||||||||||||||||||||||||||||
| Net income (loss) | — | — | — | — | — | ||||||||||||||||||||||||||||||||||||||||||||||||||||||||||||
| Accumulated other comprehensive income (loss) | — | — | — | — | — | — | — | ( |
( |
( |
( |
||||||||||||||||||||||||||||||||||||||||||||||||||||||
Balance at December 31, 2021 |
|
|
|
$ |
|
$ |
|
$ |
|
$ |
|
$ | ( |
$ |
|
$ |
|
$ |
|
||||||||||||||||||||||||||||||||||||||||||||||
| (Continued) | |||||||||||||||||||||||||||||||||||||||||||||||||||||||||||||||||
See accompanying notes to the consolidated financial statements. | |||||||||||||||||||||||||||||||||||||||||||||||||||||||||||||||||
127
For the year ended December 31, 2022 |
|||||||||||||||||||||||||||||||||||||||||||||||||||||
| Apollo Global Management, Inc. Stockholders | |||||||||||||||||||||||||||||||||||||||||||||||||||||
| (In millions) | Common Stock | Series A Preferred Stock | Series B Preferred Stock | Additional Paid in Capital |
Retained Earnings (Accumulated Deficit) | Accumulated Other Comprehensive Loss |
Total Apollo Global Management, Inc. Stockholders’ Equity (Deficit) |
Non-Controlling
Interests
|
Total Equity |
||||||||||||||||||||||||||||||||||||||||||||
Balance at January 1, 2022 |
|
$ |
|
$ |
|
$ |
|
$ |
|
$ | ( |
$ |
|
$ |
|
$ |
|
||||||||||||||||||||||||||||||||||||
| Merger with Athene | — | — | — | — | |||||||||||||||||||||||||||||||||||||||||||||||||
| Issuance of warrants | — | — | — | — | — | — | |||||||||||||||||||||||||||||||||||||||||||||||
| Reclassification of preferred stock to non-controlling interests | — | ( |
( |
— | — | — | ( |
||||||||||||||||||||||||||||||||||||||||||||||
| Consolidation/ deconsolidation of VIEs | — | — | — | ( |
— | ( |
( |
||||||||||||||||||||||||||||||||||||||||||||||
| Issuance of common stock related to equity transactions | — | — | — | — | — | ||||||||||||||||||||||||||||||||||||||||||||||||
| Accretion of redeemable non-controlling interests | — | — | — | ( |
— | — | ( |
— | ( |
||||||||||||||||||||||||||||||||||||||||||||
| Capital increase related to equity-based compensation | — | — | — | — | — | ||||||||||||||||||||||||||||||||||||||||||||||||
| Capital contributions | — | — | — | — | — | — | — | ||||||||||||||||||||||||||||||||||||||||||||||
| Dividends/ distributions | — | — | — | ( |
— | — | ( |
( |
( |
||||||||||||||||||||||||||||||||||||||||||||
| Transactions between entities under common control | — | — | — | — | — | — | |||||||||||||||||||||||||||||||||||||||||||||||
| Payments related to issuances of common stock for equity-based awards | — | — | ( |
— | ( |
— | ( |
||||||||||||||||||||||||||||||||||||||||||||||
| Repurchase of common stock | ( |
— | — | ( |
— | — | ( |
— | ( |
||||||||||||||||||||||||||||||||||||||||||||
| Exchange of AOG Units for common stock | — | — | — | — | ( |
( |
|||||||||||||||||||||||||||||||||||||||||||||||
| Net income (loss) | — | — | — | — | ( |
— | ( |
( |
( |
||||||||||||||||||||||||||||||||||||||||||||
| Accumulated other comprehensive income (loss) | — | — | — | — | — | ( |
( |
( |
( |
||||||||||||||||||||||||||||||||||||||||||||
Balance at December 31, 2022 |
|
$ |
|
$ |
|
$ |
|
$ | ( |
$ | ( |
$ |
|
$ |
|
$ |
|
||||||||||||||||||||||||||||||||||||
| (Concluded) | |||||||||||||||||||||||||||||||||||||||||||||||||||||
See accompanying notes to the consolidated financial statements. | |||||||||||||||||||||||||||||||||||||||||||||||||||||
128
| Years ended December 31, | |||||||||||||||||
| (In millions) | 2022 | 2021 | 2020 | ||||||||||||||
| Cash Flows from Operating Activities | |||||||||||||||||
| Net Income (Loss) | $ | ( |
$ | $ | |||||||||||||
| Adjustments to Reconcile Net Income (Loss) to Net Cash Provided by (Used in) Operating Activities: | |||||||||||||||||
| Equity-based compensation | |||||||||||||||||
| Net investment income | ( |
( |
( |
||||||||||||||
| Net recognized (gains) losses on investments and derivatives | ( |
||||||||||||||||
| Depreciation and amortization | |||||||||||||||||
| Net amortization of net investment premiums, discount and other | |||||||||||||||||
| Policy acquisition costs deferred | ( |
||||||||||||||||
| Other non-cash amounts included in net income (loss), net | |||||||||||||||||
| Changes in consolidation | ( |
( |
|||||||||||||||
| Changes in operating assets and liabilities: | |||||||||||||||||
| Purchases of investments by Funds and VIEs | ( |
( |
( |
||||||||||||||
| Proceeds from sale of investments by Funds and VIEs | |||||||||||||||||
| Interest sensitive contract liabilities | ( |
||||||||||||||||
| Future policy benefits and reinsurance recoverable | |||||||||||||||||
| Other assets and liabilities, net | ( |
||||||||||||||||
| Net cash provided by (used in) operating activities | $ | $ | $ | ( |
|||||||||||||
| Cash Flows from Investing Activities | |||||||||||||||||
| Purchases of investments and contributions to equity method investments | $ | ( |
$ | $ | |||||||||||||
| Purchases of available-for-sale securities | ( |
||||||||||||||||
| Purchases of mortgage loans | ( |
||||||||||||||||
| Purchases of investment funds | ( |
( |
( |
||||||||||||||
| Purchases of U.S. Treasury securities | ( |
( |
( |
||||||||||||||
| Purchases of derivatives instruments and other investments | ( |
||||||||||||||||
| Sales, maturities and repayments of investments and distributions from equity method investments | |||||||||||||||||
| Cash acquired through merger | |||||||||||||||||
| Other investing activities, net | ( |
( |
( |
||||||||||||||
| Net cash used in investing activities | $ | ( |
$ | ( |
$ | ( |
|||||||||||
| Cash Flows from Financing Activities | |||||||||||||||||
| Issuance of debt | $ | $ | $ | ||||||||||||||
| Repayment of debt | ( |
( |
( |
||||||||||||||
| Repurchase of common stock | ( |
( |
( |
||||||||||||||
| Common stock dividends | ( |
( |
( |
||||||||||||||
| Preferred stock dividends | ( |
( |
|||||||||||||||
| Distributions paid to non-controlling interests | ( |
( |
( |
||||||||||||||
| Contributions from non-controlling interests | |||||||||||||||||
| Distributions to redeemable non-controlling interests | ( |
||||||||||||||||
| Contributions from redeemable non-controlling interests | |||||||||||||||||
| Proceeds from issuance of Class A units of SPAC, net of underwriting and offering costs | |||||||||||||||||
| Deposits on investment-type policies and contracts | |||||||||||||||||
| Withdrawals on investment-type policies and contracts | ( |
||||||||||||||||
| Net change in cash collateral posted for derivative transactions and securities to repurchase | ( |
||||||||||||||||
| Other financing activities, net | ( |
( |
|||||||||||||||
| Net cash provided by financing activities | $ | $ | $ | ||||||||||||||
| (Continued) | |||||||||||||||||
129
| Years ended December 31, | |||||||||||||||||
| (In millions) | 2022 | 2021 | 2020 | ||||||||||||||
| Effect of exchange rate changes on cash and cash equivalents | ( |
||||||||||||||||
| Net Increase (Decrease) in Cash and Cash Equivalents, Restricted Cash and Cash Equivalents, and Cash and Cash Equivalents Held at Consolidated Variable Interest Entities | ( |
||||||||||||||||
| Cash and Cash Equivalents, Restricted Cash and Cash Equivalents, and Cash and Cash Equivalents Held at Consolidated Variable Interest Entities, Beginning of Period | |||||||||||||||||
| Cash and Cash Equivalents, Restricted Cash and Cash Equivalents, and Cash and Cash Equivalents Held at Consolidated Variable Interest Entities, End of Period | $ | $ | $ | ||||||||||||||
| Supplemental Disclosure of Cash Flow Information | |||||||||||||||||
| Cash paid for taxes | $ | $ | $ | ||||||||||||||
| Cash paid for interest | |||||||||||||||||
| Non-cash transactions | |||||||||||||||||
| Non-Cash Investing Activities | |||||||||||||||||
| Asset Management and Other | |||||||||||||||||
| Contributions to principal investments | |||||||||||||||||
| Acquisition of goodwill and intangibles | |||||||||||||||||
| Distributions from principal investments | ( |
||||||||||||||||
| Purchases of other investments, at fair value | |||||||||||||||||
| Sales of other investments, at fair value | ( |
||||||||||||||||
| Non-cash capital commitment | ( |
||||||||||||||||
| Contingent consideration | ( |
||||||||||||||||
| Non-cash loss on Athene equity swap | ( |
||||||||||||||||
| Retirement Services | |||||||||||||||||
| Investments received from settlements on reinsurance agreements | |||||||||||||||||
| Investments received from pension group annuity premiums | |||||||||||||||||
| Assets contributed to consolidated VIEs | |||||||||||||||||
| Investments exchanged with third-party cedants | |||||||||||||||||
| Non-Cash Financing Activities | |||||||||||||||||
| Asset Management and Other | |||||||||||||||||
| Capital increases related to equity-based compensation | |||||||||||||||||
| Purchase of limited partnership interests | |||||||||||||||||
| Issuance of restricted shares | |||||||||||||||||
| Non-cash issuance of AOG units to Athene | |||||||||||||||||
| Other non-cash financing activities | ( |
||||||||||||||||
| Non-cash distributions paid to non-controlling interests in VIEs | ( |
||||||||||||||||
| Retirement Services | |||||||||||||||||
| Deposits on investment-type policies and contracts through reinsurance agreements | |||||||||||||||||
| Withdrawals on investment-type policies and contracts through reinsurance agreements | |||||||||||||||||
| (Continued) | |||||||||||||||||
130
| Years ended December 31, | |||||||||||||||||
| (In millions) | 2022 | 2021 | 2020 | ||||||||||||||
| Supplemental Disclosure of Cash Flow Information of Consolidated VIEs | |||||||||||||||||
| Cash Flows from Operating Activities | |||||||||||||||||
| Purchases of investments - Asset Management | ( |
( |
( |
||||||||||||||
| Proceeds from sale of investments - Asset Management | |||||||||||||||||
| Cash Flows from Investing Activities | |||||||||||||||||
| Purchases of investments - Retirement Services | ( |
||||||||||||||||
| Proceeds from sale of investments - Retirement Services | |||||||||||||||||
| Purchase of U.S. Treasury Securities | ( |
( |
( |
||||||||||||||
| Proceeds from maturities of U.S. Treasury Securities | |||||||||||||||||
| Cash Flows from Financing Activities | |||||||||||||||||
| Issuance of debt | |||||||||||||||||
| Principal repayment of debt | ( |
( |
( |
||||||||||||||
| Distributions paid to non-controlling interests | ( |
( |
( |
||||||||||||||
| Contributions from non-controlling interests | |||||||||||||||||
| Proceeds from issuance of Class A units of SPAC, net of underwriting and offering costs | |||||||||||||||||
| Changes in Consolidation | |||||||||||||||||
| Investments, at fair value | ( |
||||||||||||||||
| Other assets | ( |
||||||||||||||||
| Debt, at fair value | ( |
||||||||||||||||
| Notes payable | |||||||||||||||||
| Other liabilities | ( |
||||||||||||||||
| Non-controlling interest | ( |
||||||||||||||||
| Adjustments related to exchange of Apollo Operating Group units: | |||||||||||||||||
| Deferred tax assets | |||||||||||||||||
| Due to affiliates | ( |
( |
|||||||||||||||
| Additional paid in capital | ( |
( |
|||||||||||||||
| Non-Controlling Interest in Apollo Operating Group | |||||||||||||||||
Reconciliation of Cash and Cash Equivalents, Restricted Cash and Cash Equivalents, and Cash and Cash Equivalents Held at Consolidated Variable Interest Entities to the Consolidated Statements of Financial Condition: |
|||||||||||||||||
| Cash and cash equivalents | $ | $ | $ | ||||||||||||||
| Restricted cash and cash equivalents | |||||||||||||||||
| Cash and cash equivalents held at consolidated variable interest entities | |||||||||||||||||
| Total Cash and Cash Equivalents, Restricted Cash and Cash Equivalents, and Cash and Cash Equivalents Held at Consolidated Variable Interest Entities | $ | $ | $ | ||||||||||||||
| (Concluded) | |||||||||||||||||
See accompanying notes to the consolidated financial statements. | |||||||||||||||||
131
1. Organization
Apollo Global Management, Inc. together with its consolidated subsidiaries (collectively, “Apollo” or the “Company”) is a high-growth, global alternative asset manager and a retirement services provider. Its asset management business focuses on three investing strategies: yield, hybrid and equity. Through its asset management business, Apollo raises, invests and manages funds, accounts and other vehicles, on behalf of some of the world’s most prominent pension, endowment and sovereign wealth funds and insurance companies, as well as other institutional and individual investors. Apollo’s retirement services business is conducted by Athene, a leading financial services company that specializes in issuing, reinsuring and acquiring retirement savings products for the increasing number of individuals and institutions seeking to fund retirement needs.
Merger with Athene
On January 1, 2022, Apollo and Athene completed the previously announced merger transactions pursuant to the Merger Agreement (the “Mergers”). As a result of the Mergers, AAM and AHL became consolidated subsidiaries of AGM.
Athene’s results are included in the consolidated financial statements commencing from the Merger Date. References herein to “Apollo” and the “Company” refer to AGM and its subsidiaries, including Athene, unless the context requires otherwise such as in sections where it refers to the asset management business only. See note 3 for additional information.
Corporate Recapitalization
In connection with the closing of the Mergers, the Company completed a corporate recapitalization (the “Corporate Recapitalization”) which resulted in the recapitalization of the Company from an umbrella partnership C corporation (“Up-C”) structure to a corporation with a single class of common stock with one vote per share.
Griffin Capital Acquisitions
On May 3, 2022, the Company completed the acquisition of the U.S. asset management business of Griffin Capital in exchange for closing consideration of $213 million and contingent consideration of $64 million, substantially all of which was settled in shares of AGM common stock, per the transaction agreement signed December 2, 2021. This follows the March 2022 close of Griffin Capital’s U.S. wealth distribution business. As a result of the final close, the Griffin Institutional Access Real Estate Fund and the Griffin Institutional Access Credit Fund are advised by Apollo and have been renamed the Apollo Diversified Real Estate Fund and Apollo Diversified Credit Fund, respectively.
2. Summary of Significant Accounting Policies
Furthermore, in conjunction with the Mergers, Apollo was deemed to be the accounting acquirer and Athene the accounting acquiree, which, for financial reporting purposes, results in Apollo’s historical financial information prior to the Mergers becoming that of the Company. Athene’s results before the Mergers have not been included in the consolidated financial statements of the Company. The consolidated financial statements include the assets, liabilities, operating results and cash flows of Athene from the date of acquisition. For information on Athene prior to the Mergers, please refer to the annual financial statements included in AHL’s annual report on Form 10-K for the year ended December 31, 2021.
Following the Mergers, the Company’s principal subsidiaries, AAM and AHL, together with their subsidiaries, operate an asset management business and a retirement services business, respectively, which possess distinct characteristics. As a result, the Company’s financial statement presentation is organized into two tiers: asset management and retirement services. The
132
Company believes that separate presentation provides a more informative view of the Company’s consolidated financial condition and results of operations than an aggregated presentation.
The following summary of significant accounting policies first includes those most significant to the overall Company and then specific accounting policies for each of the asset management and retirement services businesses, respectively.
Significant Accounting Policies— Overall
Consolidation
The Company consolidates entities where it has a controlling financial interest unless there is a specific scope exception that prevents consolidation. The types of entities with which the Company is involved generally include, but are not limited to:
•subsidiaries, which includes AAM and its subsidiaries, including management companies and general partners of funds that the Company manages, and AHL and its subsidiaries
•funds, including entities that have attributes of an investment company
•SPACs
•CLOs
Investment Companies
Judgment is required to evaluate whether an entity has the necessary characteristics to be accounted for as an investment company. The funds managed by the Company that meet the investment company criteria are generally not required to consolidate operating companies and generally reflect their investments in operating companies and other investment companies at fair value. The Company has retained this specialized accounting for investment companies in consolidation.
Variable Interest Entities
All entities are first considered under the VIE model. VIEs are entities that 1) do not have sufficient equity at risk to finance their activities without additional subordinated financial support or 2) have equity investors at risk that do not have the ability to make significant decisions related to the entity’s operations, absorb expected losses, or receive expected residual returns.
The Company consolidates a VIE if it is the primary beneficiary of the entity. The Company is deemed the primary beneficiary when it has a controlling financial interest in the VIE, which is defined as possessing both (i) the power to direct the activities of the VIE that most significantly impact the VIE’s economic performance (“primary beneficiary power”) and (ii) the obligation to absorb losses or the right to receive benefits from the VIE that could potentially be significant (“significant variable interest”). The Company performs the VIE and primary beneficiary assessment at inception of its involvement with a VIE and on an ongoing basis if facts and circumstances change.
To assess whether the Company has the primary beneficiary power under the VIE consolidation model, it considers the design of the entity as well as ongoing rights and responsibilities. In general, the parties that can make the most significant decisions regarding asset management have control over servicing, liquidation rights or the unilateral right to remove the decision-makers. To assess whether the Company has a significant variable interest, the Company considers all its economic interests that are considered variable interests in the entity, including interests held through related parties. This assessment requires judgment in considering whether those interests are significant.
Assets and liabilities of the consolidated VIEs, other than SPACs, are primarily shown in separate sections within the consolidated statements of financial condition. Changes in the fair value of the consolidated VIEs’ assets and liabilities and related interest, dividend and other income and expenses are primarily presented within net gains from investment activities of consolidated variable interest entities in the consolidated statements of operations. The portion attributable to non-controlling interests is reported within net income attributable to non-controlling interests in the consolidated statements of operations. For additional disclosures regarding VIEs, see notes 6 and 17.
133
Voting Interest Entities
Entities that are not determined to be VIEs are generally considered VOEs. Under the voting interest model, the Company consolidates those entities it controls through a majority voting interest. The Company does not consolidate those VOEs in which substantive kick-out rights have been granted to the unrelated investors to either dissolve the fund or remove the general partner.
Non-controlling Interests
For entities that are consolidated, but not wholly owned, a portion of the income or loss and corresponding equity is allocated to owners other than the Company. The aggregate of the income or loss and corresponding equity that is not owned by the Company is included in non-controlling interests in the consolidated financial statements. Non-controlling interests also include ownership interests in certain consolidated funds and VIEs.
Non-controlling interests are presented as a separate component of equity on the Company’s consolidated statements of financial condition. Net income (loss) includes the net income (loss) attributable to the holders of non-controlling interests on the Company’s consolidated statements of operations. Profits and losses are allocated to non-controlling interests in proportion to their relative ownership interests regardless of their basis.
Use of Estimates
The preparation of the consolidated financial statements requires management to make estimates and assumptions that affect the reported amounts in the financial statements and related footnotes. The Company’s most significant estimates include goodwill and intangible assets, income taxes, performance allocations, incentive fees, non-cash compensation, fair value of investments (including derivatives) and debt, impairment of investments and allowances for expected credit losses, DAC, DSI and VOBA, and future policy benefit reserves. While such impact may change considerably over time, the estimates and assumptions affecting the Company’s consolidated financial statements are based on the best available information as of December 31, 2022. Actual results could differ materially from those estimates.
Cash and Cash Equivalents
The Company considers all highly liquid short-term investments, including money market funds and U.S. Treasury securities, with original maturities of three months or less when purchased to be cash equivalents. Interest income from cash and cash equivalents is recorded in other income for asset management and net investment income for retirement services in the consolidated statements of operations. The carrying values of the money market funds and U.S. Treasury securities represent their fair values due to their short-term nature. Substantially all of the Company’s cash on deposit is in interest bearing accounts with major financial institutions and exceed insured limits.
Restricted Cash and Cash Equivalents
Restricted cash and cash equivalents represent balances that are restricted as to withdrawal or usage.
Restricted cash consists of cash and cash equivalents held in funds in trust as part of certain coinsurance agreements to secure statutory reserves and liabilities of the coinsured parties. For periods prior to June 30, 2022, cash held in reserve accounts was also used to make required payments in respect of the 2039 Senior Secured Guaranteed Notes. Restricted cash also includes cash deposited at a bank that is pledged as collateral in connection with leased premises.
Foreign Currency
The Company holds foreign currency denominated assets and liabilities. Non-monetary assets and liabilities of the Company’s international subsidiaries are remeasured into the functional currency using historical exchange rates specific to each asset and liability, the exchange rates prevailing at the end of each reporting period are used for all others. The results of the Company’s foreign operations are remeasured using an average exchange rate for the respective reporting period. Currency remeasurement adjustments and gains and losses on the settlement of foreign currency translations are included within other income (loss), net for asset management or investment related gains (losses) for retirement services in the consolidated statements of operations. Foreign currency denominated assets and liabilities are translated into the reporting currency using the exchange rates
134
Investments
Equity Method Investments
For investments in entities over which the Company exercises significant influence but does not meet the requirements for consolidation and has not elected the fair value option, the Company uses the equity method of accounting. Under the equity method of accounting, the Company records its share of the underlying income or loss of such entities adjusted for distributions. The Company’s share of the underlying net income or loss of such entities is recorded in Investment income (loss) for asset management and Net investment income for retirement services in the consolidated statements of operations.
The carrying amounts of equity method investments are recorded in investments in the consolidated statements of financial condition. Generally, the underlying entities that the Company manages and invests in are primarily investment companies, and the carrying value of the Company’s equity method investments approximates fair value.
Reverse Repurchase Agreements and Repurchase Agreements
A reverse repurchase agreement is a transaction in which the Company purchases financial instruments from a seller and simultaneously enters into an agreement to resell the same or substantially the same financial instruments to the seller at a fixed and determinable price at a future date. A repurchase agreement is a transaction in which the Company sells financial instruments to a buyer, typically in exchange for cash, and simultaneously enters into an agreement to repurchase the same or substantially the same financial instruments from the buyer at a fixed and determinable price at a future date.
Although reverse repurchase and repurchase agreements generally involve the legal transfer of ownership of financial instruments, they are accounted for as financing arrangements because they require the financial instruments to be resold or repurchased before or at the maturity of the agreement. As a result, the collateral received under reverse repurchase agreements are not recognized and the collateral pledged under repurchase agreements are not derecognized in the consolidated statements of financial condition.
Within asset management, reverse repurchase and repurchase agreements generally sit within consolidated VIEs and as such, those reverse repurchase and repurchase agreements are reflected as investments and other liabilities, respectively, within the consolidated VIE section of the statements of financial condition. Additionally, the income (loss) related to those reverse repurchase and repurchase agreements from consolidated VIEs are included in Net gains (losses) from investment activities of consolidated variable interest entities on the consolidated statements of operations. Reverse repurchase agreements with asset management are generally accounted for by electing the fair value option. For retirement services, the receivable under the reverse repurchase agreement is recorded as investment for the principal amount loaned under the agreement and the payable under a repurchase agreement is recognized as payables for collateral on derivatives and securities to repurchase on the consolidated statements of financial condition. Earnings from reverse repurchase agreements are included in net investment income for retirement services on the consolidated statements of operations.
Financial Instruments held by Consolidated VIEs
The consolidated VIEs managed by the Company are primarily investment companies and CLOs. Their investments include debt and equity securities held at fair value and reverse repurchase agreements. Financial instruments are generally accounted for on a trade date basis.
Under a measurement alternative permissible for consolidated collateralized financing entities, the Company measures both the financial assets and financial liabilities of consolidated CLOs in its consolidated financial statements in both cases using the fair value of the financial assets or financial liabilities, whichever are more observable.
135
Where financial assets are more observable, the financial assets of the consolidated CLOs are measured at fair value and the financial liabilities are measured in consolidation as: (i) the sum of the fair value of the financial assets and the carrying value of any non-financial assets that are incidental to the operations of the CLOs less (ii) the sum of the fair value of any beneficial interests retained by the Company (other than those that represent compensation for services) and the Company’s carrying value of any beneficial interests that represent compensation for services. The resulting amount is allocated to the individual financial liabilities (other than the beneficial interest retained by the Company) using a reasonable and consistent methodology.
Where financial liabilities are more observable, the financial liabilities of the consolidated CLOs are measured at fair value and the financial assets are measured in consolidation as: (i) the sum of the fair value of the financial liabilities, and the carrying value of any non-financial liabilities that are incidental to the operations of the CLOs less (ii) the carrying value of any non-financial assets that are incidental to the operations of the CLOs. The resulting amount is allocated to the individual financial assets using a reasonable and consistent methodology.
Net income attributable to Apollo Global Management, Inc. reflects the Company’s own economic interests in the consolidated CLOs, including (i) changes in the fair value of the beneficial interests retained by the Company and (ii) beneficial interests that represent compensation for collateral management services.
Certain consolidated VIEs have applied the fair value option for certain investments in private debt securities that otherwise would not have been carried at fair value with gains and losses in net income.
Fair Value of Financial Instruments
The fair value of a financial instrument is the price that would be received to sell an asset or paid to transfer a liability (exit price) in an orderly transaction between market participants at the measurement date under current market conditions. The actual realized gains or losses will depend on, among other factors, future operating results, the value of the assets and market conditions at the time of disposition, any related transaction costs and the timing and manner of sale, all of which may ultimately differ significantly from the assumptions on which the valuations were based.
Fair Value Option
Fair Value Hierarchy
U.S. GAAP establishes a hierarchical disclosure framework which prioritizes and ranks the level of market price observability used in measuring financial instruments at fair value. Market price observability is affected by a number of factors, including the type of financial instrument, the characteristics specific to the financial instrument and the state of the marketplace, including the existence and transparency of transactions between market participants. Financial instruments with readily available quoted prices in active markets generally will have a higher degree of market price observability and a lesser degree of judgment used in measuring fair value.
Financial instruments measured and reported at fair value are classified and disclosed based on the observability of inputs used in the determination of fair values, as follows:
Level 1 – Quoted prices are available in active markets for identical financial instruments as of the reporting date. The Company does not adjust the quoted price for these financial instruments, even in situations where the Company holds a large position and the sale of such position would likely deviate from the quoted price.
Level 2 – Pricing inputs are other than quoted prices in active markets, which are either directly or indirectly observable as of the reporting date, and fair value is determined through the use of models or other valuation methodologies. These financial instruments exhibit higher levels of liquid market observability as compared to Level 3 financial instruments.
136
Level 3 – Pricing inputs are unobservable for the financial instrument and includes situations where there is little observable market activity for the financial instrument. The inputs into the determination of fair value may require significant management judgment or estimation. Financial instruments that are included in this category generally include investments where the fair value is based on observable inputs as well as unobservable inputs.
When a security is valued based on broker quotes, the Company subjects those quotes to various criteria in making the determination as to whether a particular financial instrument would qualify for classification as Level 2 or Level 3. These criteria include, but are not limited to, the number and quality of the broker quotes, the standard deviations of the observed broker quotes, and the percentage deviation from external pricing services.
Investments in securities that are traded on a securities exchange or comparable over-the-counter quotation systems are valued based on the last reported sale price at that date. If no sales of such investments are reported on such date, and in the case of over-the-counter securities or other investments for which the last sale date is not available, valuations are based on independent market quotations obtained from market participants, recognized pricing services or other sources deemed relevant, and the prices are based on the average of the “bid” and “ask” prices, or at ascertainable prices at the close of business on such day. Market quotations are generally based on valuation pricing models or market transactions of similar securities adjusted for security-specific factors such as relative capital structure priority and interest and yield risks, among other factors. When market quotations are not available, a model-based approach is used to determine fair value.
In certain cases, the inputs used to measure fair value may fall into different levels of the fair value hierarchy. In such cases, a financial instrument’s level within the fair value hierarchy is based on the lowest level of input that is significant to the fair value measurement. The Company’s assessment of the significance of a particular input to the fair value measurement in its entirety requires judgment and considers factors specific to the financial instrument when the fair value is based on unobservable inputs.
Business Combinations
The Company accounts for business combinations using the acquisition method of accounting where the consideration transferred of the acquisition is allocated to the assets acquired and liabilities assumed using the fair values determined by management as of the acquisition date. Contingent consideration obligations that are elements of the consideration transferred are recognized as of the acquisition date as part of the fair value transferred in exchange for the acquired business. Acquisition-related costs incurred in connection with a business combination are expensed as incurred.
Goodwill
Goodwill represents the excess of cost over the fair value of identifiable net assets of an acquired business. Goodwill is recorded in separate line items for both the Asset Management and Retirement Services segments. See note 3 for disclosure regarding the goodwill recorded related to the Mergers.
Other Assets
Other assets are primarily comprised of deferred tax assets, leases and fixed assets.
Fixed assets consist primarily of leasehold improvements, furniture, fixtures, equipment, and computer hardware and are recorded at cost, net of accumulated depreciation and amortization. Depreciation and amortization is calculated using the straight-line method over the assets’ estimated useful lives and in the case of leasehold improvements the lesser of the useful life or the term of the lease. Expenditures for repairs and maintenance are charged to expense when incurred. The Company evaluates long-lived assets for impairment periodically and whenever events or changes in circumstances indicate the carrying amounts of the assets may be impaired.
137
Compensation and Benefits
Compensation consists of (i) salary, bonus, and benefits, which includes base salaries, discretionary and non-discretionary bonuses, severance and employee benefits, (ii) equity-based awards granted to employees and non-employees that are measured based on the grant date fair value of the award and (iii) profit sharing expense, which primarily consists of a portion of performance revenues earned from certain funds that are allocated to employees and former employees. Compensation costs are recorded in compensation and benefits for asset management and policy and other operating expense for retirement services in the consolidated statements of operations.
Earnings Per Share
As the Company has issued participating securities, the two-class method of computing earnings per share is used for all periods presented for common stock and participating securities as if all earnings for the period had been distributed. Under the two-class method, during periods of net income, the net income is first reduced for distributions declared on all classes of securities to arrive at undistributed earnings. During periods of net losses, the net loss is reduced for distributions declared on participating securities only if the security has the right to participate in the earnings of the entity and an objectively determinable contractual obligation to share in net losses of the entity. Participating securities include vested and unvested RSUs that participate in distributions, as well as unvested restricted shares.
Whether during a period of net income or net loss, under the two-class method the remaining earnings are allocated to common stock and participating securities to the extent that each security shares in earnings as if all of the earnings for the period had been distributed. Earnings or losses allocated to each class of security are then divided by the applicable weighted average outstanding shares to arrive at basic earnings per share. For the diluted earnings, the denominator includes all outstanding shares of common stock and includes the number of additional shares of common stock that would have been outstanding if the dilutive potential shares of common stock had been issued. The numerator is adjusted for any changes in income or loss that would result from the issuance of these potential shares of common stock.
Share Repurchase
When shares are repurchased, the Company can choose to record treasury shares or account for the repurchase as a constructive retirement. The Company accounted for share repurchases as constructive retirement, whereby it reduced common stock and additional paid-in capital by the amount of the original issuance, with any excess purchase price recorded as a reduction to retained earnings. Under this method, issued and outstanding shares are reduced by the shares repurchased, and no treasury stock is recognized on the consolidated statements of financial condition.
Income Taxes
AGM is a Delaware corporation and generally all of its income is subject to U.S. corporate income taxes. Certain subsidiaries of the Company operate as partnerships for U.S. income tax purposes and are subject to NYC UBT. Certain non-U.S. entities are also subject to non-U.S. corporate income taxes. In conjunction with the Mergers, Apollo underwent a reorganization from an Up-C structure to a C-corporation with a single class of common stock. Athene, and certain of its non-U.S. subsidiaries, are Bermuda exempted companies that have historically not been subject to U.S. corporate income taxes on their earnings. Due to the Mergers, Athene’s non-U.S. earnings will generally be subject to U.S. corporate income taxes.
Significant judgment is required in determining tax expense and in evaluating certain and uncertain tax positions. The Company recognizes the tax benefit of uncertain tax positions only where the position is “more likely than not” to be sustained upon examination, including resolution of any related appeals or litigation processes, based on the technical merits of the position. The tax benefit is measured as the largest amount of benefit that has a greater than 50% likelihood of being realized upon
138
ultimate settlement. If a tax position is not considered more likely than not to be sustained, then no benefits of the position are recognized. The Company’s tax positions are reviewed and evaluated quarterly to determine whether the Company has uncertain tax positions that require financial statement recognition.
Deferred tax assets and liabilities are recognized for the expected future tax consequences of differences between the carrying amount of assets and liabilities and their respective tax bases using currently enacted tax rates. The effect on deferred tax assets and liabilities of a change in tax rates is recognized in income in the period during which the change is enacted. Deferred tax assets are reduced by a valuation allowance when it is more likely than not that all or a portion of the deferred tax assets will not be realized.
Significant judgment and estimates are required in determining whether valuation allowances should be established as well as the amount of such allowances. When making such determination, consideration is given to, among other things, the following:
•whether sufficient taxable income exists within the allowed carryback or carryforward periods;
•whether future reversals of existing taxable temporary differences will occur, including any tax planning strategies that could be used;
•the nature or character (e.g., ordinary vs. capital) of the deferred tax assets and liabilities; and
•whether future taxable income exclusive of reversing temporary differences and carryforwards exists.
Debt Issuance Costs
Debt issuance costs consist of costs incurred in obtaining financing and are amortized over the term of the financing using the effective interest method. These costs are generally recorded as a direct deduction from the carrying amount of the related debt liability on the consolidated statements of financial condition.
Recently Issued Accounting Pronouncements
Business Combinations – Accounting for Contract Assets and Contract Liabilities from Contracts with Customers (ASU 2021-08)
In October 2021, the FASB issued guidance to add contract assets and contract liabilities from contracts with customers acquired in a business combination to the list of exceptions to the fair value recognition and measurement principles that apply to business combinations, and instead require them to be accounted for in accordance with revenue recognition guidance. The new guidance was adopted by the Company on January 1, 2023 and applied prospectively.
Reference Rate Reform (Topic 848) — Deferral of the Sunset Date of Topic 848 (ASU 2022-06, ASU 2021-01, ASU 2020-04)
The Company adopted ASU 2020-04 and ASU 2021-01 and elected to apply certain of the practical expedients related to contract modifications, hedge accounting relationships, and derivative modifications pertaining to discounting, margining, or contract price alignment. The main purpose of the practical expedients is to ease the administrative burden of accounting for contracts impacted by reference rate reform, and these elections did not have, and are not expected to have, a material impact on the consolidated financial statements. ASU 2022-06 amended and deferred the sunset date of Topic 848 from December 31, 2022 to December 31, 2024, after which the Company will no longer be permitted to apply the expedients provided in Topic 848. The Company will continue to evaluate the impact of reference rate reform on contract modifications and hedging relationships.
Fair Value Measurement — Fair Value Measurement of Equity Securities Subject to Contractual Sale Restrictions (ASU 2022-03)
In June 2022, the FASB issued clarifying guidance that a restriction which is a characteristic of the holding entity rather than a characteristic of the equity security itself should not be considered in its fair value measurement. As a result, the Company is required to measure the fair value of equity securities subject to contractual restrictions attributable to the holding entity on the basis of the market price of the same equity security without those contractual restrictions. Companies are not permitted to recognize a contractual sale restriction attributable to the holding entity as a separate unit of account. The guidance also requires disclosures for these equity securities.
139
The new guidance is mandatorily effective for the Company by January 1, 2024 with early adoption permitted. The Company will apply the guidance on a prospective basis as an adjustment to current-period earnings with the adoption impact disclosed in the period of adoption.
The Company is currently evaluating the new guidance and its impact on the consolidated financial statements.
Insurance – Targeted Improvements to the Accounting for Long-Duration Contracts (ASU 2020-11, ASU 2019-09, ASU 2018-12)
These updates amend four key areas pertaining to the accounting and disclosures for long-duration insurance and investment contracts.
•The update requires cash flow assumptions used to measure the liability for future policy benefits to be updated at least annually and no longer allows a provision for adverse deviation. The remeasurement of the liability associated with the update of assumptions is required to be recognized in net income. Loss recognition testing is eliminated for traditional and limited-payment contracts. The update also requires the discount rate used in measuring the liability to be an upper-medium grade fixed-income instrument yield, which is to be updated at each reporting date. The change in liability due to changes in the discount rate is to be recognized in OCI.
•The update simplifies the amortization of deferred acquisition costs and other balances amortized in proportion to premiums, gross profits, or gross margins, requiring such balances to be amortized on a constant level basis over the expected term of the contracts. Deferred costs are required to be written off for unexpected contract terminations but are not subject to impairment testing.
•The update requires certain contract features meeting the definition of market risk benefits to be measured at fair value. Among the features included in this definition are the guaranteed lifetime withdrawal benefit (GLWB) and guaranteed minimum death benefit (GMDB) riders attached to annuity products. The change in fair value of the market risk benefits is to be recognized in net income, excluding the portion attributable to changes in instrument-specific credit risk which is recognized in OCI.
•The update also introduces disclosure requirements around the liability for future policy benefits, policyholder account balances, market risk benefits, separate account liabilities, and deferred acquisition costs. This includes disaggregated rollforwards of these balances and information about significant inputs, judgments, assumptions and methods used in their measurement.
Significant Accounting Policies – Asset Management
Due from/to Related Parties
Due from/to related parties includes amounts due from and due to existing employees, certain former employees, portfolio companies of the funds and non-consolidated funds.
140
Deferred Revenue
Apollo records deferred revenue, which is a type of contract liability, when consideration is received in advance of management services provided. Deferred revenue is reversed and recognized as revenue over the period that the agreed upon services are performed. It is included in accounts payable, accrued expenses, and other liabilities in the consolidated statements of financial condition.
Apollo also earns management fees which are subject to an offset. When Apollo receives cash for advisory and transaction fees, a certain percentage of such advisory and/or transaction fees, as applicable, is allocated as a credit to reduce future management fees, otherwise payable by the relevant fund. Such credit is recorded as deferred revenue in the consolidated statements of financial condition within the accounts payable, accrued expenses and other liabilities line item. A portion of any excess advisory and transaction fees may be required to be returned to the limited partners of certain funds upon such fund’s liquidation. As the management fees earned by Apollo are presented on a gross basis, any management fee offsets calculated are presented as a reduction to advisory and transaction fees in the consolidated statements of operations.
Additionally, Apollo earns advisory fees pursuant to the terms of the advisory agreements with certain of the portfolio companies that are owned by the funds Apollo manages. When Apollo receives a payment from a portfolio company that exceeds the advisory fees earned at that point in time, the excess payment is recorded as deferred revenue in the consolidated statements of financial condition. The advisory agreements with the portfolio companies vary in duration and the associated fees are received monthly, quarterly, or annually.
Deferred revenue is reversed and recognized as revenue over the period that the agreed upon services are performed. There was $114 million of revenue recognized during the year ended December 31, 2022 that was previously deferred as of January 1, 2022.
Under the terms of the funds’ partnership agreements, Apollo is normally required to bear organizational expenses over a set dollar amount and placement fees or costs in connection with the offering and sale of interests in the funds it manages to investors. In cases where the limited partners of the funds are determined to be the customer in an arrangement, placement fees may be capitalized as a cost to acquire a customer contract and amortized over the life of the customer contract. Capitalized placement fees are recorded within other assets in the consolidated statements of financial condition, while amortization is recorded within general, administrative and other in the consolidated statements of operations. In certain instances, the placement fees are paid over a period of time. Based on the management agreements with the funds, Apollo considers placement fees and organizational costs paid in determining if cash has been received in excess of the management fees earned. Placement fees and organizational costs are normally the obligation of Apollo but can be paid for by the funds. When these costs are paid by the fund, the resulting obligations are included within deferred revenue. The deferred revenue balance will also be reduced during future periods when management fees are earned but not paid.
Revenues
The revenues of the asset management business include (i) management fees; (ii) advisory and transaction fees, net; (iii) investment income, which is comprised of performance allocations and principal investment income; and (iv) incentive fees.
The revenue guidance requires that an entity should recognize revenue to depict the transfer of promised goods or services to customers in an amount that reflects the consideration to which the entity expects to be entitled in exchange for those goods or services (i.e., the transaction price). When determining the transaction price under the revenue guidance, an entity may recognize variable consideration only to the extent that it is probable to not be significantly reversed. The revenue guidance also
141
Refer to disclosures below for additional information on each of the revenue streams of the asset management business.
Management Fees
Management fees are recognized over time during the periods in which the related services are performed in accordance with the contractual terms of the related agreement. Management fees are generally based on (1) a percentage of the capital committed during the commitment period, and thereafter based on the remaining invested capital of unrealized investments, or (2) net asset value, gross assets or as otherwise provided in the respective agreements. Included in management fees are certain expense reimbursements where Apollo is considered the principal under the agreements and is required to record the expense and related reimbursement revenue on a gross basis.
Advisory and Transaction Fees, Net
Advisory fees, including management consulting fees and directors’ fees, are generally recognized over time as the underlying services are provided in accordance with the contractual terms of the related agreement. Apollo receives such fees in exchange for ongoing management consulting services provided to portfolio companies of funds it manages. Transaction fees, including structuring fees and arranging fees related to Apollo’s funds, portfolio companies of funds and third parties are generally recognized at a point in time when the underlying services rendered are complete.
The amounts due from fund portfolio companies are recorded in due from related parties on the consolidated statements of financial condition. Under the terms of the limited partnership agreements for certain funds, the management fee payable by the funds may be subject to a reduction based on a certain percentage of such advisory and transaction fees, net of applicable broken deal costs. Advisory and transaction fees are reduced by these management fee offsets in the consolidated statements of operations.
Underwriting fees, which are also included within advisory and transaction fees, net, include gains, losses and fees, arising from securities offerings in which one of the Company’s subsidiaries participates in the underwriter syndicate. Underwriting fees are recognized at a point in time when the underwriting is completed. Underwriting fees recognized but not received are recorded in other assets on the consolidated statements of financial condition.
During the normal course of business, Apollo incurs certain costs related to certain transactions that are not consummated, or “broken deal costs”. These costs (e.g., research costs, due diligence costs, professional fees, legal fees and other related items) are determined to be broken deal costs upon management’s decision to no longer pursue the transaction. In accordance with the related fund agreement, in the event the deal is deemed broken, all of the costs are reimbursed by the funds and then included as a component of the calculation of the management fee offset. If a deal is successfully completed, Apollo is reimbursed by the fund or fund’s portfolio company for all costs incurred and no offset is generated. As Apollo acts as an agent for the funds it manages, any transaction costs incurred and paid by Apollo on behalf of the respective funds relating to successful or broken deals are recorded net on the Company’s consolidated statements of operations, and any receivable from the respective funds is recorded in due from related parties on the consolidated statements of financial condition.
Investment Income
Investment income is comprised of performance allocations and principal investment income.
Performance Allocations. Performance allocations are a type of performance revenue (i.e., income earned based on the extent to which an entity’s performance exceeds predetermined thresholds). Performance allocations are generally structured from a legal standpoint as an allocation of capital in which Apollo’s capital account receives allocations of the returns of an entity when those returns exceed predetermined thresholds. The determination of which performance revenues are considered performance allocations is primarily based on the terms of an agreement with the entity.
142
Apollo recognizes performance allocations within investment income along with the related principal investment income (as described further below) in the consolidated statements of operations and within the investments line in the consolidated statements of financial condition.
When applicable, Apollo may record a general partner obligation to return previously distributed performance allocations. The general partner obligation is based upon an assumed liquidation of a fund’s net assets as of the reporting date and is reported within due to related parties on the consolidated statements of financial condition. The actual determination and any required payment of any such general partner obligation would not take place until the final disposition of a fund’s investments based on the contractual termination of the fund or as otherwise set forth in the respective governing document of the fund.
Principal Investment Income. Principal investment income includes Apollo’s income or loss from equity method investments and certain other investments in entities in which Apollo is generally eligible to receive performance allocations. Income from equity method investments includes Apollo’s share of net income or loss generated from its investments, which are not consolidated, but in which it exerts significant influence.
Incentive Fees
Profit Sharing
Profit sharing expense and profit sharing payable primarily consist of a portion of performance revenues earned from certain funds that are allocated to employees and former employees. Profit sharing amounts are recognized as the related performance revenues are earned. Accordingly, profit sharing amounts can be reversed during periods when there is a decline in performance revenues that were previously recognized. Profit sharing expense is recorded in compensation and benefits for asset management in the consolidated statements of operations. Profit sharing payable is recorded in accounts payable, accrued expenses and other liabilities for Asset Management in the consolidated statements of financial condition.
Profit sharing amounts are generally not paid until the related performance revenue is distributed to the general partner upon realization of the fund’s investments. Under certain profit-sharing arrangements, Apollo requires that a portion of certain of the performance revenues distributed to its employees be used to purchase restricted common stock issued under the Equity Plan. Prior to distribution of the performance revenue, the Company records the value of the equity-based awards expected to be granted in other assets and other liabilities within the consolidated statements of financial condition. Such equity-based awards are recorded as equity-based compensation expense over the relevant service period once granted.
Additionally, profit sharing amounts previously distributed may be subject to clawback from employees and former employees. When applicable, the accrual for potential clawback of previously distributed profit sharing amounts, which is a component of due from related parties on the consolidated statements of financial condition, represents all amounts previously distributed to employees and former employees that would need to be returned to the general partner if the funds were to be liquidated based on the fair value of the underlying funds’ investments as of the reporting date. The actual general partner receivable, however, would not become realized until the final disposition of a fund’s investments based on the contractual termination of the fund or as otherwise set forth in the respective governing document of the fund.
Profit sharing payable also includes contingent consideration obligations that were recognized in connection with certain acquisitions. Changes in the fair value of the contingent consideration obligations are reflected in the consolidated statements of operations as compensation and benefits for asset management.
Apollo has performance-based incentive arrangements for certain employees designed to more closely align compensation on an annual basis with the overall realized performance of the Company’s asset management business. These arrangements enable certain employees to earn discretionary compensation based on performance revenue earned by Apollo’s asset management business in a given year, which amounts are reflected in compensation and benefits in the accompanying consolidated financial
143
Other Income (Loss)
Net Gains (Losses) from Investment Activities
Net gains (losses) from investment activities include both realized gains and losses and the change in unrealized gains and losses in Apollo’s investments, at fair value between the opening reporting date and the closing reporting date.
Net Gains (Losses) from Investment Activities of Consolidated Variable Interest Entities
Changes in the fair value of the consolidated VIEs’ assets and liabilities and related interest, dividend and other income and expenses are presented within net gains (losses) from investment activities of consolidated variable interest entities and are attributable to non-controlling interests in the consolidated statements of operations.
Other Income (Loss), Net
Significant Accounting Policies – Retirement Services
Investments
Fixed Maturity Securities
Fixed maturity securities includes bonds, CLOs, ABS, RMBS, CMBS and redeemable preferred stock. Athene classifies fixed maturity securities as AFS or trading at the time of purchase and subsequently carries them at fair value. Classification is dependent on a variety of factors, including expected holding period, election of the fair value option and asset and liability matching.
AFS Securities
AFS securities are held at fair value on the consolidated statements of financial condition with unrealized gains and losses, net of allowances for expected credit losses, tax and adjustments to DAC, DSI, and future policy benefits, if applicable, generally reflected in accumulated other comprehensive income (loss) (“AOCI”) on the consolidated statements of financial condition. Unrealized gains or losses relating to identified risks within AFS securities in fair value hedging relationships are reflected in investment related gains (losses) on the consolidated statements of operations.
Trading Securities
The fair value option is elected for certain fixed maturity securities. These fixed maturity securities are classified as trading, with changes to fair value included in investment related gains (losses) on the consolidated statements of operations. Although the securities are classified as trading, the trading activity related to these investments is primarily focused on asset and liability matching activities and is not intended to be an income strategy based on active trading. As such, the activity related to these investments on the consolidated statements of cash flows is classified as investing activities.
Transactions in trading securities are generally recorded on a trade date basis, with any unsettled trades recorded in other assets or other liabilities on the consolidated statements of financial condition. Bank loans, private placements and investment funds are recorded on settlement date basis.
144
Equity Securities
Equity securities includes common stock, mutual funds and non-redeemable preferred stock. Equity securities with readily determinable fair values are carried at fair value with subsequent changes in fair value recognized in net income. Athene has elected to account for certain equity securities without readily determinable fair values that do not qualify for the practical expedient to estimate fair values based on NAV per share (or its equivalent) at cost less impairment, subject to adjustments based on observable price changes in orderly transactions for identical or similar investments of the same issuer.
Purchased Credit Deteriorated Investments
Athene purchases certain structured securities, primarily RMBS, which upon assessment have been determined to meet the definition of PCD investments. Additionally, structured securities classified as beneficial interests follow the initial measurement guidance for PCD investments if there is a significant difference between contractual cash flows adjusted for expected prepayments and expected cash flows at the date of recognition. The initial allowance for credit losses for PCD investments is recorded through a gross-up adjustment to the initial amortized cost. For structured securities classified as beneficial interests, the initial allowance is calculated as the present value of the difference between contractual cash flows adjusted for expected prepayments and expected cash flows at the date of recognition. The non-credit purchase discount or premium is amortized into investment income using the effective interest method. The credit discount, represented by the allowance for expected credit losses, is remeasured each period following the policies for measuring credit losses described in Credit Losses – Available-for-Sale Securities section below.
Mortgage Loans
Athene elected the fair value option on its mortgage loan portfolio. Interest income is accrued on the principal amount of the loan based on its contractual interest rate. Interest is accrued on loans until it is probable it will not be received, or the loan is 90 days past due, unless guaranteed by U.S. government-sponsored agencies. Interest income and prepayment fees are reported in net investment income on the consolidated statements of operations. Changes in the fair value of the mortgage loan portfolio are reported in investment related gains (losses) on the consolidated statements of operations.
Investment Funds
Athene invests in certain non-fixed income, alternative investments in the form of limited partnerships or similar legal structures (investment funds). For investment funds in which it does not hold a controlling financial interest, Athene typically accounts for such investments using the equity method, where the cost is recorded as an investment in the fund, or it has elected the fair value option. Adjustments to the carrying amount reflect pro rata ownership percentage of the operating results as indicated by NAV in the investment fund financial statements, which can be on a lag of up to three months when investee information is not received in a timely manner.
Athene’s proportionate share of investment fund income is recorded within net investment income on the consolidated statements of operations. Contributions paid or distributions received by Athene are recorded directly to the investment fund balance as an increase to carrying value or as a return of capital, respectively.
Policy Loans
Policy loans are funds provided to policyholders in return for a claim on the policyholder’s account balance. The funds provided are limited to a specified percentage of the account balance. The majority of policy loans do not have a stated maturity and the balances and accrued interest are repaid with proceeds from the policyholder’s account balance. Policy loans are reported at the unpaid principal balance. Interest income is recorded as earned using the contract interest rate and is reported in net investment income on the consolidated statements of operations.
Funds Withheld at Interest
Funds withheld at interest represents a receivable for amounts contractually withheld by ceding companies in accordance with funds withheld coinsurance (“funds withheld”) and modified coinsurance (“modco”) reinsurance agreements in which Athene is the reinsurer. Generally, assets equal to statutory reserves are withheld and legally owned by the ceding company, and any excess or shortfall is settled periodically. The underlying agreements contain embedded derivatives as discussed below.
145
Short-term Investments
Short-term investments consist of financial instruments with maturities of greater than three months but less than twelve months when purchased. Short-term debt securities are accounted for as trading or AFS consistent with the policies for those investments. Short-term loans are carried at amortized cost.
Other Investments
Other investments includes, but is not limited to, term loans collateralized by mortgages on residential and commercial real estate and other uncollateralized loans. Athene elected the fair value option on these loans. Interest income is accrued on the principal amount of the loan based on its contractual interest rate. Interest on loans is accrued until it is probable it will not be received or the loan is 90 days past due. Interest income and prepayment and other fees are reported in net investment income on the consolidated statements of operations. Changes in fair value are reported in investment related gains (losses) on the consolidated statements of operations.
Credit Losses – Available-for-Sale Securities
AFS securities with a fair value that has declined below amortized cost are evaluated to determine how the decline in fair value should be recognized. If based on the facts and circumstances related to the specific security, Athene intends to sell a security or it is more likely than not that it would be required to sell a security before the recovery of its amortized cost, any existing allowance for expected credit losses is reversed and the amortized cost of the security is written down to fair value. If neither of these conditions exist, the decline in fair value is evaluated to determine whether it has resulted from a credit loss or other factors.
For non-structured AFS securities, relevant facts and circumstances are qualitatively considered in evaluating whether a decline below fair value is credit-related. Relevant facts and circumstances include but are not limited to: (1) the extent to which the fair value is less than amortized cost; (2) changes in agency credit ratings, (3) adverse conditions related to the security’s industry or geographical area, (4) failure to make scheduled payments, and (5) other known changes in the financial condition of the issuer or quality of any underlying collateral or credit enhancements. For structured AFS securities meeting the definition of beneficial interests, the qualitative assessment is bypassed, and any securities having experienced a decline in fair value below amortized cost move directly to a quantitative analysis.
If upon completion of this analysis it is determined that a potential credit loss exists, an allowance for expected credit losses is established equal to the amount by which the present value of expected cash flows is less than amortized cost, limited by the amount by which fair value is less than amortized cost. A non-structured security’s cash flow estimates are derived from scenario-based outcomes of expected corporate restructurings or the disposition of assets using security-specific facts and circumstances, including timing, security interests and loss severity. A structured security’s cash flow estimates are based on security-specific facts and circumstances that may include collateral characteristics, expectations of delinquency and default rates, loss severity, prepayments and structural support, including subordination and guarantees. The expected cash flows are discounted at the effective interest rate implicit to the security at the date of purchase or the current yield to accrete a structured security. For securities with a contractual interest rate that varies based on changes in an independent factor, such as an index or rate, the effective interest rate is calculated based on the factor as it changes over the life of the security. Inherently under the discounted cash flow model, both the timing and amount of expected cash flows affect the measurement of the allowance for expected credit losses.
The allowance for expected credit losses is remeasured each period for the passage of time, any change in expected cash flows, and changes in the fair value of the security. All impairments, whether intent or requirement to sell or credit-related, are recorded through a charge to the provision for credit losses within investment related gains (losses) on the consolidated
146
statements of operations. All changes in the allowance for expected credit losses are recorded through the provision for credit losses within investment related gains (losses) on the consolidated statements of operations.
The Company has elected to present accrued interest receivable separately in other assets on the consolidated balance sheets. It has also elected the practical expedient to exclude the accrued interest receivable from the amortized cost balance used to calculate the allowance for expected credit losses, as it has a policy to write off such balances in a timely manner, when they become 90 days past due. Any write-off of accrued interest is recorded through a reversal of net investment income on the consolidated statements of operations.
Derivative Instruments
Athene invests in derivatives to hedge the risks experienced from ongoing operations, such as equity, interest rate and cash flow risks, or for other risk management purposes, which primarily involve managing liability risks associated with indexed annuity products and reinsurance agreements. Derivatives are financial instruments with values that are derived from interest rates, foreign exchange rates, financial indices or other combinations of an underlying and notional. Derivative assets and liabilities are carried at fair value on the consolidated statements of financial condition. The Company elects to present any derivatives subject to master netting provisions as a gross asset or liability and gross of collateral. It may designate derivatives as cash flow, fair value or net investment hedges.
Hedge Documentation and Hedge Effectiveness
To qualify for hedge accounting, at the inception of the hedging relationship, Athene formally documents its designation of the hedge as a cash flow, fair value or net investment hedge and risk management objective and strategy for undertaking the hedging transaction. This documentation identifies how the hedging instrument is expected to hedge the designated risks related to the hedged item and the method that will be used to retrospectively and prospectively assess the hedge effectiveness and the method which will be used to measure ineffectiveness. A derivative designated as a hedging instrument must be assessed as being highly effective in offsetting the designated risk of the hedged item. Hedge effectiveness is formally assessed at inception and periodically throughout the life of the hedge accounting relationship.
For a cash flow hedge, all changes in the fair value of the hedging derivative are reported within AOCI and the related gains or losses on the derivative are reclassified into the consolidated statements of operations when the cash flows of the hedged item affect earnings.
For a fair value hedge, changes in the fair value of the hedging derivative and changes in the fair value of the hedged item related to the designated risk being hedged are reported on the consolidated statements of operations according to the nature of the risk being hedged. Additionally, changes in the fair value of amounts excluded from the assessment of effectiveness are recorded in AOCI and amortized into income over the life of the hedge accounting relationship.
For a net investment hedge, changes in the fair value of the hedging derivative are reported within AOCI to offset the translation adjustments for subsidiaries with functional currencies other than U.S. dollar.
Athene discontinues hedge accounting prospectively when: (1) it determines the derivative is no longer highly effective in offsetting changes in the estimated cash flows or fair value of a hedged item; (2) the derivative expires, is sold, terminated, or exercised; or (3) the derivative is de-designated as a hedging instrument. When hedge accounting is discontinued, the derivative continues to be carried on the consolidated statements of financial condition at fair value, with changes in fair value recognized in investment related gains (losses) on the consolidated statements of operations.
147
Embedded Derivatives
Athene issues and reinsures products, primarily indexed annuity products, or purchases investments that contain embedded derivatives. If it determines the embedded derivative has economic characteristics not clearly and closely related to the economic characteristics of the host contract, and a separate instrument with the same terms would qualify as a derivative instrument, the embedded derivative is bifurcated from the host contract and accounted for separately, unless the fair value option is elected on the host contract. Under the fair value option, bifurcation of the embedded derivative is not necessary as the entire contract is carried at fair value with all related gains and losses recognized in investment related gains (losses) on the consolidated statements of operations. Embedded derivatives are carried on the consolidated statements of financial condition at fair value in the same line item as the host contract.
Fixed indexed annuity, index-linked variable annuity and indexed universal life insurance contracts allow the policyholder to elect a fixed interest rate return or an equity market component for which interest credited is based on the performance of certain equity market indices. The equity market option is an embedded derivative. The benefit reserve is equal to the sum of the fair value of the embedded derivative and the host (or guaranteed) component of the contracts. The fair value of the embedded derivatives represents the present value of cash flows attributable to the indexed strategies. The embedded derivative cash flows are based on assumptions for future policy growth, which include assumptions for expected index credits on the next policy anniversary date, future equity option costs, volatility, interest rates and policyholder behavior assumptions, including lapses and the use of benefit riders. The embedded derivative cash flows are discounted using a rate that reflects Athene’s own credit rating. The host contract is established at contract inception as the initial account value less the initial fair value of the embedded derivative and accreted over the policy’s life. Contracts acquired through a business combination which contain an embedded derivative are re-bifurcated as of the acquisition date. Changes in the fair value of embedded derivatives associated with fixed indexed annuities, index-linked variable annuities and indexed universal life insurance contracts are included in interest sensitive contract benefits on the consolidated statements of operations.
Reinsurance
Athene assumes and cedes insurance and investment contracts under coinsurance, funds withheld and modco. Reinsurance accounting is applied for transactions that provide indemnification against loss or liability relating to insurance risk (risk transfer). To meet risk transfer requirements, a reinsurance agreement must transfer insurance risk arising from uncertainties about both underwriting and timing risks. Cessions under reinsurance do not discharge obligations as the primary insurer, unless the requirements of assumption reinsurance have been met. Athene generally has the right of offset on reinsurance transactions, but has elected to present reinsurance settlement amounts due to and from Athene on a gross basis.
Assets and liabilities assumed or ceded under coinsurance, funds withheld, or modco are presented gross on the consolidated statements of financial condition. For investment contracts, the change in assumed and ceded reserves are presented net in interest sensitive contract benefits on the consolidated statements of operations. For insurance contracts, the change in assumed and ceded reserves and benefits are presented net in future policy and other policy benefits on the consolidated statements of operations. Assumed or ceded premiums are included in premiums on the consolidated statements of operations.
Accounting for reinsurance requires the use of assumptions, particularly related to the future performance of the underlying business and the potential impact of counterparty credit risks. Athene attempts to minimize counterparty credit risk through the structuring of the terms of its reinsurance agreements, including the use of trusts, and it monitors credit ratings of counterparties for signs of declining credit quality. When a ceding company does not report information on a timely basis, accruals are recorded based on the best available information at the time, which includes the reinsurance agreement terms and historical
148
Deferred Acquisition Costs, Deferred Sales Inducements and Value of Business Acquired
Deferred Acquisition Costs and Deferred Sales Inducements
Costs related directly to the successful acquisition of new, or renewal of, insurance or investment contracts are deferred to the extent they are recoverable from future premiums or gross profits. These costs consist of commissions and policy issuance costs, as well as sales inducements credited to policyholder account balances, and are included in deferred acquisition costs, deferred sales inducements and value of business acquired on the consolidated statements of financial condition. Athene performs periodic tests, including at issuance, to determine if the deferred costs are recoverable. If it determines that the deferred costs are not recoverable, a cumulative charge is recorded to the current period.
Value of Business Acquired
Athene establishes VOBA for blocks of insurance contracts acquired through the acquisition of insurance entities. It records the fair value of the liabilities assumed in two components: reserves and VOBA. Reserves are established using Athene’s best estimate assumptions, plus a provision for adverse deviation where applicable, as of the business combination date. VOBA is the difference between the fair value of the liabilities and the reserves. VOBA can be either positive or negative. Any negative VOBA is recorded to the same financial statement line on the consolidated statements of financial condition as the associated reserves. Positive VOBA is recorded in deferred acquisition costs, deferred sales inducements and value of business acquired on the consolidated statements of financial condition. Athene performs periodic tests to determine if the VOBA remains recoverable. If it determines that VOBA is not recoverable, a cumulative charge is recorded to the current period.
VOBA and negative VOBA are amortized in relation to applicable policyholder liabilities. Significant assumptions that impact VOBA and negative VOBA amortization are consistent with those that impact the measurement of policyholder liabilities.
149
Interest Sensitive Contract Liabilities
Universal life-type policies and investment contracts include fixed indexed and traditional fixed annuities in the accumulation phase, funding agreements, universal life insurance, fixed indexed universal life insurance and immediate annuities without significant mortality risk (which includes pension group annuities without life contingencies). Athene carries liabilities for fixed annuities, universal life insurance and funding agreements at the account balances without reduction for potential surrender or withdrawal charges, except for a block of universal life business ceded to Global Atlantic Financial Group Limited (together with its subsidiaries, “Global Atlantic”) which it carries at fair value. Liabilities for immediate annuities without significant mortality risk are calculated as the present value of future liability cash flows and policy maintenance expenses discounted at contractual interest rates. For a discussion regarding indexed products, refer above to the embedded derivative discussion.
Future Policy Benefits
Athene issues contracts classified as long-duration, which includes term and whole life, accident and health, disability, and deferred and immediate annuities with life contingencies (which includes pension group annuities with life contingencies). Liabilities for non-participating long-duration contracts are established using accepted actuarial valuation methods which require the use of assumptions related to expenses, investment yields, mortality, morbidity and persistency, with a provision for adverse deviation, at the date of issue or acquisition. As of December 31, 2022, the reserve investment yield assumptions for non-participating contracts range from 2.3 % to 6.6 % and are specific to Athene’s expected earned rate on the asset portfolio supporting the reserves. Athene bases other key assumptions, such as mortality and morbidity, on industry standard data adjusted to align with actual company experience, if necessary.
For long-duration contracts, the assumptions are locked in at contract inception and only modified if Athene deems the reserves to be inadequate. Athene periodically reviews actual and anticipated experience compared to the assumptions used to establish policy benefits. If the net U.S. GAAP liability (gross reserves less DAC, DSI and VOBA) is less than the gross premium liability, impairment is deemed to have occurred, and the DAC, DSI and VOBA asset balances are reduced until the net U.S. GAAP liability is equal to the gross premium liability. If the DAC, DSI and VOBA asset balances are completely written off and the net U.S. GAAP liability is still less than the gross premium liability, then an additional liability is recorded to arrive at the gross premium liability.
Athene issues and reinsures deferred annuity contracts which contain GLWB and GMDB riders. Future policy benefits for GLWB and GMDB riders are established by estimating the expected value of withdrawal and death benefits in excess of the projected policyholder account balances. The excess is recognized proportionally over the accumulation period based on total actual and expected assessments. The methods used to estimate the liabilities have assumptions about policyholder behavior, which includes lapses, withdrawals and utilization of benefit riders; mortality, expected yield on investments supporting the liability; and market conditions affecting the account balance growth.
Future policy benefits includes liabilities for no-lapse guarantees on universal life insurance and fixed indexed universal life insurance. Athene establishes future policy benefits for no-lapse guarantees by estimating the expected value of death benefits paid after policyholder account balances have been exhausted. Athene recognizes these benefits proportionally over the life of the contracts based on total actual and expected assessments. The methods Athene uses to estimate the liabilities have assumptions about policyholder behavior, mortality, expected yield on investments supporting the liability, and market conditions affecting policyholder account balance growth.
For the liabilities associated with GLWB and GMDB riders and no-lapse guarantees, each reporting period, expected excess benefits and assessments are updated with actual excess benefits and assessments and liability balances are adjusted due to the OCI effects of unrealized investment gains and losses on AFS securities. The key assumptions used in the calculation of the liabilities are also periodically revised which results in revisions to the expected excess benefits and assessments. The effects of changes in assumptions are recorded as unlocking in the period in which the changes are made.
Changes in future policy benefits other than the adjustment for the OCI effects of unrealized investment gains and losses on AFS securities, are recorded in future policy and other policy benefits on the consolidated statements of operations. Future
150
Revenues
Revenues for universal life-type policies and investment contracts, including surrender and market value adjustments, costs of insurance, policy administration, GMDB, GLWB and no-lapse guarantee charges, are earned when assessed against policyholder account balances during the period. Interest credited to policyholder account balances and the change in fair value of embedded derivatives within fixed indexed annuity contracts is included in interest sensitive contract benefits on the consolidated statements of operations.
Premiums for long-duration contracts, including products with fixed and guaranteed premiums and benefits, are recognized as revenue when due from policyholders. When premiums are due over a significantly shorter period than the period over which benefits are provided, such as immediate annuities with life contingencies (which includes pension group annuities), a deferred profit liability is established equal to the excess of the gross premium over the net premium. The deferred profit liability is recognized in future policy benefits on the consolidated statements of financial condition and amortized into income in relation to applicable policyholder liabilities through future policy and other policy benefits on the consolidated statements of operations.
3. Merger with Athene
On January 1, 2022, Apollo and Athene completed the previously announced merger transactions pursuant to the Merger Agreement. As a result of the Mergers, AAM and AHL became subsidiaries of AGM.
Under the Merger Agreement, each issued and outstanding Athene common share was converted automatically into 1.149 shares of common stock of AGM and any cash paid in lieu of fractional shares. The purchase price was as follows:
| (In millions, except share price data and exchange ratio) | |||||
| AHL common shares purchased | |||||
| Exchange ratio | |||||
| Shares of common stock issued in exchange | |||||
| AGM Class A shares closing price | $ | ||||
| Total merger consideration at closing | $ | ||||
Fair value of estimated RSUs, options and warrants assumed and other equity consideration1,2
|
|||||
Effective settlement of pre-existing relationships3
|
|||||
| Total merger consideration | |||||
Fair value of AHL common shares previously held ( |
|||||
| Total AHL equity value held by AGM | |||||
Non-controlling interest6
|
|||||
| Total AHL equity value | $ | ||||
1 AGM issued one-time grants of fully vested RSUs and options to certain executives and shareholders of Athene vesting upon consummation of the Mergers. Additionally, all issued and outstanding warrants of Athene prior to the Merger Date were exchanged for shares of AGM common stock at the time of the Mergers. The fair value of these awards is $ | |||||
2 AGM issued replacement awards for all outstanding Athene equity awards. $ | |||||
3 The pre-existing relationship related to receivables, payables, and dividends between Apollo and Athene. Total fees payable to AGM by Athene for asset management and advisory services were approximately $ | |||||
4 Based on the December 31, 2021 closing price of AHL common shares on the NYSE.
| |||||
5 Other adjustments includes pushdown of goodwill arising out of deferred tax liabilities associated with identifiable net assets of Athene.
| |||||
6 Non-controlling interest in Athene includes holders of Athene’s preferred shares and third-party investors in ACRA and in consolidated VIEs of Athene. The fair value of Athene’s preferred shares was based on the closing stock price of Athene’s preferred shares immediately prior to the consummation of the Athene merger and the fair value of the non-controlling interest in ACRA was determined using the discounted distribution model approach.
| |||||
151
The Mergers were accounted for as a business combination. The consideration was allocated to Athene's assets acquired and liabilities assumed based on estimates of their fair values as of the Merger Date. The business combination was achieved in steps. The Company previously held its equity interests in the acquiree at fair value.
Goodwill of $4.1 billion was recorded based on the amount that the Athene equity value exceeded the fair value of the net assets acquired less the amounts attributable to non-controlling interests. Goodwill is primarily attributable to the scale, skill sets, operations, and synergies that can be achieved subsequent to the Mergers. The goodwill recorded is not expected to be deductible for tax purposes. Goodwill on the consolidated statements of financial position includes the impacts of foreign currency translation.
The financial statements were not retrospectively adjusted for the changes to the provisional values of assets acquired and liabilities assumed that occurred in subsequent periods. Adjustments were recognized as information related to the preliminary fair value calculation was obtained. The effect on earnings of changes in depreciation, amortization, or other income effects, as a result of changes to the provisional amounts, were recorded in the same period as the financial statements, calculated as if the accounting had been completed at the Merger Date.
The following table summarizes the fair value amounts recognized for the assets acquired and liabilities assumed and resulting goodwill as of the Merger Date:
| (In millions) | Fair Value and Goodwill Calculation | ||||
| Merger consideration | $ | ||||
| Fair value of previously held equity interest | |||||
| Total Athene Value to be Held by the Company | |||||
| Total Value to Allocate | |||||
| Investments | |||||
| Cash and cash equivalents | |||||
| Restricted cash and cash equivalents | |||||
| Investment in related parties | |||||
| Reinsurance recoverable | |||||
| VOBA | |||||
| Assets of consolidated variable interest entities | |||||
| Other assets | |||||
| Estimated fair value of total assets acquired (excluding goodwill) | |||||
| Interest sensitive contract liabilities | |||||
| Future policy benefits | |||||
| Debt | |||||
| Payables for collateral on derivatives and securities to repurchase | |||||
| Liabilities of consolidated variable interest entities | |||||
| Other liabilities | |||||
| Estimated fair value of total liabilities assumed | |||||
| Non-controlling interest | |||||
| Estimated fair value of net assets acquired, excluding goodwill | |||||
| Goodwill attributable to Athene | $ | ||||
During the fourth quarter of 2022, the Company finalized purchase accounting. During the year ended December 31, 2022, the Company recorded adjustments which decreased provisional goodwill by $108 million. The adjustments were comprised of $25 million for measurement period adjustments and $83 million to adjust the valuation of an investment. The measurement period adjustments were primarily related to decreases in interest sensitive contract liabilities and future policy benefits and the effects to the consolidated statements of operations were immaterial to those periods.
The Company performed a valuation of the acquired investments, policy liabilities, VOBA, other identifiable intangibles, and funds withheld at interest payables and receivables using methodologies consistent with those described in note 2 and note 7.
152
Value of business acquired and Other identifiable intangible assets
VOBA represents the difference between the fair value of liabilities acquired and reserves established using best estimate assumptions at the Merger Date. Other identifiable intangible assets are included in other assets on the consolidated statements of financial condition and summarized as follow:
| Distribution Channels | Trade Name | Insurance Licenses | ||||||||||||
| These assets are valued using the excess earnings method, which derives value based on the present value of the cash flow attributable to the distribution channels, less returns for contributory assets. | This represents the Athene trade name and was valued using the relief-from-royalty method considering publicly available third-party trade name royalty rates as well as expected premiums generated by the use of the trade name over its anticipated life. | Licenses are protected through registration and were valued using the market approach based on third-party market transactions from which the prices paid for state insurance licenses could be derived. | ||||||||||||
The fair value and weighted average estimated useful lives of VOBA and other identifiable intangible assets acquired in the Mergers consist of the following:
|
Fair value
(in millions)
|
Average useful life
(in years)
|
||||||||||
| VOBA Asset | $ | ||||||||||
| Distribution Channels | |||||||||||
| Trade Name | |||||||||||
| State Insurance Licenses | Indefinite | ||||||||||
| Total | $ | ||||||||||
As of the Merger Date, Athene's financial results are reflected in these consolidated financial statements. Athene's revenues of $8,199 million and net income (loss) of $(3,418 ) million are included in the consolidated statement of operations for the year ended December 31, 2022.
Pro Forma Financial Information
Unaudited pro forma financial information for the year ended December 31, 2021 is presented below. Pro forma financial information presented does not include adjustments to reflect any potential revenue synergies or cost savings that may be achievable in connection with the Mergers and assume the Mergers occurred as of January 1, 2021. The unaudited pro forma financial information is presented for informational purposes only and is not necessarily indicative of future operations or results had the Mergers been completed as of January 1, 2021.
| (In millions) | Year ended December 31, 2021 | ||||
| Total Revenues | $ | ||||
| Net income attributable to Apollo | |||||
Amounts above reflect certain pro forma adjustments that were directly attributable to the Mergers. These adjustments include the following:
•the elimination of historical amortization of Athene’s intangibles and the additional amortization of intangibles measured at fair value as of the Merger Date; and
•the prospective adjustments to the book value of AFS securities and the fair value of mortgage loans, which will be amortized into income based on the expected life of the investments.
153
4. Investments
The following table outlines the Company’s investments:
| (In millions) | December 31, 2022 | December 31, 2021 | |||||||||
| Asset Management | |||||||||||
| Investments, at fair value | $ | $ | |||||||||
| Equity method investments | |||||||||||
| Performance allocations | |||||||||||
| U.S. Treasury securities, at fair value | |||||||||||
Total Investments – Asset Management |
|||||||||||
Retirement Services |
|||||||||||
| AFS securities, at fair value | $ | $ | |||||||||
| Trading securities, at fair value | |||||||||||
| Equity securities | |||||||||||
| Mortgage loans, at fair value | |||||||||||
| Investment funds | |||||||||||
| Policy loans | |||||||||||
| Funds withheld at interest | |||||||||||
| Short-term investments | |||||||||||
| Other investments | |||||||||||
Total Investments, including related parties – Retirement Services |
|||||||||||
| Total Investments | $ | $ | |||||||||
Equity Method Investments — Overall
The tables below present summarized financial information of the Company’s equity method investments in the aggregate:
Statement of Financial Condition (In millions)
|
December 31, | ||||||||||
2022 1
|
2021 1
|
||||||||||
| Investments | $ | $ | |||||||||
| Assets | |||||||||||
| Liabilities | |||||||||||
| Equity | |||||||||||
Statement of Operations (In millions)
|
Years ended December 31, | ||||||||||||||||
2022 1
|
2021 1
|
2020 1
|
|||||||||||||||
| Revenues/Investment Income | $ | $ | $ | ||||||||||||||
| Expenses | |||||||||||||||||
| Net Investment Income (Loss) | |||||||||||||||||
| Net Realized and Unrealized Gain (Loss) | |||||||||||||||||
| Net Income (Loss) | $ | $ | $ | ||||||||||||||
1 Certain fund amounts are as of and for the twelve months ended September 30, 2022, 2021 and 2020.
| |||||||||||||||||
154
Asset Management
Net Gains (Losses) from Investment Activities
The following outlines realized and net change in unrealized gains (losses) reported in net gains (losses) from investment activities:
| Years ended December 31, | |||||||||||||||||
| (In millions) | 2022 | 2021 | 2020 | ||||||||||||||
| Realized gains (losses) on sales of investments, net | $ | ( |
$ | $ | |||||||||||||
| Net change in unrealized gains (losses) due to changes in fair value | ( |
||||||||||||||||
| Net gains (losses) from investment activities | $ | $ | $ | ( |
|||||||||||||
Performance Allocations
Performance allocations receivable is recorded within investments in the consolidated statements of financial condition. The table below provides a roll forward of the performance allocations balance:
| (In millions) | Total | ||||
Performance allocations, January 1, 2021 |
$ | ||||
| Change in fair value of funds | |||||
| Fund distributions to the Company | ( |
||||
Performance allocations, December 31, 2021 |
$ | ||||
| Change in fair value of funds | |||||
| Fund distributions to the Company | ( |
||||
Performance allocations, December 31, 2022 |
$ | ||||
The change in fair value of funds excludes the general partner obligation to return previously distributed performance allocations, which is recorded in due to related parties in the consolidated statements of financial condition.
The timing of the payment of performance allocations due to the general partner or investment manager varies depending on the terms of the applicable fund agreements. Generally, performance allocations with respect to the private equity funds and certain credit and real assets funds are payable and are distributed to the fund’s general partner upon realization of an investment if the fund’s cumulative returns are in excess of the preferred return.
155
Retirement Services
AFS Securities
The following table represents the amortized cost, allowance for credit losses, gross unrealized gains and losses and fair value of Athene’s AFS investments by asset type:
| December 31, 2022 | |||||||||||||||||||||||||||||
| (In millions) | Amortized Cost | Allowance for Credit Losses | Gross Unrealized Gains | Gross Unrealized Losses | Fair Value | ||||||||||||||||||||||||
| AFS securities | |||||||||||||||||||||||||||||
| U.S. government and agencies | $ | $ | $ | $ | ( |
$ | |||||||||||||||||||||||
| U.S. state, municipal and political subdivisions | ( |
||||||||||||||||||||||||||||
| Foreign governments | ( |
( |
|||||||||||||||||||||||||||
| Corporate | ( |
( |
|||||||||||||||||||||||||||
| CLO | ( |
( |
|||||||||||||||||||||||||||
| ABS | ( |
( |
|||||||||||||||||||||||||||
| CMBS | ( |
( |
|||||||||||||||||||||||||||
| RMBS | ( |
( |
|||||||||||||||||||||||||||
| Total AFS securities | ( |
( |
|||||||||||||||||||||||||||
| AFS securities – related parties | |||||||||||||||||||||||||||||
| Corporate | ( |
||||||||||||||||||||||||||||
| CLO | ( |
( |
|||||||||||||||||||||||||||
| ABS | ( |
||||||||||||||||||||||||||||
| Total AFS securities – related parties | ( |
( |
|||||||||||||||||||||||||||
| Total AFS securities, including related parties | $ | $ | ( |
$ | $ | ( |
$ | ||||||||||||||||||||||
The amortized cost and fair value of AFS securities, including related parties, are shown by contractual maturity below:
| December 31, 2022 | |||||||||||
| (In millions) | Amortized Cost | Fair Value | |||||||||
| AFS securities | |||||||||||
| Due in one year or less | $ | $ | |||||||||
| Due after one year through five years | |||||||||||
| Due after five years through ten years | |||||||||||
| Due after ten years | |||||||||||
| CLO, ABS, CMBS and RMBS | |||||||||||
| Total AFS securities | |||||||||||
| AFS securities – related parties | |||||||||||
| Due in one year or less | |||||||||||
| Due after one year through five years | |||||||||||
| Due after five years through ten years | |||||||||||
| Due after ten years | |||||||||||
| CLO and ABS | |||||||||||
| Total AFS securities – related parties | |||||||||||
| Total AFS securities, including related parties | $ | $ | |||||||||
Actual maturities can differ from contractual maturities as borrowers may have the right to call or prepay obligations with or without call or prepayment penalties.
156
Unrealized Losses on AFS Securities
The following summarizes the fair value and gross unrealized losses for AFS securities, including related parties, for which an allowance for credit losses has not been recorded, aggregated by asset type and length of time the fair value has remained below amortized cost:
| December 31, 2022 | |||||||||||||||||||||||||||||||||||
| Less than 12 months | 12 months or more | Total | |||||||||||||||||||||||||||||||||
| (In millions) | Fair Value | Gross Unrealized Losses | Fair Value | Gross Unrealized Losses | Fair Value | Gross Unrealized Losses | |||||||||||||||||||||||||||||
| AFS securities | |||||||||||||||||||||||||||||||||||
| U.S. government and agencies | $ | $ | ( |
$ | $ | $ | $ | ( |
|||||||||||||||||||||||||||
| U.S. state, municipal and political subdivisions | ( |
( |
|||||||||||||||||||||||||||||||||
| Foreign governments | ( |
( |
|||||||||||||||||||||||||||||||||
| Corporate | ( |
( |
|||||||||||||||||||||||||||||||||
| CLO | ( |
( |
|||||||||||||||||||||||||||||||||
| ABS | ( |
( |
|||||||||||||||||||||||||||||||||
| CMBS | ( |
( |
|||||||||||||||||||||||||||||||||
| RMBS | ( |
( |
|||||||||||||||||||||||||||||||||
| Total AFS securities | ( |
( |
|||||||||||||||||||||||||||||||||
| AFS securities – related parties | |||||||||||||||||||||||||||||||||||
| Corporate | ( |
( |
|||||||||||||||||||||||||||||||||
| CLO | ( |
( |
|||||||||||||||||||||||||||||||||
| ABS | ( |
( |
|||||||||||||||||||||||||||||||||
| Total AFS securities – related parties | ( |
( |
|||||||||||||||||||||||||||||||||
| Total AFS securities, including related parties | $ | $ | ( |
$ | $ | $ | $ | ( |
|||||||||||||||||||||||||||
The following summarizes the number of AFS securities that were in an unrealized loss position, including related parties, for which an allowance for credit losses has not been recorded:
| December 31, 2022 | |||||||||||
| Unrealized Loss Position | Unrealized Loss Position 12 Months or More | ||||||||||
| AFS securities | |||||||||||
| AFS securities – related parties | |||||||||||
The unrealized losses on AFS securities can primarily be attributed to changes in market interest rates since acquisition. Athene did not recognize the unrealized losses in income, unless as required for hedge accounting, as it intends to hold these securities and it is not more likely than not it will be required to sell a security before the recovery of its amortized cost.
157
Allowance for Credit Losses
The following table summarizes the activity in the allowance for credit losses for AFS securities by asset type:
| Year ended December 31, 2022 | |||||||||||||||||||||||||||||||||||||||||
| Additions | Reductions | ||||||||||||||||||||||||||||||||||||||||
| (In millions) |
Beginning balance1
|
Initial credit losses | Initial credit losses on PCD securities | Securities sold during the period | Securities intended to be sold prior to recovery of amortized cost basis | Additions (reductions) to previously impaired securities | Ending Balance | ||||||||||||||||||||||||||||||||||
| AFS securities | |||||||||||||||||||||||||||||||||||||||||
| Foreign governments | $ | $ | $ | $ | ( |
$ | $ | ( |
$ | ||||||||||||||||||||||||||||||||
| Corporate | ( |
( |
|||||||||||||||||||||||||||||||||||||||
| CLO | ( |
||||||||||||||||||||||||||||||||||||||||
| ABS | ( |
( |
|||||||||||||||||||||||||||||||||||||||
| CMBS | ( |
||||||||||||||||||||||||||||||||||||||||
| RMBS | ( |
||||||||||||||||||||||||||||||||||||||||
| Total AFS securities | ( |
( |
( |
||||||||||||||||||||||||||||||||||||||
| AFS securities – related parties | |||||||||||||||||||||||||||||||||||||||||
| CLO | ( |
||||||||||||||||||||||||||||||||||||||||
| ABS | ( |
||||||||||||||||||||||||||||||||||||||||
| Total AFS securities – related parties | ( |
||||||||||||||||||||||||||||||||||||||||
| Total AFS securities, including related parties | $ | $ | $ | $ | ( |
$ | ( |
$ | ( |
$ | |||||||||||||||||||||||||||||||
1 Beginning balance reflects allowances established at the time of the Mergers under purchase accounting for PCD investments.
| |||||||||||||||||||||||||||||||||||||||||
Net Investment Income
Net investment income by asset class consists of the following:
| (In millions) | Year ended December 31, 2022 | ||||
| AFS securities | $ | ||||
| Trading securities | |||||
| Equity securities | |||||
| Mortgage loans | |||||
| Investment funds | |||||
| Funds withheld at interest | |||||
| Other | |||||
| Investment revenue | |||||
| Investment expenses | ( |
||||
| Net investment income | $ | ||||
158
Investment Related Gains (Losses)
Investment related gains (losses) by asset class consists of the following:
| (In millions) | Year ended December 31, 2022 | ||||
| AFS securities | |||||
| Gross realized gains on investment activity | $ | ||||
| Gross realized losses on investment activity | ( |
||||
| Net realized investment losses on AFS securities | ( |
||||
| Net recognized investment losses on trading securities | ( |
||||
| Net recognized investment losses on equity securities | ( |
||||
| Net recognized investment losses on mortgage loans | ( |
||||
| ( |
|||||
| Provision for credit losses | ( |
||||
| Other gains | |||||
| Investment related gains (losses) | $ | ( |
|||
Proceeds from sales of AFS securities were $9,421 million for the year ended December 31, 2022.
The following table summarizes the change in unrealized gains (losses) on trading and equity securities held as of the respective period end:
| (In millions) | Year ended December 31, 2022 | ||||
| Trading securities | $ | ( |
|||
| Trading securities – related parties | |||||
| Equity securities | ( |
||||
| Equity securities – related parties | |||||
Repurchase Agreements
The following table summarizes the maturities of repurchase agreements:
| December 31, 2022 | |||||||||||||||||||||||||||||||||||
| Remaining Contractual Maturity | |||||||||||||||||||||||||||||||||||
| (In millions) | Overnight and continuous | Less than 30 days | 30-90 days | 91 days to 1 year | Greater than 1 year | Total | |||||||||||||||||||||||||||||
Payables for repurchase agreements1
|
$ | $ | $ | $ | $ | $ | |||||||||||||||||||||||||||||
1 Included in payables for collateral on derivatives and securities to repurchase on the consolidated statements of financial condition.
| |||||||||||||||||||||||||||||||||||
The following table summarizes the securities pledged as collateral for repurchase agreements:
| December 31, 2022 | |||||||||||
| (In millions) | Amortized Cost | Fair Value | |||||||||
| AFS securities | |||||||||||
| U.S. government and agencies | $ | $ | |||||||||
| Foreign governments | |||||||||||
| Corporate | |||||||||||
| CLO | |||||||||||
| ABS | |||||||||||
| Total securities pledged under repurchase agreements | $ | $ | |||||||||
159
Reverse Repurchase Agreements
As of December 31, 2022, amounts loaned under reverse repurchase agreements were $1,640 million, and the fair value of the collateral, comprised primarily of commercial and residential mortgage loans, was $1,753 million.
Mortgage Loans, including related parties and VIEs
Mortgage loans includes both commercial and residential loans. Athene has elected the fair value option on its mortgage loan portfolio. See note 7 for further fair value option information. The following represents the mortgage loan portfolio, with fair value option loans presented at unpaid principal balance:
| (In millions) | December 31, 2022 | ||||
| Commercial mortgage loans | $ | ||||
| Commercial mortgage loans under development | |||||
| Total commercial mortgage loans | |||||
| Mark to fair value | ( |
||||
| Commercial mortgage loans | |||||
| Residential mortgage loans | |||||
| Mark to fair value | ( |
||||
| Residential mortgage loans | |||||
| Mortgage loans | $ | ||||
Athene primarily invests in commercial mortgage loans on income producing properties, including office and retail buildings, apartments, hotels, and industrial properties. Athene diversifies the commercial mortgage loan portfolio by geographic region and property type to reduce concentration risk. Athene evaluates mortgage loans based on relevant current information to confirm if properties are performing at a consistent and acceptable level to secure the related debt.
160
The distribution of commercial mortgage loans, including those under development, by property type and geographic region is as follows:
| December 31, 2022 | |||||||||||
| (In millions, except percentages) | Net Carrying Value | Percentage of Total | |||||||||
| Property type | |||||||||||
| Office building | $ | % | |||||||||
| Retail | % | ||||||||||
| Apartment | % | ||||||||||
| Hotels | % | ||||||||||
| Industrial | % | ||||||||||
| Other commercial | % | ||||||||||
| Total commercial mortgage loans | $ | % | |||||||||
| U.S. Region | |||||||||||
| East North Central | $ | % | |||||||||
| East South Central | % | ||||||||||
| Middle Atlantic | % | ||||||||||
| Mountain | % | ||||||||||
| New England | % | ||||||||||
| Pacific | % | ||||||||||
| South Atlantic | % | ||||||||||
| West North Central | % | ||||||||||
| West South Central | % | ||||||||||
| Total U.S. Region | % | ||||||||||
| International Region | |||||||||||
| United Kingdom | % | ||||||||||
International Other1
|
% | ||||||||||
| Total International Region | % | ||||||||||
| Total commercial mortgage loans | $ | % | |||||||||
1 Represents all other countries, with each individual country comprising less than 5% of the portfolio.
| |||||||||||
Athene’s residential mortgage loan portfolio includes first lien residential mortgage loans collateralized by properties in various geographic locations and is summarized by proportion of the portfolio in the following table:
| December 31, 2022 | |||||
| U.S. States | |||||
| California | % | ||||
| Florida | % | ||||
| New York | % | ||||
| New Jersey | % | ||||
| Arizona | % | ||||
Other1
|
% | ||||
| Total U.S. residential mortgage loan percentage | % | ||||
| International | |||||
| United Kingdom | % | ||||
| Ireland | % | ||||
Other2
|
% | ||||
| Total international residential mortgage loan percentage | % | ||||
| Total residential mortgage loan percentage | % | ||||
1 Represents all other states, with each individual state comprising less than 5% of the portfolio.
| |||||
2 Represents all other countries, with each individual country comprising less than 5% of the portfolio.
| |||||
161
Investment Funds
Athene’s investment fund portfolio consists of funds that employ various strategies and include investments in origination platforms, insurance platforms, and equity, hybrid, yield and other funds. Investment funds can meet the definition of VIEs. The investment funds do not specify timing of distributions on the funds’ underlying assets.
The following summarizes Athene’s investment funds, including related parties and consolidated VIEs:
| December 31, 2022 | |||||||||||
| (In millions, except percentages) | Carrying value | Percent of total | |||||||||
| Investment funds | |||||||||||
| Equity funds | $ | % | |||||||||
| Hybrid funds | % | ||||||||||
| Other | % | ||||||||||
| Total investment funds | % | ||||||||||
| Investment funds – related parties | |||||||||||
| Strategic origination platforms | % | ||||||||||
| Strategic insurance platforms | % | ||||||||||
| Apollo and other fund investments | |||||||||||
| Equity funds | % | ||||||||||
| Yield funds | % | ||||||||||
| Other | % | ||||||||||
| Total investment funds – related parties | % | ||||||||||
| Investment funds – consolidated VIEs | |||||||||||
| Strategic origination platforms | % | ||||||||||
| Strategic insurance platforms | % | ||||||||||
| Apollo and other fund investments | |||||||||||
| Equity funds | % | ||||||||||
| Hybrid funds | % | ||||||||||
| Yield funds | % | ||||||||||
| Other | % | ||||||||||
| Total investment funds – consolidated VIEs | % | ||||||||||
| Total investment funds, including related parties and consolidated VIEs | $ | ||||||||||
162
Concentrations—The following table represents Athene’s investment concentrations. The evaluation for concentration is based on 10% of stockholders’ equity; however, the Company is providing the top 30 investments due to the size of Athene’s investment portfolio in comparison to the Company’s stockholders’ equity as of December 31, 2022.
| (In millions) | December 31, 2022 | ||||
Wheels Donlen1
|
$ | ||||
Athora1
|
|||||
PK AirFinance1
|
|||||
| AP Tundra | |||||
| MFI Investments | |||||
| SoftBank Vision Fund II | |||||
| MidCap | |||||
| Cayman Universe | |||||
| Concord Music CL A2 | |||||
| Redding Ridge | |||||
| AOP Finance | |||||
| Bank of America | |||||
| AA Infrastructure | |||||
| Morgan Stanley | |||||
Venerable1
|
|||||
AP Maia2
|
|||||
Apollo Rose2
|
|||||
| Citigroup | |||||
AP Hansel2
|
|||||
| JPMorgan Chase | |||||
| AT&T Inc. | |||||
| Comcast | |||||
| FWD Group | |||||
| Verizon | |||||
| MidCap Funding Franchise | |||||
| Mileage Plus | |||||
| Goldman Sachs | |||||
| Athene Wessex Investor A, L.P. | |||||
| Energy Transfer | |||||
| HWIRE | |||||
1 Related party amounts are representative of single issuer risk and may only include a portion of the total investments associated with a related party. See further discussion of these related parties in note 17.
| |||||
2 Represents a consolidated VIE investment in which an underlying investment includes a single issuer exceeding concentration threshold.
| |||||
163
5. Derivatives
The Company uses a variety of derivative instruments to manage risks, primarily equity, interest rate, credit, foreign currency and market volatility. See note 7 for information about the fair value hierarchy for derivatives.
The following table presents the notional amount and fair value of derivative instruments:
| December 31, 2022 | |||||||||||||||||
| Notional Amount | Fair Value | ||||||||||||||||
| (In millions) | Assets | Liabilities | |||||||||||||||
| Derivatives designated as hedges | |||||||||||||||||
| Foreign currency hedges | |||||||||||||||||
| Swaps | $ | $ | |||||||||||||||
| Forwards | |||||||||||||||||
| Interest rate swaps | |||||||||||||||||
| Forwards on net investments | |||||||||||||||||
| Interest rate swaps | |||||||||||||||||
| Total derivatives designated as hedges | |||||||||||||||||
| Derivatives not designated as hedges | |||||||||||||||||
| Equity options | |||||||||||||||||
| Futures | |||||||||||||||||
| Foreign currency swaps | |||||||||||||||||
| Interest rate swaps | |||||||||||||||||
| Other swaps | |||||||||||||||||
| Foreign currency forwards | |||||||||||||||||
| Embedded derivatives | |||||||||||||||||
| Funds withheld, including related parties | ( |
( |
|||||||||||||||
| Interest sensitive contract liabilities | |||||||||||||||||
| Total derivatives not designated as hedges | ( |
||||||||||||||||
| $ | ( |
$ | |||||||||||||||
Derivatives Designated as Hedges
Cash Flow Hedges
Athene uses interest rate swaps to convert floating-rate interest payments to fixed-rate interest payments to reduce exposure to interest rate changes. The interest rate swaps will expire by July 2027. During the year ended December 31, 2022, Athene recognized losses of $106 million in other comprehensive income (loss) associated with these hedges. There were no amounts deemed ineffective during the year ended December 31, 2022. As of December 31, 2022, no amounts are expected to be reclassified to income within the next 12 months.
Fair Value Hedges
Athene uses foreign currency forward contracts, foreign currency interest rates swaps, and interest rate swaps that are designated and accounted for as fair value hedges to hedge certain exposures to foreign currency risk and interest rate risk. The foreign currency forward price is agreed upon at the time of the contract and payment is made at a specified future date.
164
The following represents the carrying amount and the cumulative fair value hedging adjustments included in the hedged assets or liabilities:
| December 31, 2022 | |||||||||||
| (In millions) |
Carrying amount of the hedged assets or liabilities1
|
Cumulative amount of fair value hedging gains (losses) | |||||||||
| AFS securities | |||||||||||
| Foreign currency forwards | $ | $ | ( |
||||||||
| Foreign currency swaps | ( |
||||||||||
| Interest sensitive contract liabilities | |||||||||||
| Foreign currency swaps | |||||||||||
| Foreign currency interest rate swaps | |||||||||||
| Interest rate swaps | |||||||||||
1 The carrying amount disclosed for AFS securities is amortized cost.
| |||||||||||
The following is a summary of the gains (losses) related to the derivatives and related hedged items in fair value hedge relationships:
| Amount Excluded | |||||||||||||||||||||||||||||
| (In millions) | Derivatives | Hedged Items | Net | Recognized in income through amortization approach | Recognized in income through changes in fair value | ||||||||||||||||||||||||
| Year ended December 31, 2022 | |||||||||||||||||||||||||||||
| Investment related gains (losses) | |||||||||||||||||||||||||||||
| Foreign currency forwards | $ | $ | ( |
$ | ( |
$ | $ | ||||||||||||||||||||||
| Foreign currency swaps | ( |
( |
|||||||||||||||||||||||||||
| Foreign currency interest rate swaps | ( |
||||||||||||||||||||||||||||
| Interest rate swaps | ( |
( |
|||||||||||||||||||||||||||
| Interest sensitive contract benefits | |||||||||||||||||||||||||||||
| Foreign currency interest rate swaps | ( |
( |
|||||||||||||||||||||||||||
The following is a summary of the gains (losses) excluded from the assessment of hedge effectiveness that were recognized in OCI:
| (In millions) | Year ended December 31, 2022 | ||||
| Foreign currency forwards | $ | ||||
| Foreign currency swaps | |||||
Net Investment Hedges
Athene uses foreign currency forwards to hedge the foreign currency exchange rate risk of its investments in subsidiaries that have a reporting currency other than the U.S. dollar. Hedge effectiveness is assessed based on the changes in forward rates. During the year ended December 31, 2022, these derivatives had gains of $30 million. These derivatives are included in foreign currency translation and other adjustments on the consolidated statements of comprehensive income (loss). As of December 31, 2022, the cumulative foreign currency translations recorded in AOCI related to these net investment hedges were gains of $30 million. During the year ended December 31, 2022, there were no amounts deemed ineffective.
165
Derivatives Not Designated as Hedges
Equity options
Athene uses equity indexed options to economically hedge fixed indexed annuity products that guarantee the return of principal to the policyholder and credit interest based on a percentage of the gain in a specified market index, primarily the S&P 500. To hedge against adverse changes in equity indices, Athene enters into contracts to buy equity indexed options. The contracts are net settled in cash based on differentials in the indices at the time of exercise and the strike price.
Futures
Athene purchases futures contracts to hedge the growth in interest credited to the customer as a direct result of increases in the related indices. Athene enters into exchange-traded futures with regulated futures commission clearing brokers who are members of a trading exchange. Under exchange-traded futures contracts, Athene agrees to purchase a specified number of contracts with other parties and to post variation margin on a daily basis in an amount equal to the difference in the daily fair values of those contracts.
Interest rate swaps
Athene uses interest rate swaps to reduce market risks from interest rate changes and to alter interest rate exposure arising from duration mismatches between assets and liabilities. With an interest rate swap, Athene agrees with another party to exchange the difference between fixed-rate and floating-rate interest amounts tied to an agreed upon notional principal amount at specified intervals.
Other swaps
Other swaps include total return swaps and credit default swaps. Athene purchases total rate of return swaps to gain exposure and benefit from a reference asset or index without ownership. Total rate of return swaps are contracts in which one party makes payments based on a set rate, either fixed or variable, while the other party makes payments based on the return of the underlying asset or index, which includes both the income it generates and any capital gains.
Credit default swaps provide a measure of protection against the default of an issuer or allow the Company to gain credit exposure to an issuer or traded index. Athene uses credit default swaps coupled with a bond to synthetically create the characteristics of a reference bond. These transactions have a lower cost and are generally more liquid relative to the cash market. Athene receives a periodic premium for these transactions as compensation for accepting credit risk.
Hedging credit risk involves buying protection for existing credit risk. The exposure resulting from the agreements, which is usually the notional amount, is equal to the maximum proceeds that must be paid by a counterparty for a defaulted security. If a credit event occurs on a reference entity, then a counterparty who sold protection is required to pay the buyer the trade notional amount less any recovery value of the security.
Embedded derivatives
Athene has embedded derivatives which are required to be separated from their host contracts and reported as derivatives. Host contracts include reinsurance agreements structured on modco or funds withheld basis and indexed annuity products.
166
The following is a summary of the gains (losses) related to derivatives not designated as hedges:
| (In millions) | Year ended December 31, 2022 | ||||
| Equity options | $ | ( |
|||
| Futures | ( |
||||
| Swaps | |||||
| Foreign currency forwards | |||||
| Embedded derivatives on funds withheld | ( |
||||
| Amounts recognized in investment related gains (losses) | ( |
||||
Embedded derivatives in indexed annuity products1
|
|||||
| Total gains (losses) on derivatives not designated as hedges | $ | ( |
|||
1 Included in interest sensitive contract benefits on the consolidated statements of operations.
|
|||||
Credit Risk
The Company may be exposed to credit-related losses in the event of counterparty nonperformance on derivative financial instruments. Generally, the current credit exposure of Athene’s derivative contracts is the fair value at the reporting date less any collateral received from the counterparty.
Athene manages credit risk related to over-the-counter derivatives by entering into transactions with creditworthy counterparties. Where possible, Athene maintains collateral arrangements and uses master netting agreements that provide for a single net payment from one counterparty to another at each due date and upon termination. Athene has also established counterparty exposure limits, where possible, in order to evaluate if there is sufficient collateral to support the net exposure.
Collateral arrangements typically require the posting of collateral in connection with its derivative instruments. Collateral agreements often contain posting thresholds, some of which may vary depending on the posting party’s financial strength ratings. Additionally, a decrease in Athene’s financial strength rating to a specified level can result in settlement of the derivative position.
The estimated fair value of net derivative and other financial assets and liabilities after the application of master netting agreements and collateral were as follows:
Gross amounts not offset on the consolidated statements of financial condition |
|||||||||||||||||||||||||||||||||||
| (In millions) |
Gross amount recognized1
|
Financial instruments2
|
Collateral (received)/pledged | Net amount |
Off-balance sheet securities collateral3
|
Net amount after securities collateral | |||||||||||||||||||||||||||||
| December 31, 2022 | |||||||||||||||||||||||||||||||||||
| Derivative assets | $ | $ | ( |
$ | ( |
$ | ( |
$ | $ | ( |
|||||||||||||||||||||||||
| Derivative liabilities | ( |
||||||||||||||||||||||||||||||||||
1 The gross amounts of recognized derivative assets and derivative liabilities are reported on the consolidated statements of financial condition. As of December 31, 2022, amounts not subject to master netting or similar agreements were immaterial.
| |||||||||||||||||||||||||||||||||||
2 Represents amounts offsetting derivative assets and derivative liabilities that are subject to an enforceable master netting agreement or similar agreement that are not netted against the gross derivative assets or gross derivative liabilities for presentation on the consolidated statements of financial condition.
| |||||||||||||||||||||||||||||||||||
3 For non-cash collateral received, the Company does not recognize the collateral on the consolidated statement of financial condition unless the obligor (transferor) has defaulted under the terms of the secured contract and is no longer entitled to redeem the pledged asset. Amounts do not include any excess of collateral pledged or received.
| |||||||||||||||||||||||||||||||||||
6. Variable Interest Entities
A variable interest in a VIE is an investment or other interest that will absorb portions of the VIE’s expected losses and/or receive expected residual returns. Refer to note 2 for more details about the Company’s VIE assessment and consolidation policy. Variable interests in consolidated VIEs and unconsolidated VIEs are discussed separately below.
167
Consolidated VIEs
Consolidated VIEs include consolidated SPACs as well as certain CLOs and funds managed by the Company. The financial information for these consolidated SPACs are disclosed in note 17.
The assets of consolidated VIEs are not available to creditors of the Company, and the investors in these consolidated VIEs have no recourse against the assets of the Company. Similarly, there is no recourse to the Company for the consolidated VIEs’ liabilities.
Other assets of the consolidated funds include interest receivables, receivables from affiliates and reverse repurchase agreements. Other liabilities include debt held at amortized cost, short-term payables and repurchase agreements.
Each series of notes in a respective consolidated VIE participates in distributions from the VIE, including principal and interest from underlying investments. Amounts allocated to the noteholders reflect amounts that would be distributed if the VIE’s affairs were wound up and its assets sold for cash equal to their respective carrying values, its liabilities satisfied in accordance with their terms, and all the remaining amounts distributed to the noteholders. The respective VIEs that issue the notes payable are marked at their prevailing net asset value, which approximates fair value.
Results from certain funds managed by Apollo are reported on a three-month lag based upon the availability of financial information.
Net Gains from Investment Activities of Consolidated Variable Interest Entities—Asset Management
The following table presents net gains from investment activities of the consolidated VIEs:
| Years ended December 31, | |||||||||||||||||
| (In millions) |
20221
|
20211
|
20201
|
||||||||||||||
| Net gains (losses) from investment activities | $ | $ | $ | ( |
|||||||||||||
| Net gains (losses) from debt | |||||||||||||||||
| Interest and other income | |||||||||||||||||
| Interest and other expenses | ( |
( |
( |
||||||||||||||
| Net gains (losses) from investment activities of consolidated variable interest entities | $ | $ | $ | ||||||||||||||
1 Amounts reflect consolidation eliminations
|
|||||||||||||||||
168
Senior Secured Notes, Subordinated Notes, Subscription Lines and Secured Borrowings
Included within debt, at fair value, notes payable, and other liabilities are amounts due to third-party institutions by the consolidated VIEs. The following table summarizes the principal provisions of those amounts:
| December 31, 2022 | December 31, 2021 | ||||||||||||||||||||||||||||||||||
| (In millions, except percentages) | Principal Outstanding | Weighted Average Interest Rate | Weighted Average Remaining Maturity in Years | Principal Outstanding | Weighted Average Interest Rate | Weighted Average Remaining Maturity in Years | |||||||||||||||||||||||||||||
| Asset Management | |||||||||||||||||||||||||||||||||||
Senior secured notes2
|
$ | N/A | N/A | $ | % | ||||||||||||||||||||||||||||||
Subordinated notes2
|
N/A | N/A | N/A | 1 |
|||||||||||||||||||||||||||||||
Subscription lines2
|
% | N/A | N/A | ||||||||||||||||||||||||||||||||
Secured borrowings2,3
|
N/A | N/A | % | ||||||||||||||||||||||||||||||||
Total – Asset Management |
$ | $ | |||||||||||||||||||||||||||||||||
1 The principal outstanding balance of the subordinated notes do not have contractual interest rates but instead receive distributions from the excess cash flows of the VIEs.
| |||||||||||||||||||||||||||||||||||
2 The notes, subscription lines and borrowings of the consolidated VIEs are collateralized by assets held by each respective vehicle and assets of one vehicle may not be used to satisfy the liabilities of another vehicle.
| |||||||||||||||||||||||||||||||||||
3 As of December 31, 2022, there was no principal outstanding for secured borrowings. As of December 31, 2021, secured borrowings consist of consolidated VIEs’ obligations through a repurchase agreement redeemable at maturity with third party lenders. The fair value of the secured borrowings as of December 31, 2021 approximates principal outstanding due to the short-term nature of the borrowings. These secured borrowings are classified as a Level 3 liability within the fair value hierarchy.
| |||||||||||||||||||||||||||||||||||
The consolidated VIEs’ debt obligations contain various customary loan covenants. As of December 31, 2022, the Company was not aware of any instances of non-compliance with any of these covenants.
Repurchase Agreements
The following table summarizes the maturities of repurchase agreements:
| December 31, 2022 | |||||||||||||||||||||||||||||||||||
| Remaining Contractual Maturity | |||||||||||||||||||||||||||||||||||
| (In millions) | Overnight and continuous | Less than 30 days | 30-90 days | 91 days to 364 days | 1 year and greater | Total | |||||||||||||||||||||||||||||
Payables for repurchase agreements1
|
$ | $ | $ | $ | $ | $ | |||||||||||||||||||||||||||||
1 Included in other liabilities of consolidated variable interest entities on the consolidated statements of financial condition.
| |||||||||||||||||||||||||||||||||||
The following table summarizes the gross carrying value of repurchase agreements by class of collateral pledged:
| December 31, 2022 | |||||
| (In millions) | |||||
| Loans backed by residential real estate | $ | ||||
| Loans backed by commercial real estate | |||||
| Total | $ | ||||
| Note: These repurchase agreements are carried at cost which approximates fair value and is classified as Level 2 of the fair value hierarchy. | |||||
Reverse Repurchase Agreements
As of December 31, 2022, fair value of collateral received under reverse repurchase agreements was $1,522 million and fair value of collateral rehypothecated was $1,522 million.
169
Revenues of Consolidated Variable Interest Entities—Retirement Services
The following summarizes the statements of operations activity of the consolidated VIEs:
| (In millions) | Year ended December 31, 2022 | ||||
| Trading securities | $ | ||||
| Mortgage loans | |||||
| Investment funds | |||||
| Other | ( |
||||
| Net investment income | |||||
| Trading securities | ( |
||||
| Net recognized investment losses on mortgage loans | ( |
||||
| Investment funds | |||||
| Other gains (losses) | |||||
| Investment related gains (losses) | |||||
| Revenues of consolidated variable interest entities | $ | ||||
Unconsolidated Variable Interest Entities—Asset Management
The following table presents the maximum exposure to losses relating to these VIEs for which Apollo has concluded that it holds a significant variable interest, but that it is not the primary beneficiary.
| (In millions) | December 31, 2022 | 2 |
December 31, 2021 | 2 |
||||||||||
Maximum Loss Exposure1
|
$ | $ | ||||||||||||
1 Represents Apollo’s direct investment in those entities in which it holds a significant variable interest and certain other investments. Additionally, cumulative performance allocations are subject to reversal in the event of future losses.
|
||||||||||||||
2 Some amounts included are a quarter in arrears.
|
||||||||||||||
Unconsolidated Variable Interest Entities—Retirement Services
The Company has variable interests in certain unconsolidated VIEs in the form of securities and ownership stakes in investment funds.
Fixed maturity securities
Athene invests in securitization entities as a debt holder or an investor in the residual interest of the securitization vehicle. These entities are deemed VIEs due to insufficient equity within the structure and lack of control by the equity investors over the activities that significantly impact the economics of the entity. In general, Athene is a debt investor within these entities and, as such, holds a variable interest; however, due to the debt holders’ lack of ability to control the decisions within the trust that significantly impact the entity, and the fact the debt holders are protected from losses due to the subordination of the equity tranche, the debt holders are not deemed the primary beneficiary. Securitization vehicles in which Athene holds the residual tranche are not consolidated because Athene does not unilaterally have substantive rights to remove the general partner, or when assessing related party interests, Athene is not under common control, as defined by U.S. GAAP, with the related parties, nor are substantially all of the activities conducted on Athene’s behalf; therefore, Athene is not deemed the primary beneficiary. Debt investments and investments in the residual tranche of securitization entities are considered debt instruments and are held at fair value on the consolidated statements of financial condition and classified as AFS or trading.
Investment funds
Investment funds include non-fixed income, alternative investments in the form of limited partnerships or similar legal structures.
170
Equity securities
Athene invests in preferred equity securities issued by entities deemed to be VIEs due to insufficient equity within the structure.
Athene’s risk of loss associated with its non-consolidated investments depends on the investment. Investment funds, equity securities and trading securities are limited to the carrying value plus unfunded commitments. AFS securities are limited to amortized cost plus unfunded commitments.
The following summarizes the carrying value and maximum loss exposure of these non-consolidated investments:
| December 31, 2022 | |||||||||||
| (In millions) | Carrying Value | Maximum Loss Exposure | |||||||||
| Investment funds | $ | $ | |||||||||
| Investment in related parties – investment funds | |||||||||||
| Assets of consolidated VIEs – investment funds | |||||||||||
| Investment in fixed maturity securities | |||||||||||
| Investment in related parties – fixed maturity securities | |||||||||||
| Investment in related parties – equity securities | |||||||||||
| Total non-consolidated investments | $ | $ | |||||||||
171
7. Fair Value
Fair Value Measurements of Financial Instruments
The following summarize the Company’s financial assets and liabilities recorded at fair value hierarchy level:
| December 31, 2022 | |||||||||||||||||||||||||||||
| (In millions) | Level 1 | Level 2 | Level 3 | NAV | Total | ||||||||||||||||||||||||
| Assets | |||||||||||||||||||||||||||||
Asset Management |
|||||||||||||||||||||||||||||
Cash and cash equivalents1
|
$ | $ | $ | $ | — | $ | |||||||||||||||||||||||
Restricted cash and cash equivalents2
|
— | ||||||||||||||||||||||||||||
| Cash and cash equivalents of VIEs | — | ||||||||||||||||||||||||||||
U.S. Treasury securities3
|
— | ||||||||||||||||||||||||||||
| Investments, at fair value | 4 |
||||||||||||||||||||||||||||
| Investments of VIEs | |||||||||||||||||||||||||||||
Due from related parties5
|
— | ||||||||||||||||||||||||||||
Derivative assets6
|
— | ||||||||||||||||||||||||||||
Total Assets – Asset Management |
|||||||||||||||||||||||||||||
Retirement Services |
|||||||||||||||||||||||||||||
| AFS Securities | |||||||||||||||||||||||||||||
| U.S. government and agencies | — | ||||||||||||||||||||||||||||
| U.S. state, municipal and political subdivisions | — | ||||||||||||||||||||||||||||
| Foreign governments | — | ||||||||||||||||||||||||||||
| Corporate | — | ||||||||||||||||||||||||||||
| CLO | — | ||||||||||||||||||||||||||||
| ABS | — | ||||||||||||||||||||||||||||
| CMBS | — | ||||||||||||||||||||||||||||
| RMBS | — | ||||||||||||||||||||||||||||
| Total AFS securities | — | ||||||||||||||||||||||||||||
| Trading securities | — | ||||||||||||||||||||||||||||
| Equity securities | — | ||||||||||||||||||||||||||||
| Mortgage loans | — | ||||||||||||||||||||||||||||
| Funds withheld at interest – embedded derivative | ( |
— | ( |
||||||||||||||||||||||||||
| Derivative assets | — | ||||||||||||||||||||||||||||
| Short-term investments | — | ||||||||||||||||||||||||||||
| Other investments | — | ||||||||||||||||||||||||||||
| Cash and cash equivalents | — | ||||||||||||||||||||||||||||
| Restricted cash and cash equivalents | — | ||||||||||||||||||||||||||||
| Investments in related parties | |||||||||||||||||||||||||||||
| AFS securities | |||||||||||||||||||||||||||||
| Corporate | — | ||||||||||||||||||||||||||||
| CLO | — | ||||||||||||||||||||||||||||
| ABS | — | ||||||||||||||||||||||||||||
| Total AFS securities – related parties | — | ||||||||||||||||||||||||||||
| Trading securities | — | ||||||||||||||||||||||||||||
| Equity securities | — | ||||||||||||||||||||||||||||
| Mortgage loans | — | ||||||||||||||||||||||||||||
| Investment funds | — | ||||||||||||||||||||||||||||
| Funds withheld at interest – embedded derivative | ( |
— | ( |
||||||||||||||||||||||||||
| Other investments | — | ||||||||||||||||||||||||||||
| Reinsurance recoverable | — | ||||||||||||||||||||||||||||
172
| December 31, 2022 | |||||||||||||||||||||||||||||
| (In millions) | Level 1 | Level 2 | Level 3 | NAV | Total | ||||||||||||||||||||||||
| Assets of consolidated VIEs | |||||||||||||||||||||||||||||
| Trading securities | — | ||||||||||||||||||||||||||||
| Mortgage loans | — | ||||||||||||||||||||||||||||
| Investment funds | |||||||||||||||||||||||||||||
| Other investments | — | ||||||||||||||||||||||||||||
| Cash and cash equivalents | — | ||||||||||||||||||||||||||||
Total Assets – Retirement Services |
|||||||||||||||||||||||||||||
| Total Assets | $ | $ | $ | $ | $ | ||||||||||||||||||||||||
| Liabilities | |||||||||||||||||||||||||||||
Asset Management |
|||||||||||||||||||||||||||||
Contingent consideration obligations7
|
$ | $ | $ | $ | — | $ | |||||||||||||||||||||||
Other liabilities8
|
— | ||||||||||||||||||||||||||||
Derivative liabilities6
|
— | ||||||||||||||||||||||||||||
Total Liabilities – Asset Management |
— | ||||||||||||||||||||||||||||
Retirement Services |
|||||||||||||||||||||||||||||
| Interest sensitive contract liabilities | |||||||||||||||||||||||||||||
| Embedded derivative | — | ||||||||||||||||||||||||||||
| Universal life benefits | — | ||||||||||||||||||||||||||||
| Future policy benefits | |||||||||||||||||||||||||||||
| AmerUs closed block | — | ||||||||||||||||||||||||||||
| ILICO closed block and life benefits | — | ||||||||||||||||||||||||||||
| Derivative liabilities | — | ||||||||||||||||||||||||||||
| Other liabilities | ( |
— | |||||||||||||||||||||||||||
Total Liabilities – Retirement Services |
— | ||||||||||||||||||||||||||||
| Total Liabilities | $ | $ | $ | $ | — | $ | |||||||||||||||||||||||
| (Concluded) | |||||||||||||||||||||||||||||
173
| December 31, 2021 | |||||||||||||||||||||||||||||
| (In millions) | Level 1 | Level 2 | Level 3 | NAV | Total | ||||||||||||||||||||||||
Assets – Asset Management |
|||||||||||||||||||||||||||||
Cash and cash equivalents1
|
$ | $ | $ | $ | — | $ | |||||||||||||||||||||||
Restricted cash and cash equivalents2
|
— | ||||||||||||||||||||||||||||
| Cash and cash equivalents of VIEs | — | ||||||||||||||||||||||||||||
U.S. Treasury securities3
|
— | ||||||||||||||||||||||||||||
| Investment in Athene Holding | — | ||||||||||||||||||||||||||||
| Other investments | 4 |
— | |||||||||||||||||||||||||||
| Investments of VIEs | |||||||||||||||||||||||||||||
Due from related parties5
|
— | ||||||||||||||||||||||||||||
Derivative assets6
|
— | ||||||||||||||||||||||||||||
| Total Assets | $ | $ | $ | $ | $ | ||||||||||||||||||||||||
Liabilities – Asset Management |
|||||||||||||||||||||||||||||
| Debt of VIEs, at fair value | $ | $ | $ | $ | — | $ | |||||||||||||||||||||||
| Other liabilities of VIEs, at fair value | |||||||||||||||||||||||||||||
Contingent consideration obligations7
|
— | ||||||||||||||||||||||||||||
Other liabilities8
|
— | ||||||||||||||||||||||||||||
Derivative liabilities6
|
— | ||||||||||||||||||||||||||||
| Total Liabilities | $ | $ | $ | $ | $ | ||||||||||||||||||||||||
1 Cash and cash equivalents as of December 31, 2021 includes $ | |||||||||||||||||||||||||||||
2 Restricted cash and cash equivalents as of December 31, 2022 and December 31, 2021 includes $ | |||||||||||||||||||||||||||||
3 U.S. Treasury securities as of December 31, 2021 includes $ | |||||||||||||||||||||||||||||
4 Investments as of December 31, 2022 and December 31, 2021 excludes $ | |||||||||||||||||||||||||||||
5 Due from related parties represents a receivable from a fund.
| |||||||||||||||||||||||||||||
6 Derivative assets and derivative liabilities are presented as a component of Other assets and Other liabilities, respectively, in the consolidated statements of financial condition.
| |||||||||||||||||||||||||||||
7 As of December 31, 2022, other liabilities includes $ | |||||||||||||||||||||||||||||
8 Other liabilities as of December 31, 2022 includes the publicly traded warrants of APSG II. Other liabilities as of December 31, 2021 includes the publicly traded warrants of APSG I and APSG II.
| |||||||||||||||||||||||||||||
Changes in fair value of contingent consideration obligations in connection with the acquisitions of Stone Tower and Griffin Capital are recorded in compensation and benefits expense and other income (loss), net, respectively, in the consolidated statements of operations. Refer to note 18 for further details.
174
Level 3 Financial Instruments
The following tables summarize the valuation techniques and quantitative inputs and assumptions used for financial assets and liabilities categorized as Level 3:
| December 31, 2022 | ||||||||||||||||||||||||||||||||
|
Fair Value
(In millions)
|
Valuation Technique | Unobservable Inputs | Ranges | Weighted Average | ||||||||||||||||||||||||||||
| Financial Assets | ||||||||||||||||||||||||||||||||
| Asset Management | ||||||||||||||||||||||||||||||||
| Investments | $ | Embedded value | N/A | N/A | N/A | |||||||||||||||||||||||||||
| Discounted cash flow | Discount rate | 8.9% – 52.8% | 1 |
|||||||||||||||||||||||||||||
| Adjusted transaction value | N/A | N/A | N/A | |||||||||||||||||||||||||||||
| Due from related parties | Discounted cash flow | Discount rate | ||||||||||||||||||||||||||||||
| Derivative assets | Option model | Volatility rate | ||||||||||||||||||||||||||||||
| Investments of consolidated VIEs | ||||||||||||||||||||||||||||||||
| Equity securities | Dividend discount model | Discount rate | ||||||||||||||||||||||||||||||
| Bank loans | Discounted cash flow | Discount rate | 6.4% – 32.7% | 1 |
||||||||||||||||||||||||||||
| Adjusted transaction value | N/A | N/A | N/A | |||||||||||||||||||||||||||||
| Bonds | Discounted cash flow | Discount rate | ||||||||||||||||||||||||||||||
| Retirement Services | ||||||||||||||||||||||||||||||||
| AFS, trading and equity securities | Discounted cash flow | Discount rate | 1 |
|||||||||||||||||||||||||||||
Mortgage loans2
|
Discounted cash flow | Discount rate | 1 |
|||||||||||||||||||||||||||||
Investment funds2
|
Discounted cash flow | Discount rate | ||||||||||||||||||||||||||||||
| Discounted cash flow / Guideline public equity |
Discount rate / P/E |
|||||||||||||||||||||||||||||||
| Net tangible asset values | Implied multiple | 1.26x |
1.26x | |||||||||||||||||||||||||||||
| Reported net asset value | Reported net asset value | N/A | N/A | |||||||||||||||||||||||||||||
| Embedded value | N/A | N/A | N/A | |||||||||||||||||||||||||||||
| Financial Liabilities | ||||||||||||||||||||||||||||||||
| Asset Management | ||||||||||||||||||||||||||||||||
| Contingent consideration obligation | Discounted cash flow | Discount rate | 20.0% – 25.0% | 1 |
||||||||||||||||||||||||||||
| Option model | Volatility rate | 29.8% – 39.6% | 1 |
|||||||||||||||||||||||||||||
| Retirement Services | ||||||||||||||||||||||||||||||||
| Interest sensitive contract liabilities – fixed indexed annuities embedded derivatives | Discounted cash flow | Nonperformance risk | 3 |
|||||||||||||||||||||||||||||
| Option budget | 4 |
|||||||||||||||||||||||||||||||
| Surrender rate | 5 |
|||||||||||||||||||||||||||||||
1 Unobservable inputs were weighted based on the fair value of the investments included in the range.
| ||||||||||||||||||||||||||||||||
2 Includes those of consolidated VIEs.
| ||||||||||||||||||||||||||||||||
3 The nonperformance risk weighted average is based on the projected excess benefits of reserves used in the calculation of the embedded derivative.
| ||||||||||||||||||||||||||||||||
4 The option budget weighted average is calculated based on the indexed account values.
| ||||||||||||||||||||||||||||||||
5 The surrender rate weighted average is calculated based on projected account values.
| ||||||||||||||||||||||||||||||||
175
| December 31, 2021 | ||||||||||||||||||||||||||
|
Fair Value
(In millions)
|
Valuation Techniques | Unobservable Inputs | Ranges |
Weighted Average1
|
||||||||||||||||||||||
| Financial Assets | ||||||||||||||||||||||||||
| Other investments | $ | Embedded value | N/A | N/A | N/A | |||||||||||||||||||||
| Discounted cash flow | Discount rate | 14.0% - 52.8% | ||||||||||||||||||||||||
| Adjusted transaction value | N/A | N/A | N/A | |||||||||||||||||||||||
| Due from related parties | Discounted cash flow | Discount rate | ||||||||||||||||||||||||
| Investments of consolidated VIEs: | ||||||||||||||||||||||||||
| Equity securities | Discounted cash flow | Discount rate | 3.0% - 19.0% | |||||||||||||||||||||||
| Dividend discount model | Discount rate | |||||||||||||||||||||||||
| Market comparable companies | NTAV multiple | 1.25x | 1.25x | |||||||||||||||||||||||
| Adjusted transaction value | Purchase multiple | 1.25x | 1.25x | |||||||||||||||||||||||
| Adjusted transaction value | N/A | N/A | N/A | |||||||||||||||||||||||
| Bank loans | Discounted cash flow | Discount rate | 1.8% - 15.6% | |||||||||||||||||||||||
| Adjusted transaction value | N/A | N/A | N/A | |||||||||||||||||||||||
| Profit participating notes | Discounted cash flow | Discount rate | 8.7% - 12.5% | |||||||||||||||||||||||
| Adjusted transaction value | N/A | N/A | N/A | |||||||||||||||||||||||
| Real estate | Discounted cash flow | Capitalization rate | 4.0% - 5.8% | |||||||||||||||||||||||
| Discounted cash flow | Discount rate | 5.0% - 12.5% | ||||||||||||||||||||||||
| Discounted cash flow | Terminal capitalization rate | |||||||||||||||||||||||||
| Direct capitalization | Capitalization rate | 5.5% - 8.5% | ||||||||||||||||||||||||
| Direct capitalization | Terminal capitalization rate | 6.0% - 12.0% | ||||||||||||||||||||||||
| Bonds | Discounted cash flow | Discount rate | 4.0% - 7.0% | |||||||||||||||||||||||
| Third party pricing | N/A | N/A | N/A | |||||||||||||||||||||||
| Other equity investments | Discounted cash flow | Discount rate | 11.8% -12.5% | |||||||||||||||||||||||
| Adjusted transaction value | N/A | N/A | N/A | |||||||||||||||||||||||
| Financial Liabilities | ||||||||||||||||||||||||||
| Liabilities of Consolidated VIEs: | ||||||||||||||||||||||||||
| Secured loans | Discounted cash flow | Discount rate | 1.4% - 10.0% | |||||||||||||||||||||||
| Subordinated notes | Discounted cash flow | Discount rate | 4.5% - 11.9% | |||||||||||||||||||||||
| Participating equity | Discounted cash flow | Discount rate | ||||||||||||||||||||||||
| Other liabilities | Discounted cash flow | Discount rate | 3.7% - 9.3% | |||||||||||||||||||||||
| Contingent consideration obligation | Discounted cash flow | Discount rate | ||||||||||||||||||||||||
1 Unobservable inputs were weighted based on the fair value of the investments included in the range.
| ||||||||||||||||||||||||||
The following are reconciliations for Level 3 assets and liabilities measured at fair value on a recurring basis:
| Year ended December 31, 2022 | |||||||||||||||||||||||||||||||||||||||||||||||
| Total realized and unrealized gains (losses) | |||||||||||||||||||||||||||||||||||||||||||||||
| (In millions) | Beginning balance | Net purchases, issuances, sales and settlements | Net transfers in (out) | Ending balance |
Total gains (losses) included in OCI1
|
||||||||||||||||||||||||||||||||||||||||||
Assets – Asset Management |
|||||||||||||||||||||||||||||||||||||||||||||||
| Investments and derivative assets | $ | $ | $ | $ | $ | $ | $ | $ | |||||||||||||||||||||||||||||||||||||||
| Investments of Consolidated VIEs | ( |
( |
|||||||||||||||||||||||||||||||||||||||||||||
Total Level 3 assets – Asset Management |
$ | $ | $ | $ | $ | ( |
$ | $ | $ | ||||||||||||||||||||||||||||||||||||||
Assets – Retirement Services |
|||||||||||||||||||||||||||||||||||||||||||||||
| AFS securities | |||||||||||||||||||||||||||||||||||||||||||||||
| Foreign governments | $ | $ | ( |
$ | $ | $ | $ | $ | $ | ||||||||||||||||||||||||||||||||||||||
| Corporate | ( |
( |
( |
||||||||||||||||||||||||||||||||||||||||||||
| CLO | ( |
( |
( |
||||||||||||||||||||||||||||||||||||||||||||
| ABS | ( |
( |
|||||||||||||||||||||||||||||||||||||||||||||
| CMBS | ( |
( |
|||||||||||||||||||||||||||||||||||||||||||||
176
| Year ended December 31, 2022 | |||||||||||||||||||||||||||||||||||||||||||||||
| Total realized and unrealized gains (losses) | |||||||||||||||||||||||||||||||||||||||||||||||
| (In millions) | Beginning balance | Net purchases, issuances, sales and settlements | Net transfers in (out) | Ending balance |
Total gains (losses) included in OCI1
|
||||||||||||||||||||||||||||||||||||||||||
| RMBS | ( |
||||||||||||||||||||||||||||||||||||||||||||||
| Trading securities | ( |
( |
( |
||||||||||||||||||||||||||||||||||||||||||||
| Equity securities | ( |
( |
|||||||||||||||||||||||||||||||||||||||||||||
| Mortgage loans | ( |
( |
|||||||||||||||||||||||||||||||||||||||||||||
| Investment funds | ( |
||||||||||||||||||||||||||||||||||||||||||||||
| Funds withheld at interest – embedded derivative | ( |
( |
|||||||||||||||||||||||||||||||||||||||||||||
| Short-term investments | |||||||||||||||||||||||||||||||||||||||||||||||
| Other investments | ( |
( |
|||||||||||||||||||||||||||||||||||||||||||||
| Investments in related parties | |||||||||||||||||||||||||||||||||||||||||||||||
| AFS securities | |||||||||||||||||||||||||||||||||||||||||||||||
| Corporate | ( |
( |
( |
( |
|||||||||||||||||||||||||||||||||||||||||||
| CLO | ( |
( |
|||||||||||||||||||||||||||||||||||||||||||||
| ABS | ( |
( |
( |
( |
|||||||||||||||||||||||||||||||||||||||||||
| Trading securities | ( |
||||||||||||||||||||||||||||||||||||||||||||||
| Equity securities | ( |
( |
|||||||||||||||||||||||||||||||||||||||||||||
| Mortgage loans | ( |
( |
|||||||||||||||||||||||||||||||||||||||||||||
| Investment funds | ( |
||||||||||||||||||||||||||||||||||||||||||||||
| Short-term investments | ( |
||||||||||||||||||||||||||||||||||||||||||||||
| Funds withheld at interest – embedded derivative | ( |
( |
|||||||||||||||||||||||||||||||||||||||||||||
| Other investments | |||||||||||||||||||||||||||||||||||||||||||||||
| Reinsurance recoverable | ( |
||||||||||||||||||||||||||||||||||||||||||||||
| Assets of consolidated VIEs | |||||||||||||||||||||||||||||||||||||||||||||||
| Trading securities | |||||||||||||||||||||||||||||||||||||||||||||||
| Mortgage loans | ( |
( |
( |
||||||||||||||||||||||||||||||||||||||||||||
| Investment funds | ( |
||||||||||||||||||||||||||||||||||||||||||||||
| Other investments | ( |
( |
|||||||||||||||||||||||||||||||||||||||||||||
Total Level 3 assets – Retirement Services |
$ | $ | ( |
$ | ( |
$ | $ | ( |
$ | $ | ( |
$ | ( |
||||||||||||||||||||||||||||||||||
Liabilities – Asset Management |
|||||||||||||||||||||||||||||||||||||||||||||||
| Contingent consideration obligations | $ | $ | ( |
$ | $ | $ | $ | $ | $ | ||||||||||||||||||||||||||||||||||||||
| Debt and other liabilities of consolidated VIEs | ( |
( |
( |
||||||||||||||||||||||||||||||||||||||||||||
Total Level 3 liabilities – Asset Management |
$ | $ | ( |
$ | $ | ( |
$ | ( |
$ | $ | $ | ||||||||||||||||||||||||||||||||||||
Liabilities – Retirement Services |
|||||||||||||||||||||||||||||||||||||||||||||||
| Interest sensitive contract liabilities | |||||||||||||||||||||||||||||||||||||||||||||||
| Embedded derivative | $ | ( |
$ | $ | $ | ( |
$ | $ | ( |
$ | $ | ||||||||||||||||||||||||||||||||||||
| Universal life benefits | ( |
( |
|||||||||||||||||||||||||||||||||||||||||||||
| Future policy benefits | — | ||||||||||||||||||||||||||||||||||||||||||||||
| AmerUs Closed Block | ( |
( |
|||||||||||||||||||||||||||||||||||||||||||||
| ILICO Closed Block and life benefits | ( |
( |
|||||||||||||||||||||||||||||||||||||||||||||
| Derivative liabilities | ( |
( |
|||||||||||||||||||||||||||||||||||||||||||||
| Other liabilities | ( |
( |
( |
||||||||||||||||||||||||||||||||||||||||||||
Total Level 3 liabilities – Retirement Services |
$ | ( |
$ | $ | $ | ( |
$ | $ | ( |
$ | $ | ||||||||||||||||||||||||||||||||||||
1 Related to instruments held at end of period.
|
|||||||||||||||||||||||||||||||||||||||||||||||
177
| Year ended December 31, 2021 | |||||||||||||||||||||||||||||||||||||||||||||||
| Total realized and unrealized gains (losses) | |||||||||||||||||||||||||||||||||||||||||||||||
| (In millions) | Beginning balance | Included in income | Included in OCI | Net purchases, issuances, sales and settlements | Net transfers in (out) | Ending balance |
Total gains (losses) included in OCI1
|
||||||||||||||||||||||||||||||||||||||||
Assets – Asset Management |
|||||||||||||||||||||||||||||||||||||||||||||||
| Investments of Consolidated VIEs | $ | $ | $ | $ | $ | ( |
$ | $ | $ | ||||||||||||||||||||||||||||||||||||||
| Other Investments | ( |
||||||||||||||||||||||||||||||||||||||||||||||
Total Level 3 assets – Asset Management |
$ | $ | $ | $ | $ | ( |
$ | $ | $ | ||||||||||||||||||||||||||||||||||||||
Liabilities – Asset Management |
|||||||||||||||||||||||||||||||||||||||||||||||
| Contingent consideration obligations | $ | $ | $ | $ | ( |
$ | $ | $ | $ | ||||||||||||||||||||||||||||||||||||||
| Debt and other liabilities of consolidated VIEs | |||||||||||||||||||||||||||||||||||||||||||||||
Total Level 3 liabilities – Asset Management |
$ | $ | $ | $ | $ | $ | $ | $ | |||||||||||||||||||||||||||||||||||||||
1 Related to instruments held at end of period.
|
|||||||||||||||||||||||||||||||||||||||||||||||
The following represents the gross components of purchases, issuances, sales and settlements, net, and net transfers in (out) shown above:
| Year ended December 31, 2022 | |||||||||||||||||||||||||||||||||||||||||||||||
| (In millions) | Purchases | Issuances | Sales | Settlements | Net purchases, issuances, sales and settlements |
Transfers In1
|
Transfers Out1
|
Net Transfers In (Out) | |||||||||||||||||||||||||||||||||||||||
Assets – Asset Management |
|||||||||||||||||||||||||||||||||||||||||||||||
| Investments and derivative assets | $ | $ | $ | ( |
$ | $ | $ | $ | $ | ||||||||||||||||||||||||||||||||||||||
| Investments of consolidated VIEs | ( |
( |
( |
( |
|||||||||||||||||||||||||||||||||||||||||||
Total Level 3 assets – Asset Management |
$ | $ | $ | ( |
$ | $ | $ | $ | ( |
$ | ( |
||||||||||||||||||||||||||||||||||||
Assets – Retirement Services |
|||||||||||||||||||||||||||||||||||||||||||||||
| AFS securities | |||||||||||||||||||||||||||||||||||||||||||||||
| Corporate | $ | $ | $ | ( |
$ | ( |
$ | $ | $ | ( |
$ | ||||||||||||||||||||||||||||||||||||
| CLO | ( |
( |
( |
( |
|||||||||||||||||||||||||||||||||||||||||||
| ABS | ( |
( |
( |
||||||||||||||||||||||||||||||||||||||||||||
| CMBS | ( |
( |
|||||||||||||||||||||||||||||||||||||||||||||
| RMBS | ( |
( |
( |
||||||||||||||||||||||||||||||||||||||||||||
| Trading securities | ( |
( |
( |
( |
|||||||||||||||||||||||||||||||||||||||||||
| Equity securities | ( |
( |
( |
( |
|||||||||||||||||||||||||||||||||||||||||||
| Mortgage loans | ( |
( |
|||||||||||||||||||||||||||||||||||||||||||||
| Investment funds | ( |
( |
|||||||||||||||||||||||||||||||||||||||||||||
| Short-term investments | ( |
||||||||||||||||||||||||||||||||||||||||||||||
| Other investments | ( |
||||||||||||||||||||||||||||||||||||||||||||||
| Investments in related parties | |||||||||||||||||||||||||||||||||||||||||||||||
| AFS securities | |||||||||||||||||||||||||||||||||||||||||||||||
| Corporate | ( |
( |
( |
( |
|||||||||||||||||||||||||||||||||||||||||||
| CLO | |||||||||||||||||||||||||||||||||||||||||||||||
| ABS | ( |
( |
( |
( |
|||||||||||||||||||||||||||||||||||||||||||
| Trading securities | ( |
( |
( |
( |
|||||||||||||||||||||||||||||||||||||||||||
| Equity securities | ( |
( |
( |
( |
|||||||||||||||||||||||||||||||||||||||||||
| Mortgage loans | ( |
||||||||||||||||||||||||||||||||||||||||||||||
| Investment funds | ( |
( |
( |
||||||||||||||||||||||||||||||||||||||||||||
| Short-term investments | ( |
( |
|||||||||||||||||||||||||||||||||||||||||||||
| Other investments | ( |
||||||||||||||||||||||||||||||||||||||||||||||
178
| Year ended December 31, 2022 | |||||||||||||||||||||||||||||||||||||||||||||||
| (In millions) | Purchases | Issuances | Sales | Settlements | Net purchases, issuances, sales and settlements |
Transfers In1
|
Transfers Out1
|
Net Transfers In (Out) | |||||||||||||||||||||||||||||||||||||||
| Assets of consolidated VIEs | |||||||||||||||||||||||||||||||||||||||||||||||
| Trading securities | ( |
( |
|||||||||||||||||||||||||||||||||||||||||||||
| Equity securities | ( |
||||||||||||||||||||||||||||||||||||||||||||||
| Mortgage loans | ( |
( |
( |
||||||||||||||||||||||||||||||||||||||||||||
| Investment funds | ( |
( |
( |
||||||||||||||||||||||||||||||||||||||||||||
| Other investments | ( |
( |
|||||||||||||||||||||||||||||||||||||||||||||
Total Level 3 assets – Retirement Services |
$ | $ | $ | ( |
$ | ( |
$ | $ | $ | ( |
$ | ( |
|||||||||||||||||||||||||||||||||||
Liabilities - Asset Management |
|||||||||||||||||||||||||||||||||||||||||||||||
| Contingent consideration obligations | $ | $ | $ | $ | ( |
$ | $ | $ | $ | ||||||||||||||||||||||||||||||||||||||
| Debt and other liabilities of consolidated VIEs | ( |
( |
( |
( |
|||||||||||||||||||||||||||||||||||||||||||
Total Level 3 liabilities – Asset Management |
$ | $ | $ | $ | ( |
$ | ( |
$ | $ | ( |
$ | ( |
|||||||||||||||||||||||||||||||||||
Liabilities – Retirement Services |
|||||||||||||||||||||||||||||||||||||||||||||||
| Interest sensitive contract liabilities | |||||||||||||||||||||||||||||||||||||||||||||||
| Interest sensitive contract liabilities - Embedded derivative | $ | $ | ( |
$ | $ | $ | ( |
$ | $ | $ | |||||||||||||||||||||||||||||||||||||
| Other liabilities | ( |
( |
|||||||||||||||||||||||||||||||||||||||||||||
Total Level 3 liabilities – Retirement Services |
$ | $ | ( |
$ | $ | $ | ( |
$ | $ | $ | |||||||||||||||||||||||||||||||||||||
1 Transfers in and out are primarily assets of VIEs with changes in consolidation at Athene in 2022.
| |||||||||||||||||||||||||||||||||||||||||||||||
| Year ended December 31, 2021 | |||||||||||||||||||||||||||||||||||||||||||||||
| (In millions) | Purchases | Issuances | Sales | Settlements | Net purchases, issuances, sales and settlements | Transfers In | Transfers Out | Net Transfers In (Out) | |||||||||||||||||||||||||||||||||||||||
Assets – Asset Management |
|||||||||||||||||||||||||||||||||||||||||||||||
| Investments | $ | $ | $ | ( |
$ | $ | $ | $ | ( |
$ | ( |
||||||||||||||||||||||||||||||||||||
| Investments of consolidated VIEs | ( |
( |
( |
||||||||||||||||||||||||||||||||||||||||||||
Total Level 3 assets – Asset Management |
$ | $ | $ | ( |
$ | $ | $ | $ | ( |
$ | ( |
||||||||||||||||||||||||||||||||||||
Liabilities - Asset Management |
|||||||||||||||||||||||||||||||||||||||||||||||
| Contingent consideration obligations | $ | $ | $ | $ | ( |
$ | ( |
$ | $ | $ | |||||||||||||||||||||||||||||||||||||
| Debt and other liabilities of consolidated VIEs | ( |
||||||||||||||||||||||||||||||||||||||||||||||
Total Level 3 liabilities – Asset Management |
$ | $ | $ | $ | ( |
$ | $ | $ | $ | ||||||||||||||||||||||||||||||||||||||
Fair Value Option - Retirement Services
The following represents the gains (losses) recorded for instruments for which Athene has elected the fair value option, including related parties and VIEs:
| (In millions) | Year ended December 31, 2022 | ||||
| Trading securities | $ | ( |
|||
| Mortgage loans | ( |
||||
| Investment funds | |||||
| Future policy benefits | |||||
| Other liabilities | ( |
||||
| Total gains (losses) | $ | ( |
|||
179
Gains and losses on trading securities and other liabilities are recorded in investment related gains (losses) on the consolidated statements of operations. For fair value option mortgage loans, interest income is recorded in net investment income and subsequent changes in fair value in investment related gains (losses) on the consolidated statements of operations. Gains and losses related to investment funds, including related party investment funds, are recorded in net investment income on the consolidated statements of operations. The change in fair value of future policy benefits is recorded to future policy and other policy benefits on the consolidated statements of operations.
The following summarizes information for fair value option mortgage loans, including related parties and VIEs:
| (In millions) | December 31, 2022 | ||||
| Unpaid principal balance | $ | ||||
| Mark to fair value | ( |
||||
| Fair value | $ | ||||
The following represents the commercial mortgage loan portfolio 90 days or more past due and/or in non-accrual status:
| (In millions) | December 31, 2022 | ||||
| Unpaid principal balance of commercial mortgage loans 90 days or more past due and/or in non-accrual status | $ | ||||
| Mark to fair value of commercial mortgage loans 90 days or more past due and/or in non-accrual status | ( |
||||
| Fair value of commercial mortgage loans 90 days or more past due and/or in non-accrual status | $ | ||||
| Fair value of commercial mortgage loans 90 days or more past due | $ | ||||
| Fair value of commercial mortgage loans in non-accrual status | |||||
The following represents the residential loan portfolio 90 days or more past due and/or in non-accrual status:
| (In millions) | December 31, 2022 | ||||
| Unpaid principal balance of residential mortgage loans 90 days or more past due and/or in non-accrual status | $ | ||||
| Mark to fair value of residential mortgage loans 90 days or more past due and/or in non-accrual status | ( |
||||
| Fair value of residential mortgage loans 90 days or more past due and/or in non-accrual status | $ | ||||
Fair value of residential mortgage loans 90 days or more past due1
|
$ | ||||
| Fair value of residential mortgage loans in non-accrual status | |||||
1 Includes $ | |||||
The following is the estimated amount of gains (losses) included in earnings during the period attributable to changes in instrument-specific credit risk on our mortgage loan portfolio:
| (In millions) | Year ended December 31, 2022 | ||||
| Mortgage loans | $ | ( |
|||
The portion of gains and losses attributable to changes in instrument-specific credit risk is estimated by identifying commercial loans with loan-to-value ratios meeting credit quality criteria, and residential mortgage loans with delinquency status meeting credit quality criteria.
Financial Instruments Without Readily Determinable Fair Values
Athene has elected the measurement alternative for certain equity securities that do not have a readily determinable fair value. As of December 31, 2022, the carrying amount of the equity securities was $400 million with no cumulative recorded impairment.
180
Fair Value of Financial Instruments Not Carried at Fair Value - Retirement Services
The following represents Athene’s financial instruments not carried at fair value on the consolidated statements of financial condition:
| December 31, 2022 | |||||||||||||||||||||||||||||||||||
| (In millions) | Carrying Value | Fair Value | NAV | Level 1 | Level 2 | Level 3 | |||||||||||||||||||||||||||||
| Financial assets | |||||||||||||||||||||||||||||||||||
| Investment funds | $ | $ | $ | $ | $ | $ | |||||||||||||||||||||||||||||
| Policy loans | |||||||||||||||||||||||||||||||||||
| Funds withheld at interest | |||||||||||||||||||||||||||||||||||
| Short-term investments | |||||||||||||||||||||||||||||||||||
| Other investments | |||||||||||||||||||||||||||||||||||
| Investments in related parties | |||||||||||||||||||||||||||||||||||
| Investment funds | |||||||||||||||||||||||||||||||||||
| Funds withheld at interest | |||||||||||||||||||||||||||||||||||
| Total financial assets not carried at fair value | $ | $ | $ | $ | $ | $ | |||||||||||||||||||||||||||||
| Financial liabilities | |||||||||||||||||||||||||||||||||||
| Interest sensitive contract liabilities | $ | $ | $ | $ | $ | $ | |||||||||||||||||||||||||||||
| Debt | |||||||||||||||||||||||||||||||||||
| Securities to repurchase | |||||||||||||||||||||||||||||||||||
| Funds withheld liability | |||||||||||||||||||||||||||||||||||
| Total financial liabilities not carried at fair value | $ | $ | $ | $ | $ | $ | |||||||||||||||||||||||||||||
The fair value for financial instruments not carried at fair value are estimated using the same methods and assumptions as those carried at fair value. The financial instruments presented above are reported at carrying value on the consolidated statements of financial condition; however, in the case of policy loans, funds withheld at interest and liability, short-term investments, and securities to repurchase, the carrying amount approximates fair value.
Interest sensitive contract liabilities
The carrying and fair value of interest sensitive contract liabilities above includes fixed indexed and traditional fixed annuities without mortality or morbidity risks, funding agreements and payout annuities without life contingencies. The embedded derivatives within fixed indexed annuities without mortality or morbidity risks are excluded, as they are carried at fair value. The valuation of these investment contracts is based on discounted cash flow methodologies using significant unobservable inputs. The estimated fair value is determined using current market risk-free interest rates, adding a spread to reflect nonperformance risk and subtracting a risk margin to reflect uncertainty inherent in the projected cash flows.
Debt
The fair value of debt is obtained from commercial pricing services. These are classified as Level 2. The pricing services incorporate a variety of market observable information in their valuation techniques, including benchmark yields, trading activity, credit quality, issuer spreads, bids, offers and other reference data.
Significant Unobservable Inputs
Asset Management
Consolidated VIEs’ Investments
The significant unobservable inputs used in the fair value measurement of the equity securities include the discount rate applied, purchase multiple and net tangible asset value in the valuation models. These unobservable inputs in isolation can cause significant increases or decreases in fair value. The discount rate is determined based on the market rates an investor would expect for a similar investment with similar risks.
181
The significant unobservable inputs used in the fair value measurement of bank loans, bonds, profit participating notes and other equity investments are discount rates. Significant increases (decreases) in discount rates would result in significantly lower (higher) fair value measurements.
The significant unobservable inputs used in the fair value measurement of real estate are discount rates and capitalization rates. Significant increases (decreases) in any discount rates or capitalization rates in isolation would result in significantly lower (higher) fair value measurements.
Certain investments of VIEs are valued using the NAV per share equivalent calculated by the investment manager as a practical expedient to determine an independent fair value.
Consolidated VIEs’ Liabilities
The debt obligations of certain consolidated VIEs, that are CLOs, were measured on the basis of the fair value of the financial assets of those CLOs as the financial assets were determined to be more observable and, as a result, categorized as Level 2 in the fair value hierarchy.
The significant unobservable inputs used in the fair value measurement of the Company’s liabilities of consolidated VIEs are discount rates. Significant increases (decreases) in discount rates would result in a significantly lower (higher) fair value measurement.
Certain liabilities of VIEs are valued using the NAV per share equivalent calculated by the investment manager as a practical expedient to determine an independent fair value.
Contingent Consideration Obligations
The significant unobservable inputs used in the fair value measurement of the contingent consideration obligations are discount rate and volatility rate applied in the valuation models. These inputs in isolation can cause significant increases or decreases in fair value. See note 18 for further discussion of the contingent consideration obligations.
Retirement Services
AFS, trading and equity securities
Athene uses discounted cash flow models to calculate the fair value for certain fixed maturity and equity securities. The discount rate is a significant unobservable input because the credit spread includes adjustments made to the base rate. The base rate represents a market comparable rate for securities with similar characteristics. This excludes assets for which fair value is provided by independent broker quotes.
Mortgage loans
Athene uses discounted cash flow models from independent commercial pricing services to calculate the fair value of its mortgage loan portfolio. The discount rate is a significant unobservable input. This approach uses market transaction information and client portfolio-oriented information, such as prepayments or defaults, to support the valuations.
182
Interest sensitive contract liabilities – embedded derivative
Significant unobservable inputs used in the fixed indexed annuities embedded derivative of the interest sensitive contract liabilities valuation include:
1.Nonperformance risk – For contracts Athene issues, it uses the credit spread, relative to the U.S. Treasury curve based on Athene’s public credit rating as of the valuation date. This represents Athene’s credit risk for use in the estimate of the fair value of embedded derivatives.
2.Option budget – Athene assumes future hedge costs in the derivative’s fair value estimate. The level of option budgets determines the future costs of the options and impacts future policyholder account value growth.
3.Policyholder behavior – Athene regularly reviews the lapse and withdrawal assumptions (surrender rate). These are based on initial pricing assumptions updated for actual experience. Actual experience may be limited for recently issued products.
Valuation of Underlying Investments
Asset Management
As previously noted, the underlying entities that Apollo manages and invests in are primarily investment companies that account for their investments at estimated fair value.
On a quarterly basis, valuation committees consisting of members from senior management review and approve the valuation results related to the investments of the funds Apollo manages. For certain publicly traded vehicles managed by Apollo, a review is performed by an independent board of directors. Apollo also retains external valuation firms to provide third-party valuation consulting services to Apollo, which consist of certain limited procedures that management identifies and requests them to perform. The limited procedures provided by the external valuation firms assist management with validating their valuation results or determining fair value. Apollo performs various back-testing procedures to validate their valuation approaches, including comparisons between expected and observed outcomes, forecast evaluations and variance analyses. However, because of the inherent uncertainty of valuation, those estimated values may differ significantly from the values that would have been used had a ready market for the investments existed, and the differences could be material.
Yield Investments
Yield investments are generally valued based on third party vendor prices and/or quoted market prices and valuation models. Valuations using quoted market prices are based on the average of the “bid” and the “ask” quotes provided by multiple brokers wherever possible without any adjustments. Apollo will designate certain brokers to use to value specific securities. In determining the designated brokers, Apollo considers the following: (i) brokers with which Apollo has previously transacted, (ii) the underwriter of the security and (iii) active brokers indicating executable quotes. In addition, when valuing a security based on broker quotes wherever possible Apollo tests the standard deviation amongst the quotes received and the variance between the concluded fair value and the value provided by a pricing service. When broker quotes are not available Apollo considers the use of pricing service quotes or other sources to mark a position. When relying on a pricing service as a primary source, Apollo (i) analyzes how the price has moved over the measurement period, (ii) reviews the number of brokers included in the pricing service’s population, if available, and (iii) validates the valuation levels with Apollo’s pricing team and traders.
Debt securities that are not publicly traded or whose market prices are not readily available are valued at fair value utilizing a model based approach to determine fair value. Valuation approaches used to estimate the fair value of illiquid credit investments also may include the income approach, as described below. The valuation approaches used consider, as applicable, market risks, credit risks, counterparty risks and foreign currency risks.
Equity and Hybrid Investments
The majority of illiquid equity and hybrid investments are valued using the market approach and/or the income approach, as described below.
183
Market Approach
The market approach is driven by current market conditions, including actual trading levels of similar companies and, to the extent available, actual transaction data of similar companies. Judgment is required by management when assessing which companies are similar to the subject company being valued. Consideration may also be given to any of the following factors: (1) the subject company’s historical and projected financial data; (2) valuations given to comparable companies; (3) the size and scope of the subject company’s operations; (4) the subject company’s individual strengths and weaknesses; (5) expectations relating to the market’s receptivity to an offering of the subject company’s securities; (6) applicable restrictions on transfer; (7) industry and market information; (8) general economic and market conditions; and (9) other factors deemed relevant. Market approach valuation models typically employ a multiple that is based on one or more of the factors described above.
Enterprise value as a multiple of EBITDA is common and relevant for most companies and industries, however, other industry specific multiples are employed where available and appropriate. Sources for gaining additional knowledge related to comparable companies include public filings, annual reports, analyst research reports and press releases. Once a comparable company set is determined, Apollo reviews certain aspects of the subject company’s performance and determines how its performance compares to the group and to certain individuals in the group. Apollo compares certain measurements such as EBITDA margins, revenue growth over certain time periods, leverage ratios and growth opportunities. In addition, Apollo compares the entry multiple and its relation to the comparable set at the time of acquisition to understand its relation to the comparable set on each measurement date.
Income Approach
The income approach provides an indication of fair value based on the present value of cash flows that a business or security is expected to generate in the future. The most widely used methodology for the income approach is a discounted cash flow method. Inherent in the discounted cash flow method are significant assumptions related to the subject company’s expected results, the determination of a terminal value and a calculated discount rate, which is normally based on the subject company’s WACC. The WACC represents the required rate of return on total capitalization, which is comprised of a required rate of return on equity, plus the current tax-effected rate of return on debt, weighted by the relative percentages of equity and debt that are typical in the industry. The most critical step in determining the appropriate WACC for each subject company is to select companies that are comparable in nature to the subject company and the credit quality of the subject company. Sources for gaining additional knowledge about the comparable companies include public filings, annual reports, analyst research reports and press releases. The general formula then used for calculating the WACC considers the after-tax rate of return on debt capital and the rate of return on common equity capital, which further considers the risk-free rate of return, market beta, market risk premium and small stock premium, if applicable. The variables used in the WACC formula are inferred from the comparable market data obtained. The Company evaluates the comparable companies selected and concludes on WACC inputs based on the most comparable company or analyzes the range of data for the investment.
The value of liquid investments, where the primary market is an exchange (whether foreign or domestic), is determined using period end market prices. Such prices are generally based on the close price on the date of determination.
Certain of the funds Apollo manages may also enter into foreign currency exchange contracts, total return swap contracts, credit default swap contracts and other derivative contracts, which may include options, caps, collars and floors. Foreign currency exchange contracts are marked-to-market by recognizing the difference between the contract exchange rate and the current market rate as unrealized appreciation or depreciation. If securities are held at the end of the period, the changes in value are recorded in income as unrealized. Realized gains or losses are recognized when contracts are settled. Total return swap and credit default swap contracts are recorded at fair value as an asset or liability with changes in fair value recorded as unrealized appreciation or depreciation. Realized gains or losses are recognized at the termination of the contract based on the difference between the close-out price of the total return or credit default swap contract and the original contract price. Forward contracts are valued based on market rates obtained from counterparties or prices obtained from recognized financial data service providers.
184
Retirement Services
NAV
Investment funds are typically measured using NAV as a practical expedient in determining fair value and are not classified in the fair value hierarchy. The carrying value reflects a pro rata ownership percentage as indicated by NAV in the investment fund financial statements, which may be adjusted if it is determined NAV is not calculated consistent with investment company fair value principles. The underlying investments of the investment funds may have significant unobservable inputs, which may include but are not limited to, comparable multiples and WACC rates applied in valuation models or a discounted cash flow model.
AFS and trading securities
The fair value for most marketable securities without an active market are obtained from several commercial pricing services. These are classified as Level 2 assets. The pricing services incorporate a variety of market observable information in their valuation techniques, including benchmark yields, trading activity, credit quality, issuer spreads, bids, offers and other reference data. This category typically includes U.S. and non-U.S. corporate bonds, U.S. agency and government guaranteed securities, CLO, ABS, CMBS and RMBS.
Athene also has fixed maturity securities priced based on indicative broker quotes or by employing market accepted valuation models. For certain fixed maturity securities, the valuation model uses significant unobservable inputs and are included in Level 3 in fair value hierarchy. Significant unobservable inputs used include discount rates, issue-specific credit adjustments, material non-public financial information, estimation of future earnings and cash flows, default rate assumptions, liquidity assumptions and indicative quotes from market makers. These inputs are usually considered unobservable, as not all market participants have access to this data.
Privately placed fixed maturity securities are valued based on the credit quality and duration of comparable marketable securities, which may be securities of another issuer with similar characteristics. In some instances, a matrix-based pricing model is used. These models consider the current level of risk-free interest rates, corporate spreads, credit quality of the issuer and cash flow characteristics of the security. Additional factors such as net worth of the borrower, value of collateral, capital structure of the borrower, presence of guarantees and Athene’s evaluation of the borrower’s ability to compete in its relevant market are also considered. Privately placed fixed maturity securities are classified as Level 2 or 3.
Equity securities
Fair values of publicly traded equity securities are based on quoted market prices and classified as Level 1. Other equity securities, typically private equities or equity securities not traded on an exchange, are valued based on other sources, such as commercial pricing services or brokers, and are classified as Level 2 or 3.
Mortgage loans
Athene estimates fair value monthly using discounted cash flow analysis and rates being offered for similar loans to borrowers with similar credit ratings. Loans with similar characteristics are aggregated for purposes of the calculations. The discounted cash flow model uses unobservable inputs, including estimates of discount rates and loan prepayments. Mortgage loans are classified as Level 3.
Investment funds
Certain investment funds for which Athene has elected the fair value option are included in Level 3 and are priced based on market accepted valuation models. The valuation models use significant unobservable inputs, which include material non-public financial information, estimation of future distributable earnings and demographic assumptions. These inputs are usually considered unobservable, as not all market participants have access to this data.
185
Other investments
The fair value of other investments are determined using a discounted cash flow model using discount rates for similar investments.
Funds withheld at interest embedded derivative
Athene estimates the fair value of the embedded derivative based on the change in the fair value of the assets supporting the funds withheld payable under modco and funds withheld reinsurance agreements. As a result, the fair value of the embedded derivative is classified as Level 2 or 3 based on the valuation methods used for the assets held supporting the reinsurance agreements.
Derivatives
Derivative contracts can be exchange traded or over the counter. Exchange-traded derivatives typically fall within Level 1 of the fair value hierarchy depending on trading activity. Over-the-counter derivatives are valued using valuation models or an income approach using third-party broker valuations. Valuation models require a variety of inputs, including contractual terms, market prices, yield curves, credit curves, measures of volatility, prepayment rates and correlation of the inputs. Athene considers and incorporates counterparty credit risk in the valuation process through counterparty credit rating requirements and monitoring of overall exposure. Athene also evaluates and includes its own nonperformance risk in valuing derivatives. The majority of Athene’s derivatives trade in liquid markets; therefore, it can verify model inputs and model selection does not involve significant management judgment. These are typically classified within Level 2 of the fair value hierarchy.
Interest sensitive contract liabilities embedded derivative
Embedded derivatives related to interest sensitive contract liabilities with fixed indexed annuity products are classified as Level 3. The valuations include significant unobservable inputs associated with economic assumptions and actuarial assumptions for policyholder behavior.
AmerUs Closed Block
Athene elected the fair value option for the future policy benefits liability in the AmerUs Closed Block. The valuation technique is to set the fair value of policyholder liabilities equal to the fair value of assets. There is an additional component which captures the fair value of the open block’s obligations to the closed block business. This component is the present value of the projected release of required capital and future earnings before income taxes on required capital supporting the AmerUs Closed Block, discounted at a rate which represents a market participant’s required rate of return, less the initial required capital. Unobservable inputs include estimates for these items. The AmerUs Closed Block policyholder liabilities and any corresponding reinsurance recoverable are classified as Level 3.
ILICO Closed Block
Athene elected the fair value option for the ILICO Closed Block. The valuation technique is to set the fair value of policyholder liabilities equal to the fair value of assets. There is an additional component which captures the fair value of the open block’s obligations to the closed block business. This component uses the present value of future cash flows which include commissions, administrative expenses, reinsurance premiums and benefits, and an explicit cost of capital. The discount rate includes a margin to reflect the business and nonperformance risk. Unobservable inputs include estimates for these items. The ILICO Closed Block policyholder liabilities and corresponding reinsurance recoverable are classified as Level 3.
Universal life liabilities and other life benefits
Athene elected the fair value option for certain blocks of universal and other life business ceded to Global Atlantic. Athene uses a present value of liability cash flows. Unobservable inputs include estimates of mortality, persistency, expenses, premium payments and a risk margin used in the discount rates that reflects the riskiness of the business. The universal life policyholder liabilities and corresponding reinsurance recoverable are classified as Level 3.
186
Other liabilities
Other liabilities includes funds withheld liability, as described above in funds withheld at interest embedded derivative, and a ceded modco agreement of certain inforce funding agreement contracts for which Athene elected the fair value option. Athene estimates the fair value of the ceded modco agreement by discounting projected cash flows for net settlements and certain periodic and non-periodic payments. Unobservable inputs include estimates for asset portfolio returns and economic inputs used in the discount rate, including risk margin. Depending on the projected cash flows and other assumptions, the contract may be recorded as an asset or liability. The estimate is classified as Level 3.
8. Reinsurance
The following summarizes the effect of reinsurance on premiums and future policy and other policy benefits on the consolidated statements of operations:
| (In millions) | Year ended December 31, 2022 | ||||
| Premiums | |||||
| Direct | $ | ||||
| Reinsurance assumed | |||||
| Reinsurance ceded | ( |
||||
| Total premiums | $ | ||||
| Future policy and other policy benefits | |||||
| Direct | $ | ||||
| Reinsurance assumed | |||||
| Reinsurance ceded | ( |
||||
| Total future policy and other policy benefits | $ | ||||
Reinsurance typically provides for recapture rights on the part of the ceding company for certain events of default. Additionally, some agreements require placement of assets in trust accounts for the benefit of the ceding entity. The required minimum assets are equal to or greater than statutory reserves, as defined by the agreement, and were $12,643 million as of December 31, 2022. Although Athene owns assets placed in trust, their use is restricted based on the trust agreement terms. If the statutory book value of the assets, or in certain cases fair value, in a trust declines because of impairments or other reasons, additional contributions of assets to the trust may be required. In addition, the assets within a trust may be subject to a pledge in favor of the applicable reinsurance company.
Global Atlantic
Athene has a 100 % coinsurance and assumption agreement with Global Atlantic. The agreement ceded all existing open block life insurance business issued by Athene Annuity and Life Company (“AAIA”), with the exception of enhanced guarantee universal life insurance products. Athene also entered into a 100 % coinsurance agreement with Global Atlantic to cede all policy liabilities of the ILICO Closed Block. The ILICO Closed Block consists primarily of participating whole life insurance policies. Athene also has an excess of loss arrangement with Global Atlantic to be reimbursed for any payments required from Athene’s general assets to meet the contractual obligations of the AmerUs Closed Block not covered by existing reinsurance through Athene Re USA IV. The AmerUs Closed Block consists primarily of participating whole life insurance policies. Since all liabilities were covered by the existing reinsurance at close, no reinsurance premiums were ceded. The assets backing the AmerUs Closed Block are managed, on AAIA’s behalf, by Goldman Sachs Asset Management.
As of December 31, 2022, Global Atlantic maintained a series of trust and custody accounts under the terms of these agreements with assets equal to or greater than a required aggregate statutory balance of $2,745 million.
Protective Life Insurance Company (“Protective”)
Athene reinsured substantially all of the existing life and health business of Athene Annuity & Life Assurance Company (“AADE”) to Protective under a coinsurance agreement in 2011. As of December 31, 2022, Protective maintained a trust for Athene’s benefit with assets having a fair value of $1,203 million.
187
Reinsurance Recoverables
The following summarizes reinsurance recoverable balances:
| (In millions) | December 31, 2022 | ||||
| Global Atlantic | $ | ||||
| Protective | |||||
| Brighthouse Financial | |||||
Other1
|
|||||
| Reinsurance recoverable | $ | ||||
1 Represents all other reinsurers, with no single reinsurer having a carrying value in excess of 5% of total recoverable.
| |||||
9. Deferred Acquisition Costs, Deferred Sales Inducements and Value of Business Acquired
The following represents a rollforward of DAC, DSI and VOBA:
| (In millions) | DAC | DSI | VOBA | Total | |||||||||||||||||||
| Balance at January 1, 2022 | $ | $ | $ | $ | |||||||||||||||||||
| Additions | |||||||||||||||||||||||
| Unlocking | |||||||||||||||||||||||
| Amortization | ( |
( |
( |
||||||||||||||||||||
| Impact of unrealized investment (gains) losses and other | ( |
||||||||||||||||||||||
| Balance at December 31, 2022 | $ | $ | $ | $ | |||||||||||||||||||
The expected amortization of VOBA for the next five years is as follows:
| (In millions) | Expected Amortization | ||||
| 2023 | $ | ||||
| 2024 | |||||
| 2025 | |||||
| 2026 | |||||
| 2027 | |||||
10. Goodwill
The following table presents Apollo’s goodwill by segment:
| (In millions) | December 31, 2022 | December 31, 2021 | |||||||||
| Asset Management | $ | $ | |||||||||
| Retirement Services | |||||||||||
| Principal Investing | |||||||||||
| Total Goodwill | $ | $ | |||||||||
On January 1, 2022, the Company completed the previously announced merger transactions with Athene. In connection with the completion of the Mergers, the Company recognized goodwill of $4.1 billion as of the Merger Date. See note 3 for further disclosure regarding the goodwill recorded as a result of the Mergers.
In connection with the completion of the Mergers, the Company undertook a strategic review of its operating structure and business segments to assess the performance of its businesses and the allocation of resources. As a result, the Company reorganized into three reportable segments: Asset Management, Retirement Services, and Principal Investing. The Company
188
conducted interim impairment testing immediately prior to and subsequent to the reorganization and determined there to be no impairment of historical goodwill.
Apollo acquired Griffin Capital’s U.S. wealth distribution business and U.S. asset management business in two separate closings on March 1, 2022 and May 3, 2022 and recorded goodwill of $13 million and $134 million, respectively, on each acquisition date. All of the goodwill associated with the Griffin Capital acquisitions are included within the Asset Management segment.
11. Profit Sharing Payable
Profit sharing payable was $1.4 billion and $1.4 billion as of December 31, 2022 and December 31, 2021, respectively. The below is a roll-forward of the profit-sharing payable balance:
| (In millions) | Total | ||||
Profit sharing payable, January 1, 2021 |
$ | ||||
| Profit sharing expense | |||||
| Payments/other | ( |
||||
Profit sharing payable, December 31, 2021 |
|||||
| Profit sharing expense | |||||
| Payments/other | ( |
||||
Profit sharing payable, December 31, 2022 |
$ | ||||
Profit sharing expense includes (i) changes in amounts due to current and former employees entitled to a share of performance revenues in funds managed by Apollo and (ii) changes to the fair value of the contingent consideration obligations recognized in connection with certain of the Company’s acquisitions. Profit sharing expense excludes the potential return of profit-sharing distributions that would be due if certain funds were liquidated, which is recorded in due from related parties in the consolidated statements of financial condition.
The Company requires that a portion of certain of the performance revenues distributed to the Company’s employees be used to purchase restricted shares of common stock issued under its Equity Plan. Prior to distribution of the performance revenues, the Company records the value of the equity-based awards expected to be granted in other assets and accounts payable, accrued expenses, and other liabilities.
189
12. Income Taxes
The Company’s income tax (provision) benefit totaled $1,069 million, $(594 ) million and $(86 ) million for the years ended December 31, 2022, 2021 and 2020, respectively. The Company’s effective income tax rate was approximately 18.4 %, 12.2 % and 15.7 % for the years ended December 31, 2022, 2021 and 2020, respectively.
The provision (benefit) for income taxes is presented in the following table:
| Years ended December 31, | |||||||||||||||||
| (In millions) | 2022 | 2021 | 2020 | ||||||||||||||
| Current: | |||||||||||||||||
| Federal income tax | $ | $ | $ | ||||||||||||||
Foreign income tax1
|
|||||||||||||||||
| State and local income tax | |||||||||||||||||
| $ | $ | $ | |||||||||||||||
| Deferred: | |||||||||||||||||
| Federal income tax | ( |
||||||||||||||||
Foreign income tax1
|
( |
||||||||||||||||
| State and local income tax | ( |
||||||||||||||||
| ( |
|||||||||||||||||
| Total Income Tax Provision (Benefit) | $ | ( |
$ | $ | |||||||||||||
1 The foreign income tax provision (benefit) was calculated on ($ | |||||||||||||||||
On August 16, 2022, the U.S. government enacted the Inflation Reduction Act of 2022 (the “IRA”). The IRA contains a number of tax-related provisions, including a 15% minimum corporate income tax on certain large corporations as well as an excise tax on stock repurchases. It is unclear how the IRA will be implemented by the U.S. Department of the Treasury through regulation. The Company is evaluating the impact of the IRA on its tax liability, which tax liability could also be affected by how the provisions of the IRA are implemented through such regulation. The Company will continue to evaluate the IRA’s impact as further information becomes available.
The primary jurisdictions in which the Company operates and incurs income taxes are the United States and the United Kingdom. The Company has accumulated undistributed earnings generated by certain foreign subsidiaries, which are intended to be indefinitely reinvested. As such, no deferred taxes have been recorded for the difference between outside tax basis and the carrying amount. The Company determined that estimating the unrecognized tax liability is not practicable.
The following table reconciles the U.S. Federal statutory tax rate to the effective income tax rate:
| Years ended December 31, | |||||||||||||||||
| (In millions, except percentages) | 2022 | 2021 | 2020 | ||||||||||||||
| U.S. federal statutory tax rate | % | % | % | ||||||||||||||
| Income passed through to non-controlling interests | ( |
( |
( |
||||||||||||||
| State and local income taxes (net of federal benefit) | ( |
||||||||||||||||
| Impact of Mergers | |||||||||||||||||
| Impact of corporate conversion | |||||||||||||||||
| Impact of foreign taxes (net of foreign tax credit) | |||||||||||||||||
| Impact of equity-based compensation | ( |
||||||||||||||||
| Impact of valuation allowance | ( |
||||||||||||||||
| Other | ( |
||||||||||||||||
| Effective income tax rate | % | % | % | ||||||||||||||
190
The income tax provision (benefit) is presented in the following table:
| Years ended December 31, | |||||||||||||||||
| (In millions) | 2022 | 2021 | 2020 | ||||||||||||||
| Income tax provision (benefit) | $ | ( |
$ | $ | |||||||||||||
| Income tax provision (benefit) from OCI | ( |
||||||||||||||||
| Total income tax provision (benefit) | $ | ( |
$ | $ | |||||||||||||
Deferred income taxes are recorded due to temporary differences between the tax basis of an asset or liability and its reported amount in the consolidated statements of financial condition. These temporary differences result in taxable or deductible amounts in future years.
As of December 31, 2022, the Company had a federal net operating loss (“NOL”) carryforward of $108 million, a state and local NOL carryforward of $309 million and a foreign NOL of $355 million. The federal NOL and state and local NOL will begin to expire in 2023 and 2031, respectively. The foreign NOL has an indefinite life carryfoward. The Company had no foreign tax credit carryforwards as of December 31, 2022.
The Company’s deferred tax assets and liabilities in the consolidated statements of financial condition consist of the following:
| December 31, | |||||||||||
| (In millions) | 2022 | 2021 | |||||||||
| Asset Management | |||||||||||
| Deferred Tax Assets: | |||||||||||
| Depreciation and amortization | $ | $ | |||||||||
| Net operating loss carryforwards | |||||||||||
| Deferred revenue | |||||||||||
| Equity-based compensation | |||||||||||
| Other | |||||||||||
| Total Deferred Tax Assets | |||||||||||
| Deferred Tax Liabilities: | |||||||||||
| Basis difference in investments | |||||||||||
| Other | |||||||||||
| Total Deferred Tax Liabilities | |||||||||||
| Total Deferred Tax Assets, Net - Asset Management | $ | $ | |||||||||
| Retirement Services | |||||||||||
| Deferred Tax Assets: | |||||||||||
| Insurance liabilities | $ | $ | |||||||||
| Net unrealized losses on AFS | |||||||||||
| Net operating and capital loss carryforwards | |||||||||||
| Investments, including derivatives | |||||||||||
| Employee benefits | |||||||||||
| Investment in foreign subsidiaries | |||||||||||
| Other | |||||||||||
| Total Deferred Tax Assets | |||||||||||
| Valuation allowance | ( |
||||||||||
| Deferred Tax Assets, Net of Valuation Allowance | |||||||||||
| Deferred Tax Liabilities: | |||||||||||
| Intangible assets | |||||||||||
| DAC, DSI and VOBA | |||||||||||
| Other | |||||||||||
| Total Deferred Tax Liabilities | |||||||||||
| Total Deferred Tax Assets, Net - Retirement Services | $ | $ | |||||||||
191
The valuation allowance consists of the following:
| December 31, | |||||||||||
| (In millions) | 2022 | 2021 | |||||||||
| U.S. federal and state net operating losses and other deferred tax assets | $ | $ | |||||||||
| UK Net operating losses and other deferred tax assets | |||||||||||
| Total Valuation Allowance | $ | $ | |||||||||
In the normal course of business, the Company is subject to examination by federal, state, local and foreign tax authorities. As of December 31, 2022, the Company’s U.S. federal, state, local and foreign income tax returns for the years 2019 through 2021 are open under the general statute of limitations provisions and therefore subject to examination. Currently, the Internal Revenue Service is examining the tax returns of the Company and certain subsidiaries for the 2013, 2015, 2017, 2019, and 2020 tax years. The State and City of New York are examining certain subsidiaries’ tax returns for tax years 2011 to 2020. The United Kingdom tax authorities are currently examining certain subsidiaries’ tax returns for tax year 2017 and 2020. There are other examinations ongoing in other foreign jurisdictions in which the Company operates. No provisions with respect to these examinations have been recorded, other than the unrecognized tax benefits discussed above.
Below is a tabular roll forward of the beginning and ending aggregate unrecognized tax benefits:
| Years ended December 31, | ||||||||||||||||||||
| (In millions) | 2022 | 2021 | 2020 | |||||||||||||||||
| Balance at beginning of period | $ | $ | $ | |||||||||||||||||
| Increases based on tax positions taken in the prior years | ||||||||||||||||||||
| Balance at end of period | $ | $ | $ | |||||||||||||||||
As of December 31, 2022, the Company has unrecognized tax benefits of $16 million which, if recognized, would impact the effective tax rate. The Company does not believe that it has any tax positions for which it is reasonably possible that it will be required to record significant amounts of unrecognized tax benefits within the next twelve months. The Company recognizes interest and penalties related to the unrecognized tax benefits in its provision for income taxes. During 2022 and as of December 31, 2022, the Company accrued interest of $5 million.
The Company has historically recorded deferred tax assets resulting from the step-up in the tax basis of assets, including intangibles, resulting from exchanges of AOG Units for Class A shares by the Former Managing Partners and Contributing Partners. A related liability has also historically been recorded in due to related parties in the consolidated statements of financial condition for the expected payments under the tax receivable agreement entered into by and among the Company, the Former Managing Partners, the Contributing Partners, and other parties thereto (as amended, the “tax receivable agreement”) (see note 17). The benefit the Company has historically obtained from the difference in the tax asset recognized and the related liability was recorded as an increase to additional paid in capital. The amortization period for the portion of the increase in tax basis related to intangibles is 15 years. The realization of the remaining portion of the increase in tax basis relates to the disposition of the underlying assets to which the step-up is attributed. The associated deferred tax assets reverse at the time of the corresponding asset disposition.
After the Mergers, the Former Managing Partners and Contributing Partners no longer own AOG Units. Therefore, there were no new exchanges subject to the tax receivable agreement during the year ended December 31, 2022. The table below presents the impact to the deferred tax asset, tax receivable agreement liability and additional paid in capital related to the exchange of AOG Units for Class A shares for the year ended December 31, 2021.
|
Exchange of AOG Units for Class A shares
(In millions)
|
Increase in Deferred Tax Asset | Increase in Tax Receivable Agreement Liability | Increase in Additional Paid in Capital | |||||||||||||||||
| For the Year Ended December 31, 2021 | $ | $ | $ | |||||||||||||||||
192
13. Debt
Company debt consisted of the following:
| December 31, 2022 | December 31, 2021 | |||||||||||||||||||||||||||||||
| (In millions, except percentages) | Maturity Date | Outstanding Balance | Fair Value | Outstanding Balance | Fair Value | |||||||||||||||||||||||||||
| Asset Management | ||||||||||||||||||||||||||||||||
| May 30, 2024 | $ | $ | 4 |
$ | $ | 4 |
||||||||||||||||||||||||||
| May 27, 2026 | 4 |
4 |
||||||||||||||||||||||||||||||
| February 15, 2029 | 4 |
4 |
||||||||||||||||||||||||||||||
| June 5, 2030 | 4 |
4 |
||||||||||||||||||||||||||||||
5 |
3 |
|||||||||||||||||||||||||||||||
| March 15, 2048 | 4 |
4 |
||||||||||||||||||||||||||||||
| January 14, 2050 | 4 |
4 |
||||||||||||||||||||||||||||||
| April 15, 2032 | 4 |
6 |
||||||||||||||||||||||||||||||
| January 15, 2025 | 3 |
6 |
||||||||||||||||||||||||||||||
| July 23, 2023 | 3 |
6 |
||||||||||||||||||||||||||||||
| Retirement Services | ||||||||||||||||||||||||||||||||
| January 12, 2028 | ||||||||||||||||||||||||||||||||
| April 3, 2030 | ||||||||||||||||||||||||||||||||
| January 15, 2031 | ||||||||||||||||||||||||||||||||
| May 25, 2051 | ||||||||||||||||||||||||||||||||
| May 15, 2052 | ||||||||||||||||||||||||||||||||
| February 1, 2033 | ||||||||||||||||||||||||||||||||
| Total Debt | $ | $ | $ | $ | ||||||||||||||||||||||||||||
1 Interest rate is calculated as weighted average annualized.
| ||||||||||||||||||||||||||||||||
2 Includes amortization of note discount, as applicable, totaling $ | ||||||||||||||||||||||||||||||||
3 Fair value is based on a discounted cash flow method. These notes are classified as a Level 3 liability within the fair value hierarchy.
| ||||||||||||||||||||||||||||||||
4 Fair value is based on broker quotes. These notes are valued using Level 2 inputs based on the number and quality of broker quotes obtained, the standard deviations of the observed broker quotes and the percentage deviation from external pricing services.
| ||||||||||||||||||||||||||||||||
5 There is no outstanding balance as of December 31, 2022. These notes were transferred to a VIE consolidated by Athene during the year ended December 31, 2022.
| ||||||||||||||||||||||||||||||||
6 Fair value is based on obtained broker quotes. These notes are classified as a Level III liability within the fair value hierarchy based on the number and quality of broker quotes obtained, the standard deviations of the observed broker quotes and the percentage deviation from external pricing services. For instances where broker quotes are not available, a discounted cash flow method is used to obtain a fair value.
| ||||||||||||||||||||||||||||||||
Asset Management - Notes Issued
The indentures governing the 2024 Senior Notes, the 2026 Senior Notes, the 2029 Senior Notes, the 2030 Senior Notes, the 2048 Senior Notes and the 2050 Subordinated Notes include covenants that restrict the ability of Apollo Management Holdings, L.P., an Apollo subsidiary and issuer of the notes (“AMH”) and, as applicable, the guarantors of the notes under the indentures, to incur indebtedness secured by liens on voting stock or profit participating equity interests of their respective subsidiaries, or merge, consolidate or sell, transfer or lease assets. The indentures also provide for customary events of default.
Retirement Services - Notes Issued
Athene’s senior unsecured notes are callable by AHL at any time. If called prior to three months before the scheduled maturity date, the price is equal to the greater of (1) 100 % of the principal and any accrued and unpaid interest and (2) an amount equal to the sum of the present values of remaining scheduled payments, discounted from the scheduled payment date to the redemption date treasury rate plus a spread as defined in the applicable prospectus supplement and any accrued and unpaid interest.
193
Credit and Liquidity Facilities
The following table represents the Company’s credit and liquidity facilities as of December 31, 2022:
| Instrument/Facility | Borrowing Date | Maturity Date | Administrative Agent | Key terms | ||||||||||
|
Asset Management -
2022 AMH credit facility
|
N/A | October 12, 2027 | Citibank | The commitment fee on the $ |
||||||||||
|
Retirement Services -
AHL credit facility
|
N/A | December 3, 2024 | Citibank | The borrowing capacity under the AHL credit facility is $ |
||||||||||
|
Retirement Services -
AHL liquidity facility
|
N/A | June 30, 2023 | Wells Fargo Bank | The borrowing capacity under the AHL liquidity facility is $ |
||||||||||
Asset Management - Credit Facility
On October 12, 2022, AMH, as borrower, entered into a new $1.0 billion revolving credit facility with Citibank, N.A., as administrative agent, which matures on October 12, 2027 (“2022 AMH credit facility”). Borrowings under the 2022 AMH credit facility may be used for working capital and general corporate purposes, including, without limitation, permitted acquisitions. As of December 31, 2022, AMH, the borrower under the facility, could incur incremental facilities in an aggregate amount not to exceed $250 million plus additional amounts so long as AMH was in compliance with a net leverage ratio not to exceed 4.00 to 1.00.
As of December 31, 2022, there were no amounts outstanding under the 2022 AMH credit facility and the Company was in compliance with all financial covenants under the facility.
Retirement Services - Credit Facility and Liquidity Facility
AHL Credit Facility—AHL has a revolving credit agreement with Citibank, N.A. as administrative agent, which matures on December 3, 2024, subject to up to two one-year extensions (“AHL credit facility”). The borrowing capacity under the AHL credit facility is $1.25 billion, with potential increases up to $1.75 billion. In connection with the AHL credit facility, AHL and Athene USA Corporation (“AUSA”) guaranteed all of the obligations of AHL, Athene Life Re (“ALRe”), Athene Annuity Re Ltd. (“AARe”) and AUSA under this facility, and ALRe and AARe guaranteed certain of the obligations of AHL, ALRe, AARe and AUSA under this facility. The AHL credit facility contains various standard covenants with which the company must comply, including the following:
1. Consolidated debt to capitalization ratio of not greater than 35 %;
2. Minimum consolidated net worth of no less than $7.3 billion; and
3. Restrictions on Athene’s ability to incur debt and liens, in each case with certain exceptions.
As of December 31, 2022, there were no amounts outstanding under the AHL credit facility and Athene was in compliance with all financial covenants under the facility.
Interest accrues on outstanding borrowings at either the Eurodollar Rate (as defined in the AHL credit facility) plus a margin or a base rate plus a margin, with the applicable margin varying based on Athene’s Debt Rating (as defined in the AHL credit facility).
AHL Liquidity Facility—In the third quarter of 2022, AHL entered into a revolving credit facility with a syndicate of banks, including Wells Fargo Bank, National Association, as administrative agent, which matures on June 30, 2023, subject to additional 364 -day extensions (“AHL liquidity facility”). The AHL liquidity facility will be used for liquidity and working capital needs to meet short-term cash flow and investment timing differences. The borrowing capacity under the AHL liquidity facility is $2.5 billion, with potential increases up to $3.0 billion. The AHL liquidity facility contains various standard covenants with which Athene must comply, including the following:
1. ALRe Minimum Consolidated Net Worth (as defined in the AHL liquidity facility) of no less than $9.3 billion; and
2. Restrictions on Athene’s ability to incur debt and liens, in each case with certain exceptions.
194
Interest accrues on outstanding borrowings at the secured overnight financing rate (Adjusted Term SOFR, as defined in the AHL liquidity facility) plus a margin or a base rate plus a margin, with applicable margin varying based on ALRe’s Financial Strength Rating (as defined in the AHL liquidity facility).
As of December 31, 2022, there were no amounts outstanding under the AHL liquidity facility and Athene was in compliance with all financial covenants under the facility. On February 7, 2023, Athene borrowed $1 billion from the AHL liquidity facility for short-term cash flow needs.
Interest Expense
The following table presents the interest expense incurred related to the Company’s debt:
| Years ended December 31, | |||||||||||||||||
| (In millions) | 2022 | 2021 | 2020 | ||||||||||||||
| Asset Management | $ | $ | $ | ||||||||||||||
Retirement Services1
|
|||||||||||||||||
| Total Interest Expense | $ | $ | $ | ||||||||||||||
Note: Debt issuance costs incurred are amortized into interest expense over the term of the debt arrangement, as applicable. | |||||||||||||||||
1 Interest expense for Retirement Services is included in policy and other operating expenses on the consolidated statements of operations.
| |||||||||||||||||
Contractual Maturities
The table below presents the contractual maturities for the Company's debt arrangements as of December 31, 2022:
| (In millions) | 2023 | 2024 - 2025 |
2026 - 2027 |
2028 and Thereafter | Total | ||||||||||||||||||||||||
| Asset Management | |||||||||||||||||||||||||||||
| Debt obligations | $ | $ | $ | $ | $ | ||||||||||||||||||||||||
| Retirement Services | |||||||||||||||||||||||||||||
| Debt obligations | |||||||||||||||||||||||||||||
Total Obligations as of December 31, 2022 |
$ | $ | $ | $ | $ | ||||||||||||||||||||||||
14. Equity-Based Compensation
Under the Equity Plan, the Company grants equity-based awards to employees of AAM and AHL. Equity-based awards granted to employees and non-employees as compensation are measured based on the grant date fair value of the award, which considers the public share price of AGM’s common stock subject to certain discounts, as applicable.
The Company grants both service-based and performance-based awards. The estimated total grant date fair value for service-based awards is charged to compensation expense on a straight-line basis over the vesting period, which is generally to six years from the date of grant. Certain service-based awards are tied to profit sharing arrangements in which a portion of the performance fees distributed to the general partner are required to be used by employees to purchase restricted shares of common stock or is delivered in the form of RSUs, which are granted under the Company’s Equity Plan. Performance-based awards vest subject to continued employment and the Company’s achievement of specified performance goals. In accordance with U.S. GAAP, equity-based compensation expense for performance grants are typically recognized on an accelerated recognition method over the requisite service period to the extent the performance revenue metrics are met or deemed probable. Equity-based awards that do not require future service (i.e., vested awards) are expensed immediately.
For the years ended December 31, 2022, 2021 and 2020, the Company recorded equity-based compensation expense of $540 million, $1.2 billion and $213 million, respectively. As of December 31, 2022, there was $727 million of estimated unrecognized compensation expense related to unvested RSU awards. This cost is expected to be recognized over a weighted-average period of 2.8 years.
195
The following table summarizes the weighted average discounts for plan grants, bonus grants and performance grants.
| Years ended December 31, | |||||||||||||||||
| 2022 | 2021 | 2020 | |||||||||||||||
| Plan grants: | |||||||||||||||||
Discount for the lack of distributions until vested1
|
% | % | % | ||||||||||||||
Marketability discount for transfer restrictions2
|
% | % | % | ||||||||||||||
| Bonus grants: | |||||||||||||||||
Marketability discount for transfer restrictions2
|
% | % | % | ||||||||||||||
| Performance grants: | |||||||||||||||||
Discount for the lack of distributions until vested1
|
% | % | % | ||||||||||||||
Marketability discount for transfer restrictions2
|
% | % | % | ||||||||||||||
1 Based on the present value of a growing annuity calculation.
| |||||||||||||||||
2 Based on the Finnerty Model calculation.
| |||||||||||||||||
Service-Based Awards
During the years ended December 31, 2022, 2021 and 2020, the Company awarded 5.1 million, 2.5 million and 2.4 million of service-based RSUs, respectively, with a grant date fair value of $310 million, $130 million and $106 million, respectively.
During the years ended December 31, 2022, 2021 and 2020, the Company recorded equity-based compensation expense on service-based RSUs of $245 million, $93 million and $76 million, respectively.
Performance-Based Awards
During the years ended December 31, 2022, 2021 and 2020, the Company awarded 3.9 million, 2.9 million and 2.2 million of performance-based RSUs, respectively, with a grant date fair value of $228 million, $150 million and $87 million, respectively, which primarily vest subject to continued employment and the Company’s receipt of performance revenues, within prescribed periods, sufficient to cover the associated equity-based compensation expense.
During the years ended December 31, 2022, 2021 and 2020, the Company recorded equity-based compensation expense on performance-based awards of $205 million, $104 million and $97 million, respectively.
During the year-ended December 31, 2022, the Company issued equity awards where the number of shares to be issued is variable based on the achievement of specified performance targets. Compensation expense is recognized over the performance period based upon the probable outcome of the performance condition and the performance-based compensation is classified as a liability, and therefore, the fair value of these awards is remeasured each reporting period. Given the number of shares to be issued in settlement of these awards is not yet known, the tables below exclude the impact of these awards.
In December 2021, the Company awarded one-time grants to the Co-Presidents of AAM of 6.0 million RSUs which vest on a cliff basis subject to continued employment over five years , with 2.0 million of those RSUs also subject to the Company’s achievement of certain fee related earnings and spread related earnings per share metrics. During the year ended December 31, 2022, the Company recorded equity-based compensation expense of $56 million for service-based awards and $24 million for performance-based awards, each related to these one-time grants.
196
The following table summarizes all RSU activity for the current period:
| Unvested | Weighted Average Grant Date Fair Value | Vested | Total Number of RSUs Outstanding | ||||||||||||||||||||
| Balance at January 1, 2022 | |||||||||||||||||||||||
| RSUs assumed in the Mergers | $ |
||||||||||||||||||||||
| Granted | $ |
||||||||||||||||||||||
| Forfeited | ( |
$ |
( |
( |
|||||||||||||||||||
| Vested | ( |
$ |
|||||||||||||||||||||
| Issued | — | — | ( |
( |
|||||||||||||||||||
| Balance at December 31, 2022 | $ |
||||||||||||||||||||||
Restricted Stock Awards
During the years ended December 31, 2022, 2021 and 2020, the Company awarded 0.5 million, 1.2 million and 0.6 million restricted stock awards, respectively, from profit sharing arrangements with a grant date fair value of $36 million, $152 million and $31 million, respectively. Additionally, 0.5 million transfer-restricted shares were granted as fully vested restricted stock awards during 2022 in an exchange for unvested performance fee rights that related to the AAM Co-Presidents’ one-time RSUs that were awarded in 2021.
During the years ended December 31, 2022, 2021 and 2020, the Company recorded equity-based compensation expense related to restricted stock awards from profit sharing arrangements of $56 million, $30 million and $26 million, respectively. As of December 31, 2022, there was $52 million of total unrecognized equity-based compensation expense related to unvested restricted stock awards, which is expected to be recognized over a weighted-average term of 1.2 years.
The following table summarizes the restricted stock award activity:
| Unvested | Weighted Average Grant Date Fair Value | Vested | Total Shares of Restricted Stock Outstanding | ||||||||||||||||||||
| Balance at January 1, 2022 | $ | ||||||||||||||||||||||
| Granted | |||||||||||||||||||||||
| Forfeited | ( |
( |
|||||||||||||||||||||
| Vested | ( |
||||||||||||||||||||||
Issued 1
|
— | ( |
( |
||||||||||||||||||||
| Balance at December 31, 2022 | $ | ||||||||||||||||||||||
1 Refers to issued shares that became freely transferable in 2022.
|
|||||||||||||||||||||||
15. Equity
Common Stock
Holders of common stock are entitled to participate in dividends from the Company on a pro rata basis.
During the years ended December 31, 2022, 2021 and 2020, the Company issued shares of common stock in settlement of vested RSUs. The Company has generally allowed holders of vested RSUs and exercised share options to settle their tax liabilities by reducing the number of shares of common stock issued to them, which the Company refers to as “net share settlement.” Additionally, the Company has generally allowed holders of share options to settle their exercise price by reducing the number of shares of common stock issued to them at the time of exercise by an amount sufficient to cover the exercise price. The net share settlement results in a liability for the Company and a corresponding accumulated deficit adjustment.
On January 3, 2022, the Company announced a share repurchase program, pursuant to which, the Company is authorized to repurchase (i) up to an aggregate of $1.5 billion of shares of its common stock in order to opportunistically reduce its share count and (ii) up to an aggregate of $1.0 billion of shares of its common stock in order to offset the dilutive impact of share issuances under its equity incentive plans. Shares of common stock may be repurchased from time to time in open market
197
transactions, in privately negotiated transactions, pursuant to a trading plan adopted in accordance with Rule 10b5-1 of the Exchange Act, or otherwise, as well as through reductions of shares that otherwise would have been issued to participants under the Company’s Equity Plan in order to satisfy associated tax obligations. The repurchase program does not obligate the Company to make any repurchases at any specific time. The program is effective until the aggregate repurchase amount that has been approved by the AGM board of directors has been expended and may be suspended, extended, modified or discontinued at any time.
The table below outlines the share activity for the years ended December 31, 2022, 2021 and 2020.
| Years ended December 31, | |||||||||||||||||
| 2022 | 2021 | 2020 | |||||||||||||||
Shares of common stock issued in settlement of vested RSUs and options exercised1
|
|||||||||||||||||
Shares issued to Apollo Opportunity Foundation2
|
|||||||||||||||||
Reduction of shares of common stock issued3
|
( |
( |
( |
||||||||||||||
Shares of common stock purchased related to share issuances and forfeitures4
|
( |
( |
|||||||||||||||
| Issuance of shares of common stock for equity-based awards | |||||||||||||||||
1 The gross value of shares issued was $ | |||||||||||||||||
2 Shares issued to Apollo Opportunity Foundation in connection with an irrevocable pledge to contribute 1.7 million shares of common stock. The gross value of shares issued for the year ended December 31, 2022 totaled $ | |||||||||||||||||
3 Cash paid for tax liabilities associated with net share settlement was $ | |||||||||||||||||
4 Certain Apollo employees receive a portion of the profit sharing proceeds of certain funds in the form of (a) restricted shares of common stock that they are required to purchase with such proceeds or (b) RSUs, in each case which equity-based awards generally vest over three years. These equity-based awards are granted under the Company's Equity Plan. To prevent dilution on account of these awards, Apollo may, in its discretion, repurchase shares of common stock on the open market and retire them. During the years ended December 31, 2022, 2021 and 2020, Apollo issued | |||||||||||||||||
During the years ended December 31, 2022, 2021 and 2020, 9,974,909 , 3,370,851 and 2,735,546 shares of common stock, respectively, were repurchased in open market transactions as part of the publicly announced share repurchase program discussed above, and such shares were subsequently canceled by the Company. The Company paid $588 million, $208 million and $91 million for these open market share repurchases during the years ended December 31, 2022, 2021 and 2020, respectively.
Dividends and Distributions
Outlined below is information regarding quarterly dividends and distributions (in millions, except per share data). Certain subsidiaries of the Company may be subject to U.S. federal, state, local and non-U.S. income taxes at the entity level and may pay taxes and/or make payments under the tax receivable agreement.
| Dividend Declaration Date | Dividend per Share of Common Stock | Payment Date | Dividend to Common Stockholders | Distribution to Non-Controlling Interest Holders in the Apollo Operating Group | Total Distributions | Distribution Equivalents on Participating Securities | ||||||||||||||||||||||||||||||||
| January 30, 2020 | $ | February 28, 2020 | $ | $ | $ | $ | ||||||||||||||||||||||||||||||||
| N/A | — | April 15, 2020 | ||||||||||||||||||||||||||||||||||||
| May 1, 2020 | May 29, 2020 | |||||||||||||||||||||||||||||||||||||
| July 30, 2020 | August 31, 2020 | |||||||||||||||||||||||||||||||||||||
| October 29, 2020 | November 30, 2020 | |||||||||||||||||||||||||||||||||||||
| Year ended December 31, 2020 | $ | $ | $ | $ | $ | |||||||||||||||||||||||||||||||||
| February 3, 2021 | $ | February 26, 2021 | $ | $ | $ | $ | ||||||||||||||||||||||||||||||||
| N/A | — | April 14, 2021 | ||||||||||||||||||||||||||||||||||||
198
| Dividend Declaration Date | Dividend per Share of Common Stock | Payment Date | Dividend to Common Stockholders | Distribution to Non-Controlling Interest Holders in the Apollo Operating Group | Total Distributions | Distribution Equivalents on Participating Securities | ||||||||||||||||||||||||||||||||
| May 4, 2021 | May 28, 2021 | |||||||||||||||||||||||||||||||||||||
| N/A | — | June 15, 2021 | ||||||||||||||||||||||||||||||||||||
| August 4, 2021 | August 31, 2021 | |||||||||||||||||||||||||||||||||||||
| N/A | — | September 15, 2021 | ||||||||||||||||||||||||||||||||||||
| November 2, 2021 | November 30, 2021 | |||||||||||||||||||||||||||||||||||||
| N/A | — | December 15, 2021 | ||||||||||||||||||||||||||||||||||||
| Year ended December 31, 2021 | $ | $ | $ | $ | $ | |||||||||||||||||||||||||||||||||
| February 11, 2022 | $ | February 28, 2022 | $ | $ | $ | $ | ||||||||||||||||||||||||||||||||
| May 5, 2022 | May 31, 2022 | |||||||||||||||||||||||||||||||||||||
| August 4, 2022 | August 31, 2022 | |||||||||||||||||||||||||||||||||||||
| November 2, 2022 | November 30, 2022 | |||||||||||||||||||||||||||||||||||||
| Year ended December 31, 2022 | $ | $ | $ | $ | $ | |||||||||||||||||||||||||||||||||
Accumulated Other Comprehensive Income (Loss)
The following provides the details and changes in AOCI:
| (In millions) | Unrealized investment gains (losses) on AFS securities without a credit allowance | Unrealized investment gains (losses) on AFS securities with a credit allowance | DAC, DSI and future policy benefits adjustments on AFS securities | Unrealized gains (losses) on hedging instruments | Foreign currency translation and other adjustments | Accumulated other comprehensive income (loss) | |||||||||||||||||||||||||||||
| Balance at December 31, 2021 | $ | ( |
$ | $ | $ | ( |
$ | ( |
$ | ( |
|||||||||||||||||||||||||
| Other comprehensive income (loss) before reclassifications | ( |
( |
( |
( |
|||||||||||||||||||||||||||||||
Less: Reclassification adjustments for gains (losses) realized1
|
( |
( |
( |
||||||||||||||||||||||||||||||||
| Less: Income tax expense (benefit) | ( |
( |
( |
( |
|||||||||||||||||||||||||||||||
| Less: Other comprehensive loss attributable to non-controlling interests | ( |
( |
( |
( |
( |
||||||||||||||||||||||||||||||
| Balance at December 31, 2022 | $ | ( |
$ | ( |
$ | $ | $ | ( |
$ | ( |
|||||||||||||||||||||||||
1 Recognized in investment related gains (losses) on the consolidated statements of operations.
| |||||||||||||||||||||||||||||||||||
199
16. Earnings per Share
The following presents basic and diluted net income (loss) per share of common stock computed using the two-class method:
| Basic and Diluted | |||||||||||||||||
| Years ended December 31, | |||||||||||||||||
| (In millions, except share and per share amounts) | 2022 | 2021 | 2020 | ||||||||||||||
| Numerator: | |||||||||||||||||
| Net income (loss) attributable to common stockholders | $ | ( |
$ | $ | |||||||||||||
Dividends declared on common stock1
|
( |
( |
( |
||||||||||||||
Dividends on participating securities2
|
( |
( |
( |
||||||||||||||
Earnings allocable to participating securities3
|
( |
||||||||||||||||
| Undistributed income (loss) attributable to common stockholders: Basic | ( |
( |
|||||||||||||||
| Denominator: | |||||||||||||||||
| Weighted average number of shares of common stock outstanding: Basic and Diluted | |||||||||||||||||
Net income (loss) per share of common stock: Basic and Diluted4
|
|||||||||||||||||
| Distributed income | $ | $ | $ | ||||||||||||||
| Undistributed income (loss) | ( |
( |
|||||||||||||||
| Net income (loss) per share of common stock: Basic and Diluted | $ | ( |
$ | $ | |||||||||||||
1 See note 15 for information regarding quarterly dividends.
| |||||||||||||||||
2 Participating securities consist of vested and unvested RSUs that have rights to dividends and unvested restricted shares.
| |||||||||||||||||
3 No allocation of undistributed losses was made to the participating securities as the holders do not have a contractual obligation to share in the losses of the Company with common stockholders.
| |||||||||||||||||
4 For the years ended December 31, 2022, 2021 and 2020, all of the classes of securities were determined to be anti-dilutive.
| |||||||||||||||||
The Company has granted RSUs that provide the right to receive, subject to vesting during continued employment, shares of common stock pursuant to the Equity Plan.
Any dividend equivalent paid to an employee on RSUs will not be returned to the Company upon forfeiture of the award by the employee. Vested and unvested RSUs that are entitled to non-forfeitable dividend equivalents qualify as participating securities and are included in the Company’s basic and diluted earnings per share computations using the two-class method. The holder of an RSU participating security would have a contractual obligation to share in the losses of the entity if the holder is obligated to fund the losses of the issuing entity or if the contractual principal or mandatory redemption amount of the participating security is reduced as a result of losses incurred by the issuing entity. The RSU participating securities do not have a mandatory redemption amount and the holders of the participating securities are not obligated to fund losses; therefore, neither the vested RSUs nor the unvested RSUs are subject to any contractual obligation to share in losses of the Company.
Prior to December 31, 2021, AAM had one Class B share outstanding, which was held by BRH Holdings GP, Ltd. (“BRH”). The voting power of the Class B share was reduced on a one vote per one AOG Unit basis in the event of an exchange of AOG Units for Class A shares, subject to the terms of AAM’s certificate of incorporation. The Class B share had no net income (loss) per share as it did not participate in Apollo’s earnings (losses) or dividends. The Class B share had no dividend rights and only a de minimis liquidation right. The Class B share represented 0.0 % and 47.2 % of the total voting power of the Class A shares and Class B share with respect to the limited matters upon which they were entitled to vote together as a single class pursuant to AAM’s governing documents as of December 31, 2021 and 2020, respectively. On December 31, 2021, the Class B share was exchanged for 10 Class A shares, which were subsequently exchanged into 10 shares of AGM common stock in the Mergers on January 1, 2022.
200
The following table summarizes the anti-dilutive securities:
| Years ended December 31, | |||||||||||||||||
| 2022 | 2021 | 2020 | |||||||||||||||
Weighted average vested RSUs |
|||||||||||||||||
| Weighted average unvested RSUs | |||||||||||||||||
| Weighted average unexercised options | |||||||||||||||||
| Weighted average AOG Units outstanding | |||||||||||||||||
| Weighted average unvested restricted shares | |||||||||||||||||
17. Related Parties
Asset Management
Due from/ to related parties
Due from/ to related parties includes:
•unpaid management fees, transaction and advisory fees and reimbursable expenses from the funds Apollo manages and their portfolio companies;
•reimbursable payments for certain operating costs incurred by these funds as well as their related parties; and
•other related party amounts arising from transactions, including loans to employees and periodic sales of ownership interests in funds managed by Apollo.
Due from related parties and Due to related parties consisted of the following as of December 31, 2022 and December 31, 2021:
| (In millions) | December 31, 2022 | December 31, 2021 | |||||||||
| Due from Related Parties: | |||||||||||
Due from funds1
|
$ | $ | |||||||||
| Due from portfolio companies | |||||||||||
| Due from employees and former employees | |||||||||||
| Total Due from Related Parties | $ | $ | |||||||||
| Due to Related Parties: | |||||||||||
Due to Former Managing Partners and Contributing Partners2
|
$ | $ | |||||||||
| Due to funds | |||||||||||
| Total Due to Related Parties | $ | $ | |||||||||
1 Includes $ | |||||||||||
2 Includes $ | |||||||||||
Tax Receivable Agreement
Prior to the consummation of the Mergers, each of the Former Managing Partners and Contributing Partners had the right to exchange vested AOG Units for Class A shares, subject to certain restrictions. All Apollo Operating Group entities have made, or will make, an election under Section 754 of the U.S. Internal Revenue Code, which will result in an adjustment to the tax basis of the assets owned by the Apollo Operating Group entities at the time an exchange was made. The election results in an increase to the tax basis of underlying assets which will reduce the amount of gain and associated tax that AGM and its subsidiaries will otherwise be required to pay in the future.
The tax receivable agreement provides for payment to the Former Managing Partners and Contributing Partners of 85 % of the amount of cash tax savings, if any, in U.S. federal, state, local and foreign income taxes the Company realizes as a result of the increases in tax basis of assets resulting from transactions and other exchanges of AOG Units for Class A shares that have occurred in prior years. AGM and its subsidiaries retain the benefit from the remaining 15 % of actual cash tax savings. If the Company does not make the required annual payment on a timely basis as outlined in the tax receivable agreement, interest is accrued on the balance until the payment date.
201
Following the closing of the Mergers, the Former Managing Partners and Contributing Partners no longer own AOG Units. Therefore, there were no new exchanges subject to the tax receivable agreement during the year ended December 31, 2022.
As a result of the exchanges of AOG Units for Class A shares during the year ended December 31, 2021, a $288 million liability was recorded to estimate the amount of the future expected payments to be made by AGM and its subsidiaries to the Former Managing Partners and Contributing Partners pursuant to the tax receivable agreement.
In April 2022, Apollo made a $51 million cash payment pursuant to the tax receivable agreement resulting from the realized tax benefit for the 2021 tax year. There was no pro rata distribution made with respect to the April 2022 payment as the Former Managing Partners and Contributing Partners ceased to be partners in the Apollo Operating Group. In April 2021, Apollo made a $40 million cash payment pursuant to the tax receivable agreement resulting from the realized tax benefit for the 2020 tax year. In connection with the April 2021 payment, the Company made a corresponding pro rata distribution of $35 million ($0.15 per AOG Unit) to the non-controlling interest holders in the Apollo Operating Group.
During the years ended December 31, 2022, 2021 and 2020, the Company remeasured the tax receivable agreement liability and recorded other income (loss), net of $(26 ) million, $10 million, and $12 million respectively, in the consolidated statements of operations. The remeasurement of the tax receivable agreement liability primarily relates to changes in estimated state and local tax rates and certain steps related to the Mergers.
AOG Unit Payment
On December 31, 2021, holders of AOG Units (other than Athene and the Company) sold and transferred a portion of such AOG Units to a wholly-owned consolidated subsidiary of the Company, in exchange for an amount equal to $3.66 multiplied by the total number of AOG Units held by such holders immediately prior to such transaction. The remainder of the AOG Units held by such holders were exchanged for shares of AGM common stock concurrently with the consummation of the Mergers on January 1, 2022.
As of December 31, 2022, the outstanding payable amount due to Former Managing Partners and Contributing Partners was $351 million, which is payable in equal installments through December 31, 2024.
Due from Employees and Former Employees
As of December 31, 2022 and December 31, 2021, due from related parties includes various amounts due to Apollo, including employee loans and return of profit-sharing distributions. As of December 31, 2022 and December 31, 2021, the balance includes interest-bearing employee loans receivable of $9 million and $18 million, respectively. The outstanding principal amount of the loans as well as all accrued and unpaid interest is required to be repaid at the earlier of the eighth anniversary of the date of the relevant loan or at the date of the relevant employee’s resignation.
The receivable from certain employees and former employees includes an amount for the potential return of profit-sharing distributions that would be due if certain funds were liquidated of $72 million and $65 million at December 31, 2022 and December 31, 2021, respectively.
Indemnity
Certain of the performance revenues Apollo earns from funds may be subject to repayment by its subsidiaries that are general partners of the funds in the event that certain specified return thresholds are not ultimately achieved. The Former Managing Partners, Contributing Partners and certain other investment professionals have personally guaranteed, subject to certain limitations, the obligations of these subsidiaries in respect of this obligation. Such guarantees are several and not joint and are limited to a particular individual’s distributions. Apollo has agreed to indemnify each of the Former Managing Partners and certain Contributing Partners against all amounts that they pay pursuant to any of these personal guarantees in favor of certain funds that it manages (including costs and expenses related to investigating the basis for or objecting to any claims made in respect of the guarantees) for all interests that the Former Managing Partners and Contributing Partners contributed or sold to the Apollo Operating Group.
Apollo recorded an indemnification liability of $13 million and $13 million as of December 31, 2022 and December 31, 2021, respectively.
202
Due to Related Parties
Based upon an assumed liquidation of certain of the funds Apollo manages, it has recorded a general partner obligation to return previously distributed performance allocations, which represents amounts due to certain funds. The obligation is recognized based upon an assumed liquidation of a fund’s net assets as of the reporting date. The actual determination and any required payment would not take place until the final disposition of a fund’s investments based on the contractual termination of the fund or as otherwise set forth in the respective governing document of the fund.
Apollo recorded general partner obligations to return previously distributed performance allocations related to certain funds of $107 million and $81 million as of December 31, 2022 and December 31, 2021.
Athora
Apollo, through ISGI, provides investment advisory services to certain portfolio companies of funds managed by Apollo and Athora, a strategic liabilities platform that acquires or reinsures blocks of insurance business in the German and broader European life insurance market (collectively, the “Athora Accounts”). Apollo had equity commitments outstanding to Athora of up to $343 million as of December 31, 2022, subject to certain conditions.
Athora Sub-Advised
Apollo provides sub-advisory services with respect to a portion of the assets in certain portfolio companies of funds managed by Apollo and the Athora Accounts. Apollo broadly refers to “Athora Sub-Advised” assets as those assets in the Athora Accounts which Apollo explicitly sub-advises as well as those assets in the Athora Accounts which are invested directly in funds and investment vehicles Apollo manages.
Apollo earns a base management fee on the aggregate market value of substantially all of the investment accounts of or relating to Athora and also a sub-advisory fee on the Athora Sub-Advised assets, which varies depending on the specific asset class.
See “—Athora” in the Retirement Services section below for further details on Athene’s relationship with Athora.
Regulated Entities and Affiliated Service Providers
Apollo Global Securities, LLC (“AGS”) is a registered broker-dealer with the SEC and is a member of the Financial Industry Regulatory Authority, subject to the minimum net capital requirements of the SEC. AGS was in compliance with these requirements as of December 31, 2022. From time to time AGS, as well as other Apollo affiliates, provide services to related parties of Apollo, including Apollo funds and their portfolio companies, whereby the Company or its affiliates earn fees for providing such services.
Griffin Capital Securities, LLC (“GCS”) is a registered broker-dealer with the SEC and is a member of the Financial Industry Regulatory Authority, subject to the minimum net capital requirements of the SEC. GCS was in compliance with these requirements as of December 31, 2022.
Investment in SPACs
In October 2020, APSG I, a SPAC sponsored by Apollo, completed an initial public offering, ultimately raising total gross proceeds of $817 million. APSG Sponsor, L.P., a subsidiary of Apollo, held Class B ordinary shares of APSG I, and consolidated it as a VIE. In May 2022, APSG I completed a business combination with American Express Global Business Travel. As a result of the business combination, Apollo no longer consolidates APSG I as a VIE. The deconsolidation resulted in an unrealized gain of $162 million, which includes $82 million of unrealized gains related to previously held Class B ordinary shares, which converted to Class A shares of the newly merged entity (“GBTG”), presented in net gains from investment activities within Other income (loss) - Asset Management in the consolidated statements of operations. Apollo continues to hold a non-controlling interest in GBTG at fair value, elected under the fair value option, which is primarily presented within Investments (Asset Management) in the consolidated statements of financial condition.
On February 12, 2021, APSG II, a SPAC sponsored by Apollo, completed an initial public offering, raising total gross proceeds of $690 million. APSG Sponsor II, L.P., a subsidiary of Apollo, holds Class B ordinary shares of APSG II, and consolidates
203
APSG II as a VIE. In December 2022, APSG II entered into a non-binding letter of intent regarding a potential initial business combination and now has until May 12, 2023 to complete its initial business combination.
On July 13, 2021, Acropolis Infrastructure Acquisition Corp. (“Acropolis”), a SPAC sponsored by Apollo, completed an initial public offering, ultimately raising total gross proceeds of $345 million. Acropolis Infrastructure Acquisition Sponsor, L.P., a subsidiary of Apollo, holds Class B common stock of Acropolis, and consolidates Acropolis as a VIE.
As described in note 2, the Company consolidates entities that are VIEs for which the Company has been designated as the primary beneficiary. Through its interests in the respective sponsors, the Company has the primary beneficiary power to direct the activities that most significantly impact the economic performance of these SPACs. In addition, the Company’s combined interests in these VIEs are significant. Assets and liabilities of the consolidated SPACs are shown within the respective line items of the consolidated financial statements, as outlined below.
The tables below present the financial information of these SPACs in aggregate:
| (In millions) | December 31, 2022 | December 31, 2021 | |||||||||
| Assets: | |||||||||||
| Cash and cash equivalents | $ | $ | |||||||||
| Restricted cash and cash equivalents | |||||||||||
| U.S. Treasury securities, at fair value | |||||||||||
| Other assets | |||||||||||
| Total Assets | $ |
|
$ |
|
|||||||
| Liabilities, Redeemable non-controlling interests and Stockholders’ Equity | |||||||||||
| Liabilities: | |||||||||||
| Accounts payable and accrued expenses | $ | $ | |||||||||
| Due to related parties | |||||||||||
| Other liabilities | |||||||||||
| Total Liabilities |
|
|
|||||||||
| Redeemable non-controlling interests: | |||||||||||
| Redeemable non-controlling interests | |||||||||||
| Stockholders’ Equity (Deficit): | |||||||||||
| Additional paid in capital | ( |
( |
|||||||||
| Retained earnings | |||||||||||
| Total Stockholders’ Equity (Deficit) | ( |
( |
|||||||||
| Total Liabilities, Redeemable non-controlling interests and Stockholders’ Equity | $ |
|
$ |
|
|||||||
| Years ended December 31, | |||||||||||||||||
| (In millions) | 2022 | 2021 | 2020 | ||||||||||||||
| Expenses: | |||||||||||||||||
| General, administrative and other | $ | $ | $ | ||||||||||||||
| Total Expenses | |||||||||||||||||
| Other Income (Loss): | |||||||||||||||||
| Net gains (losses) from investment activities | |||||||||||||||||
| Interest income | |||||||||||||||||
| Other income (loss), net | ( |
||||||||||||||||
| Total Other Income (Loss) | |||||||||||||||||
| Income (loss) before income tax provision | ( |
( |
|||||||||||||||
| Income tax provision | ( |
||||||||||||||||
| Net Income (Loss) Attributable to Apollo Global Management, Inc. | ( |
( |
|||||||||||||||
204
Retirement Services
AAA
During 2022, Athene contributed $8.0 billion of certain of its alternative investments to AAA in exchange for limited partnership interests in AAA. Athene consolidates AAA as a VIE. Apollo established AAA for the purpose of providing a single vehicle through which Athene and third-party investors can participate in a portfolio of alternative investments, which include those managed by Apollo. Additionally, the Company believes AAA enhances its ability to increase alternative assets under management by raising capital from third parties, which will allow Athene to achieve greater scale and diversification for alternatives. Third-party investors began to invest in AAA on July 1, 2022.
Wheels Donlen
Athene has a limited partnership investment in Athene Freedom Parent, LP (“Athene Freedom”), for which Apollo is the general partner, and which Athene contributed to AAA during the second quarter of 2022. Athene Freedom indirectly invests in both Wheels, Inc. (“Wheels”) and Donlen, LLC (“Donlen”). During the year ended December 31, 2022, Athene Freedom also invested in LeasePlan USA, Inc. (“LeasePlan). As of December 31, 2022, Athene owns $1,024 million ABS and corporate debt securities issued by Wheels, Donlen and LeasePlan, which are held as investments in related parties on the consolidated statements of financial condition.
Athora
Athene has a cooperation agreement with Athora, pursuant to which, among other things, (1) for a period of 30 days from the receipt of notice of a cession, Athene has the right of first refusal to reinsure (i) up to 50 % of the liabilities ceded from Athora’s reinsurance subsidiaries to Athora Life Re Ltd. and (ii) up to 20 % of the liabilities ceded from a third party to any of Athora’s insurance subsidiaries, subject to a limitation in the aggregate of 20 % of Athora’s liabilities, (2) Athora agreed to cause its insurance subsidiaries to consider the purchase of certain funding agreements and/or other spread instruments issued by Athene’s insurance subsidiaries, subject to a limitation that the fair market value of such funding agreements purchased by any of Athora’s insurance subsidiaries may generally not exceed 3 % of the fair market value of such subsidiary’s total assets, (3) Athene provides Athora with a right of first refusal to pursue acquisition and reinsurance transactions in Europe (other than the UK) and (4) Athora provides Athene and its subsidiaries with a right of first refusal to pursue acquisition and reinsurance transactions in North America and the UK. Notwithstanding the foregoing, pursuant to the cooperation agreement, Athora is only required to use its reasonable best efforts to cause its subsidiaries to adhere to the provisions set forth in the cooperation agreement and therefore Athora’s ability to cause its subsidiaries to act pursuant to the cooperation agreement may be limited by, among other things, legal prohibitions or the inability to obtain the approval of the board of directors or other applicable governing body of the applicable subsidiary, which approval is solely at the discretion of such governing body. As of December 31, 2022, Athene had not exercised its right of first refusal to reinsure liabilities ceded to Athora’s insurance or reinsurance subsidiaries.
The following table summarizes Athene’s investments in Athora:
| (In millions) | December 31, 2022 | ||||
| Investment fund | $ | ||||
| Non-redeemable preferred equity securities | |||||
| Total investment in Athora | $ | ||||
Additionally, as of December 31, 2022, Athene had $59 million of funding agreements outstanding to Athora. Athene also has commitments to make additional investments in Athora of $551 million as of December 31, 2022.
Catalina
Athene has an investment in Apollo Rose II (B) (“Apollo Rose”) which Athene consolidates as a VIE. Apollo Rose holds equity interests in Catalina Holdings (Bermuda) Ltd. (“Catalina”). During the fourth quarter of 2022, Athene entered into a strategic modco reinsurance agreement with Catalina General Insurance Ltd., which is a subsidiary of Catalina, to cede certain inforce funding agreements. Athene elected the fair value option on this agreement and recognized a $142 million liability as of December 31, 2022, which is included in other liabilities on the consolidated statements of financial condition.
205
Venerable
Athene has coinsurance and modco agreements with Venerable Insurance and Annuity Company (“VIAC”). VIAC is a related party due to Athene’s minority equity investment in its holding company’s parent, VA Capital Company LLC (“VA Capital”), which was $240 million as of December 31, 2022. The minority equity investment in VA Capital is included in investments in related parties on the consolidated statements of financial condition and accounted for as an equity method investment. VA Capital is owned by a consortium of investors, led by affiliates of Apollo, Crestview Partners III Management, LLC and Reverence Capital Partners L.P., and is the parent of Venerable, which is the parent of VIAC. Additionally, Athene has term loans receivable from Venerable due in 2033, which is included in investments in related parties on the consolidated statements of financial condition. The loans are held at fair value and were $303 million as of December 31, 2022. While management viewed the overall transactions with Venerable as favorable to Athene, the stated interest rate of 6.257 % on the term loans to Venerable represented a below-market interest rate, and management considered such rate as part of its evaluation and pricing of the reinsurance transactions.
PK AirFinance
Athene has investments in PK AirFinance (“PK Air”), an aviation lending business with a portfolio of loans (“Aviation Loans”). The Aviation Loans are generally fully secured by aircraft leases and aircraft and are securitized by a special purpose vehicle (“SPV”) for which Apollo acts as ABS manager (“ABS-SPV”). The ABS-SPV issues tranches of senior notes and subordinated notes, which are secured by the Aviation Loans. Athene has purchased both senior and subordinated notes of PK Air, which are included in investments in related parties on the consolidated statements of financial condition. During the first quarter of 2022, Athene contributed its investment in the subordinated notes to PK Air Holdings, LP, and then contributed PK Air Holdings, LP to AAA during the second quarter of 2022. As of December 31, 2022, Athene holds $1.2 billion of PK Air senior notes and has commitments to make additional investments in PK Air of $1.2 billion.
Apollo/Athene Dedicated Investment Program (“ADIP”)
Athene’s subsidiary, Athene Co-Invest Reinsurance Affiliate Holding Ltd. (together with its subsidiaries, “ACRA”) is partially owned by ADIP, a series of funds managed by Apollo. Athene’s subsidiary, ALRe, currently holds 36.55 % of the economic interests in ACRA and all of ACRA’s voting interests, with ADIP holding the remaining 63.45 % of the economic interests. During the year ended December 31, 2022, Athene received capital contributions of $1,047 million from ADIP and paid dividends of $63 million to ADIP.
18. Commitments and Contingencies
Investment Commitments
The Company has unfunded capital commitments of $0.6 billion as of December 31, 2022 related to the funds it manages. Separately, Athene had commitments to make investments, primarily capital contributions to investment funds, inclusive of related party commitments discussed previously, of $17.8 billion as of December 31, 2022. The Company expects most of the current commitments will be invested over the next five years; however, these commitments could become due any time upon counterparty request.
Contingent Obligations
Performance allocations with respect to certain funds are subject to reversal in the event of future losses to the extent of the cumulative revenues recognized in income to date. If all of the existing investments became worthless, the amount of cumulative revenues that have been recognized by Apollo through December 31, 2022 and that could be reversed approximates $4.6 billion. Performance allocations are affected by changes in the fair values of the underlying investments in the funds that Apollo manages. Valuations, on an unrealized basis, can be significantly affected by a variety of external factors including, but not limited to, bond yields and industry trading multiples. Movements in these items can affect valuations quarter to quarter even if the underlying business fundamentals remain stable. Management views the possibility of all of the investments becoming worthless as remote.
206
Additionally, at the end of the life of certain funds, Apollo may be obligated as general partner, to repay the funds’ performance allocations received in excess of what was ultimately earned. This obligation amount, if any, will depend on final realized values of investments at the end of the life of each fund or as otherwise set forth in the partnership agreement of the fund.
Certain funds may not generate performance allocations as a result of unrealized and realized losses that are recognized in the current and prior reporting periods. In certain cases, performance allocations will not be generated until additional unrealized and realized gains occur. Any appreciation would first cover the deductions for invested capital, unreturned organizational expenses, operating expenses, management fees and priority returns based on the terms of the respective fund agreements.
The Company, along with a third-party institutional investor, has committed to provide financing to a consolidated VIE that invests across Apollo’s capital markets platform (such VIE, the “Apollo Capital Markets Partnership”). Pursuant to these arrangements, the Company has committed equity financing to the Apollo Capital Markets Partnership. The Apollo Capital Markets Partnership also has a revolving credit facility with Sumitomo Mitsui Banking Corporation, as lead arranger, administrative agent and letter of credit issuer, Mizuho Bank Ltd., and other lenders party thereto, pursuant to which it may borrow up to $2.25 billion. The revolving credit facility, which has a final maturity date of April 1, 2025, is non-recourse to the Company, except that the Company provided customary comfort letters with respect to its capital contributions to the Apollo Capital Markets Partnership. As of December 31, 2022, the Apollo Capital Markets Partnership had funded commitments of $518 million, on a net basis, to transactions across Apollo’s capital markets platform, all of which were funded through the revolving credit facility and other asset-based financing. No capital had been funded by the Company to the Apollo Capital Markets Partnership pursuant to its commitment.
Whether the commitments of the Apollo Capital Markets Partnership are actually funded, in whole or in part, depends on the contractual terms of such commitments, including the satisfaction or waiver of any conditions to closing or funding. It is expected that between the time the Apollo Capital Markets Partnership makes a commitment and funding of such commitment, efforts will be made to syndicate such commitment to, among others, third parties, which should reduce its risk when committing to certain transactions. The Apollo Capital Markets Partnership may also, with respect to a particular transaction, enter into other arrangements with third parties which reduce its commitment risk.
In connection with the acquisition of Stone Tower in 2012, Apollo agreed to pay its former owners a specified percentage of future performance revenues earned from certain of its funds, CLOs, and strategic investment accounts. This obligation liability was determined based on the present value of estimated future performance revenue payments and is recorded in other liabilities. The fair value of the remaining contingent obligation was $55 million and $126 million as of December 31, 2022 and December 31, 2021, respectively. This contingent consideration obligation is remeasured to fair value at each reporting period until the obligations are satisfied. The changes in the fair value of the Stone Tower contingent consideration obligation is reflected in profit sharing expense in the consolidated statements of operations.
In connection with the acquisition of Griffin Capital’s U.S. asset management business on May 3, 2022, Apollo agreed to pay its former owners certain share-based consideration contingent on specified AUM and capital raising thresholds. This obligation was determined based on the present value of estimated future performance relative to such thresholds and is recorded in other liabilities. The fair value of the contingent obligation liabilities were approximately $31 million and $36 million as of December 31, 2022 and the date of acquisition, respectively. This contingent consideration obligation is remeasured to fair value at each reporting period until the respective thresholds are met such that the contingencies are satisfied. The changes in the fair value of the Griffin Capital contingent consideration obligation are reflected in other income (loss) in the consolidated statements of income.
Funding Agreements
Athene is a member of the FHLB and, through its membership, has issued funding agreements to the FHLB in exchange for cash advances. As of December 31, 2022, Athene had $3.7 billion of FHLB funding agreements outstanding. Athene is required to provide collateral in excess of the funding agreement amounts outstanding, considering any discounts to the securities posted and prepayment penalties.
207
Athene has a FABN program, which allows Athene Global Funding, a special purpose, unaffiliated statutory trust, to offer its senior secured medium-term notes. Athene Global Funding uses the net proceeds from each sale to purchase one or more funding agreements from Athene. As of December 31, 2022, Athene had $21.0 billion of board-authorized FABN funding agreements outstanding. Athene had $13.5 billion of board-authorized FABN capacity remaining as of December 31, 2022.
Athene established a secured funding agreement backed repurchase agreement (“FABR”) program, in which a special-purpose, unaffiliated entity enters into repurchase agreements with a bank and the proceeds of the repurchase agreements are used by the special purpose entity to purchase funding agreements from Athene. As of December 31, 2022, Athene had $3.0 billion of FABR funding agreements outstanding.
Pledged Assets and Funds in Trust (Restricted Assets)
Athene’s total restricted assets included on the consolidated statements of financial condition are as follows:
| (In millions) | December 31, 2022 | ||||
| AFS securities | $ | ||||
| Trading securities | |||||
| Equity securities | |||||
| Mortgage loans | |||||
| Investment funds | |||||
| Derivative assets | |||||
| Short-term investments | |||||
| Other investments | |||||
| Restricted cash and cash equivalents | |||||
| Total restricted assets | $ | ||||
The restricted assets are primarily related to reinsurance trusts established in accordance with coinsurance agreements and the FHLB and FABR funding agreements described above.
Letters of Credit
Athene has undrawn letters of credit totaling $1.4 billion as of December 31, 2022. These letters of credit were issued for Athene’s reinsurance program and have expirations through July 28, 2025.
Atlas
On February 8, 2023 and February 23, 2023, the Company and CS undertook the first two closes of their previously announced transaction whereby Atlas acquired certain assets of the CS Securitized Products Group. A subsidiary of the Company has issued an assurance letter to CS to guarantee the full five year deferred purchase obligation of Atlas in the amount of $3.3 billion. The fair value of the liability related to AGM’s guarantee is not material to the Company’s consolidated financial statements.
Litigation and Regulatory Matters
The Company is party to various legal actions arising from time to time in the ordinary course of business, including claims and lawsuits, arbitrations, reviews, investigations or proceedings by governmental and self-regulatory agencies regarding the Company’s business.
In 2000 and 2001, two insurance companies which were subsequently merged into AAIA, a wholly owned subsidiary of Athene, purchased broad based variable corporate-owned life insurance (“COLI”) policies from American General Life Insurance Company (“American General”). In January 2012, the COLI policy administrator delivered to AAIA a supplement to the existing COLI policies and advised that American General and ZC Resource Investment Trust (“ZC Trust”) had unilaterally implemented changes set forth in the supplement that, if effective, would: (1) potentially negatively impact the crediting rate for the policies and (2) change the exit and surrender protocols set forth in the policies. In March 2013, AAIA filed suit against American General, ZC Trust, and ZC Resource LLC in Chancery Court in Delaware, seeking, among other relief, a declaration that the changes set forth in the supplement were ineffectual and in breach of the parties’ agreement. The parties filed cross
208
motions for judgment as a matter of law, and the court granted defendants’ motion and dismissed without prejudice on ripeness grounds. The issue that negatively impacts the crediting rate for one of the COLI policies has subsequently been triggered and, on April 3, 2018, AAIA filed suit against the same defendants in Chancery Court in Delaware seeking substantially similar relief. Defendants moved to dismiss and the court heard oral arguments on February 13, 2019. The court issued an opinion on July 31, 2019 that did not address the merits, but found that the Chancery Court did not have jurisdiction over AAIA’s claims and directed AAIA to either amend our complaint or transfer the matter to Delaware Superior Court. The matter was transferred to the Delaware Superior Court. Defendants renewed their motion to dismiss and the Superior Court heard oral arguments on December 18, 2019. The Superior Court issued an opinion on May 18, 2020 in which it granted in part and denied in part defendants’ motion. The Superior Court denied defendants’ motion with respect to the issue that negatively impacts the crediting rate for one of the COLI policies, which issue proceeded to discovery. The Superior Court granted defendants’ motion and dismissed without prejudice on ripeness grounds claims related to the exit and surrender protocols set forth in the policies, and dismissed defendant ZC Resource LLC. If the supplement were to have been deemed effective, the purported changes to the policies could have impaired AAIA’s ability to access the value of guarantees associated with the policies. The parties engaged in discovery as well as discussions concerning whether the matter could be resolved without further litigation and, at the request of the parties, on August 11, 2021, the court entered an Amended Scheduling Order setting the trial date for June 2023. On December 27, 2021, the parties agreed in principle to a settlement, pursuant to which AAIA will be able to surrender the policies at any time and receive proceeds within six months. During the year ended December 31, 2021, Athene recorded an impairment of the COLI asset of $53 million, and an adjustment to deferred tax liabilities of $47 million, to reflect the terms of the settlement. The Superior Court formally dismissed the matter on December 28, 2022. Athene surrendered the policies effective December 30, 2022.
On August 3, 2017, a complaint was filed in the United States District Court for the Middle District of Florida against AAM, a senior partner of Apollo and a former principal of Apollo by Michael McEvoy on behalf of a purported class of employees of subsidiaries of CEVA Group, LLC (“CEVA Group”) who purchased shares in CEVA Investment Limited (“CIL”), the former parent company of CEVA Group. The complaint alleged that the defendants breached fiduciary duties to and defrauded the plaintiffs by inducing them to purchase shares in CIL and subsequently participating in a debt restructuring of CEVA Group in which shareholders of CIL did not receive a recovery. The complaint was determined by a bankruptcy court to be void ab initio because it asserted claims that were property of CIL’s bankruptcy estate. McEvoy subsequently revised his complaint to attempt to assert claims that do not belong to CIL. The amended complaint no longer named any individual defendants, but Apollo Management VI, L.P. and CEVA Group were added as defendants. The amended complaint sought damages of approximately €30 million and asserts, among other things, claims for violations of the Investment Advisers Act, breach of fiduciary duties, and breach of contract. On December 7, 2018, McEvoy filed his amended complaint in the District Court for the Middle District of Florida. On January 6, 2020, the Florida court granted in part Apollo’s motion to dismiss, dismissing McEvoy’s Investment Advisers Act claim with prejudice, and denying without prejudice Apollo’s motion with respect to the remaining claims, and directing the parties to conduct limited discovery, and submit new briefing, solely with respect to the statute of limitations. On July 30, 2020, Apollo and CEVA filed a joint motion for summary judgment on statute of limitations grounds. On June 29, 2021, the district court issued a decision denying the defendants’ joint motion for summary judgment on statute of limitations grounds, and set deadlines on July 23, 2021 for the plaintiff to file an amended complaint and August 20, 2021 for defendants to answer or move to dismiss the amended complaint. Plaintiff filed his second amended complaint on July 23, 2021 which added alleged grounds for tolling the statute of limitations. Also on July 23, 2021, the defendants filed a joint motion for reconsideration with respect to aspects of the district court’s June 29, 2021 decision. On March 10, 2022, the court granted defendants’ motion for reconsideration and thereafter entered judgment in defendants’ favor. On April 7, 2022, Plaintiff filed a motion to alter or amend the court’s order of March 10. The defendants, including Apollo, opposed that motion on April 28, 2022. The court denied Plaintiff’s motion on May 26, 2022. Plaintiff has appealed the court’s decisions to the Eleventh Circuit; the appeal is fully briefed and pending as of this date. Apollo believes that Plaintiff’s appeal is without merit. No reasonable estimate of possible loss, if any, can be made at this time.
On December 21, 2017, several entities referred to collectively as “Harbinger” commenced an action in New York Supreme Court captioned Harbinger Capital Partners II LP et al. v. Apollo Global Management LLC, et al. (No. 657515/2017). The complaint named as defendants AAM, and funds managed by Apollo that invested in SkyTerra Communications, Inc. (“SkyTerra”), among others. The complaint alleged that during the period of Harbinger’s various equity and debt investments in SkyTerra from 2004 to 2010, the defendants concealed from Harbinger material defects in SkyTerra technology. The complaint further alleged that Harbinger would not have made investments in SkyTerra totaling approximately $1.9 billion had it known of the defects, and that the public disclosure of these defects ultimately led to SkyTerra filing for bankruptcy in 2012 (after it had been renamed LightSquared). The complaint sought $1.9 billion in damages, as well as punitive damages, interest, costs, and fees. On June 12, 2019, Harbinger voluntarily discontinued the state action without prejudice. On June 8, 2020, Harbinger refiled its litigation in New York Supreme Court, captioned Harbinger Capital Partners II, LP et al. v. Apollo Global
209
Management, LLC et al. (No. 652342/2020). The complaint adds eight new defendants and three new claims relating to Harbinger’s contention that the new defendants induced Harbinger to buy CCTV One Four Holdings, LLC (“CCTV”) to support SkyTerra’s network even though they allegedly knew that the network had material defects. On November 23, 2020, Defendants refiled a bankruptcy motion, and on November 24, 2020, filed in the state court a motion to stay the state court proceedings pending a ruling by the bankruptcy court on the bankruptcy motion. On February 1, 2021, the bankruptcy court denied the bankruptcy motion. On March 31, 2021, Defendants filed their motions to dismiss the New York Supreme Court action. Hearings were held on the motions to dismiss on February 15, 2022 and February 18, 2022, and the motions remain pending. Apollo believes the claims in this action are without merit. Because this action is in the early stages, no reasonable estimate of possible loss, if any, can be made at this time.
On November 1, 2019, plaintiff Benjamin Fongers filed a putative class action in Illinois Circuit Court, Cook County, against CareerBuilder, LLC (“CareerBuilder”) and AAM. Plaintiff alleges that in March 2019, CareerBuilder changed its compensation plan so that sales representatives such as Fongers would (i) receive reduced commissions; and (ii) only be able to receive commissions for accounts they originated that were not reassigned to anyone else, a departure from the earlier plan. Plaintiff also claims that the plan applied retroactively to deprive sales representatives of commissions to which they were earlier entitled. Plaintiff alleges that AAM exercises complete control over CareerBuilder and thus, CareerBuilder acts as AAM’s agent. Based on these allegations, Plaintiff alleges claims against both defendants for breach of written contract, breach of implied contract, unjust enrichment, violation of the Illinois Sales Representative Act, and violation of the Illinois Wage and Payment Collection Act. The defendants removed the action to the Northern District of Illinois on December 5, 2019, and Plaintiff moved to remand on January 6, 2020. On October 21, 2020, the district court granted the motion to remand. On January 11, 2021, the district court ordered the clerk of court to take the necessary steps to transfer the case back to Illinois Circuit Court, Cook County. On March 8, 2021, Plaintiff filed a motion under 28 U.S.C. § 1447(c) to recover attorneys’ fees of approximately $35,000 for the remand briefing. Defendants filed their opposition on March 31, 2021, and Plaintiff replied on April 14, 2021. Defendants filed motions to dismiss the complaint in the Illinois Circuit Court, Cook County on June 11, which were fully briefed on August 13, 2021. CareerBuilder has also filed a Motion for a Protective Order and to Stay Discovery pending the outcome of the motions to dismiss. On February 7, 2022, the court held a hearing on the motions to dismiss and the request to stay discovery. At the hearing, the court took the motions to dismiss under advisement and granted CareerBuilder’s motion to stay discovery. On March 11, 2022, the parties filed a Notice of Settlement notifying the court that the parties have reached an agreement to resolve the case in full, and the court approved the settlement on November 14, 2022. The settlement required no payment from any Apollo-affiliated defendants.
In March 2020, Frank Funds, which claims to be a former shareholder of MPM Holdings, Inc. (“MPM”), commenced an action in the Delaware Court of Chancery, captioned Frank Funds v. Apollo Global Management, Inc., et al., C.A. No. 2020-0130, against AAM, certain former MPM directors (including three Apollo officers and employees), and members of the consortium that acquired MPM in a May 2019 merger. The complaint asserts, on behalf of a putative class of former MPM shareholders, a claim against Apollo for breach of its fiduciary duties as MPM’s alleged controlling shareholder in connection with the May 2019 merger. Frank Funds seeks unspecified compensatory damages. On July 23, 2019, a group of former MPM shareholders filed an appraisal petition in Delaware Chancery Court seeking the fair value of their MPM shares that were purchased through MPM’s May 15, 2019 merger, in an action captioned In re Appraisal of MPM Holdings, Inc., C.A. No. 2019-0519 (Del. Ch.). On June 3, 2020, petitioners moved for leave to file a verified amended appraisal petition and class-action complaint that included claims for breach of fiduciary duty and/or aiding and abetting breaches of fiduciary duty against AAM, the Apollo-affiliated fund that owned MPM’s shares before the merger, certain former MPM directors (including three Apollo employees), and members of the consortium that acquired MPM, based on alleged actions related to the May 2019 merger. The petitioners also sought to consolidate their appraisal proceeding with the Frank Funds action. On November 13, 2020, the Chancery Court granted the parties’ stipulated order to consolidate the two matters, and on December 21, 2020, the Chancery Court granted petitioners’ motion for leave to file the proposed amended complaint. This new consolidated action is captioned In Re MPM Holdings Inc. Appraisal and Stockholder Litigation, C.A. No. 2019-0519 (Del Ch.). On January 13, 2022, the Chancery Court denied Apollo’s motion to dismiss. Apollo believes the claims in this action are without merit. Because this action is in the early stages, no reasonable estimate of possible loss, if any, can be made at this time.
On August 4, 2020, a putative class action complaint was filed in the United States District Court for the District of Nevada against PlayAGS Inc. (“PlayAGS”), all of the members of PlayAGS’s board of directors (including three directors who are affiliated with Apollo), certain underwriters of PlayAGS (including Apollo Global Securities, LLC), as well as AAM, Apollo Investment Fund VIII, L.P., Apollo Gaming Holdings, L.P., and Apollo Gaming Voteco, LLC (these last four parties, together, the “Apollo Defendants”). The complaint asserts claims against all defendants arising under the Securities Act of 1933 in connection with certain secondary offerings of PlayAGS stock conducted in August 2018 and March 2019, alleging that the registration statements issued in connection with those offerings did not fully disclose certain business challenges facing
210
19. Statutory Requirements
Athene’s insurance and reinsurance subsidiaries are subject to insurance laws and regulations in the jurisdictions in which they operate, including Bermuda and the U.S. Certain regulations include restrictions that limit the dividends or other distributions, such as loans or cash advances, available to shareholders without prior approval of the insurance regulatory authorities. The differences between financial statements prepared for insurance regulatory authorities and U.S. GAAP financial statements vary by jurisdiction.
Bermuda statutory requirements
ALRe, AARe and Athene Co-Invest Reinsurance Affiliate 1A Ltd. (“ACRA 1A”, and together with its subsidiaries, “ACRA”) are each licensed by the Bermuda Monetary Authority (“BMA”) as long-term insurers and are subject to the Insurance Act 1978, as amended (Bermuda Insurance Act) and regulations promulgated thereunder. The BMA implemented the Economic Balance Sheet (EBS) framework into the Bermuda Solvency Capital Requirement (“BSCR”), which was granted equivalence to the European Union’s Directive (2009/138/EC) (“Solvency II”).
Under the Bermuda Insurance Act, long-term insurers are required to maintain minimum statutory capital and surplus to meet the minimum margin of solvency (“MMS”) and minimum economic statutory capital and surplus (EBS capital and surplus) to meet the Enhanced Capital Requirement (“ECR”). For Athene’s Class C reinsurer, ACRA 1A, MMS is equal to the greater of $500,000 , 1.5 % of the total statutory assets or 25 % of ECR. For Athene’s Class E reinsurers, ALRe and AARe, MMS is equal to the greater of $8 million, 2 % of the first $500 million of statutory assets plus 1.5 % of statutory assets above $500 million or 25 % of ECR. For each class, the ECR is calculated based on a risk-based capital model where risk factor charges are applied to the EBS. The ECR is floored at the MMS. As of December 31, 2022, Athene’s Bermuda subsidiaries were in excess of the minimum levels required. For Athene’s Bermuda reinsurance subsidiaries, the ECR is the binding regulatory constraint. The following represents the EBS capital and surplus and BSCR ratios:
| December 31, 2022 | |||||||||||
| (In millions, except percentages) | EBS capital & surplus | BSCR ratio | |||||||||
| ALRe | $ | % | |||||||||
| AARe | % | ||||||||||
| ACRA 1A | % | ||||||||||
Under the EBS framework, statutory financial statements are generally equivalent to U.S. GAAP financial statements, with the exception of permitted practices granted by the BMA. Athene’s Bermuda subsidiaries have permission in the statutory financial statements to use amortized cost instead of fair value as the basis for certain investments. Additionally, Athene’s Bermuda subsidiaries use U.S. statutory reserving principles for the calculation of insurance reserves instead of U.S. GAAP, subject to the reserves being proved adequate based on cash flow testing.
211
The following represents the effect of the permitted practices to the statutory financial statements:
| December 31, 2022 | |||||||||||||||||
| (In millions) | ALRe | AARe | ACRA 1A | ||||||||||||||
| Increase (decrease) to capital and surplus due to permitted practices | $ | $ | $ | ||||||||||||||
| Increase (decrease) to statutory net income due to permitted practices | |||||||||||||||||
Under the Bermuda Insurance Act, Athene’s Bermuda subsidiaries are prohibited from paying a dividend in an amount exceeding 25% of the prior year’s statutory capital and surplus, unless at least two members of the companies’ respective board of directors and its principal representative in Bermuda sign and submit to the BMA an affidavit attesting that a dividend in excess of this amount would not cause the subsidiary to fail to meet its relevant margins. In certain instances, the Bermuda subsidiary would also be required to provide prior notice to the BMA in advance of the payment of dividends. In the event that such an affidavit is submitted to the BMA, and further subject to meeting the MMS and ECR requirements, a Bermuda subsidiary is permitted to distribute up to the sum of 100% of statutory surplus and an amount less than 15% of statutory capital. Distributions in excess of this amount require the approval of the BMA. The following represents the maximum distribution Athene’s Bermuda subsidiaries would be permitted to remit to its parent without the need for prior approval:
| (In millions) | December 31, 2022 | ||||
| ALRe | $ | ||||
| AARe | |||||
| ACRA 1A | |||||
U.S. Statutory Requirements
Athene’s regulated U.S. subsidiaries and the corresponding insurance regulatory authorities are as follows:
| Subsidiary | Regulatory Authority | ||||
| AADE | Delaware Department of Insurance | ||||
| AAIA | Iowa Insurance Division | ||||
| AANY | New York Department of Financial Services | ||||
| Athene Re USA IV | State of Vermont Department of Financial Regulation | ||||
Each entity’s statutory statements are presented on the basis of accounting practices determined by the respective regulatory authority. The regulatory authority recognizes only statutory accounting practices prescribed or permitted by the corresponding state for determining and reporting the financial condition and results of operations of an insurance company and for determining its solvency under insurance law.
The maximum dividend these subsidiaries can pay to shareholders, without prior approval of the respective state insurance department, is subject to restrictions relating to statutory surplus or net gain from operations. The maximum dividend payment over a twelve-month period may not, without prior approval, be paid from a source other than earned surplus and may not exceed the greater of (1) the prior year’s net gain from operations or (2) 10% of policyholders’ surplus. Based on these restrictions, the maximum dividend AADE could pay to its parent absent regulatory approval was $— million as of December 31, 2022. Any dividends from AHL’s other U.S. statutory entities in excess of the amounts allowed for AADE would not be able to be remitted to its parent without regulatory approval from the Delaware Department of Insurance.
As of December 31, 2022, Athene’s U.S. subsidiaries’ solvency, liquidity and risk-based capital amounts were significantly in excess of the minimum levels required.
In some instances, the states of domicile of U.S. subsidiaries have adopted prescribed accounting practices that differ from the required accounting outlined in NAIC Statutory Accounting Principles (“SAP”). These subsidiaries also have certain accounting practices permitted by the states of domicile that differ from those found in NAIC SAP. These prescribed and permitted practices are described as follows:
212
AAIA
Among the products issued by AAIA are indexed universal life insurance and fixed indexed annuities. These products allow a portion of the premium to earn interest based on certain indices, primarily the S&P 500. Athene purchases call options, futures and variance swaps to hedge the growth in interest credited to the customer as a direct result of increases in the related index. The Iowa Insurance Division allows an insurer to elect (1) to use an amortized cost method to account for certain derivative instruments, such as call options, purchased to hedge the growth in interest credited to the customer on indexed insurance products and (2) to use an indexed annuity reserve calculation methodology under which call options associated with the current index interest crediting term are valued at zero. AAIA has elected to apply this option to its over-the-counter call options and reserve liabilities. As a result, AAIA’s statutory surplus increased by $62 million as of December 31, 2022.
Athene Re USA IV
AAIA has ceded the AmerUs Closed Block to Athene Re USA IV on a 100% funds withheld basis. A permitted practice in the State of Vermont allows Athene Re USA IV to include as admitted assets the face amount of all issued and outstanding letters of credit used to fund its reinsurance obligations to AAIA in its statutory financial statements. If Athene Re USA IV had not followed this permitted practice, then it would not have exceeded authorized control level risk-based capital requirements. As of December 31, 2022, Athene Re USA IV included as admitted assets $112 million related to the outstanding letters of credit.
Statutory capital and surplus and net income (loss)
The following table presents, for each of Athene’s primary insurance subsidiaries, the statutory capital and surplus and the statutory net income (loss), based on the most recent statutory financial statements to be filed with insurance regulators:
| December 31, 2022 | |||||||||||
| (In millions) | Statutory capital & surplus | Statutory net income (loss) | |||||||||
| ALRe | $ | $ | |||||||||
| AARe | |||||||||||
| ACRA 1A | ( |
||||||||||
| AADE | ( |
||||||||||
| AAIA | ( |
||||||||||
| AANY | ( |
||||||||||
20. Segments
The Company conducts its business through three reportable segments: (i) Asset Management, (ii) Retirement Services and (iii) Principal Investing. Segment information is utilized by the Company’s chief operating decision maker to assess performance and to allocate resources.
The performance is measured by the Company’s chief operating decision maker on an unconsolidated basis because the chief operating decision maker makes operating decisions and assesses the performance of each of the Company’s business segments based on financial and operating metrics and data that exclude the effects of consolidation of any of the affiliated funds.
Segment Reporting Changes
In connection with the completion of the Mergers, Apollo undertook a strategic review of its operating structure and business segments to assess the performance of its businesses and the allocation of resources. As a result, for periods following the Mergers, Apollo is reporting results through three
In connection with these changes, all prior periods have been recast to conform to the new presentation. Consequently, this information will be different from the historical segment financial results previously reported by Apollo in its reports filed with the SEC.
Adjusted Segment Income
213
Adjusted Segment Income, or “ASI”, is the key performance measure used by management in evaluating the performance of the asset management, retirement services, and principal investing segments. Management uses Adjusted Segment Income to make key operating decisions such as the following:
•decisions related to the allocation of resources such as staffing decisions, including hiring and locations for deployment of the new hires;
•decisions related to capital deployment such as providing capital to facilitate growth for the business and/or to facilitate expansion into new businesses;
•decisions related to expenses, such as determining annual discretionary bonuses and equity-based compensation awards to its employees. With respect to compensation, management seeks to align the interests of certain professionals and selected other individuals with those of the investors in the funds and those of Apollo’s stockholders by providing such individuals a profit sharing interest in the performance fees earned in relation to the funds. To achieve that objective, a certain amount of compensation is based on Apollo’s performance and growth for the year; and
•decisions related to the amount of earnings available for dividends to common stockholders and holders of equity-based awards that participate in dividends.
Adjusted Segment Income is a measure of profitability and has certain limitations in that it does not take into account certain items included under U.S. GAAP. Adjusted Segment Income is the sum of (i) Fee Related Earnings, (ii) Spread Related Earnings and (iii) Principal Investing Income. Adjusted Segment Income excludes the effects of the consolidation of any of the related funds and SPACs, interest and other financing costs related to AGM not attributable to any specific segment, taxes and related payables, transaction-related charges and any acquisitions. Transaction-related charges includes equity-based compensation charges, the amortization of intangible assets, contingent consideration, and certain other charges associated with acquisitions, and restructuring charges. In addition, Adjusted Segment Income excludes non-cash revenue and expense related to equity awards granted by unconsolidated related parties to employees of the Company, compensation and administrative related expense reimbursements, as well as the assets, liabilities and operating results of the funds and VIEs that are included in the consolidated financial statements.
Adjusted Segment Income may not be comparable to similarly titled measures used by other companies and is not a measure of performance calculated in accordance with U.S. GAAP. We use Adjusted Segment Income as a measure of operating performance, not as a measure of liquidity. Adjusted Segment Income should not be considered in isolation or as a substitute for net income or other income data prepared in accordance with U.S. GAAP. The use of Adjusted Segment Income without consideration of related U.S. GAAP measures is not adequate due to the adjustments described above. Management compensates for these limitations by using Adjusted Segment Income as a supplemental measure to U.S. GAAP results, to provide a more complete understanding of our performance as management measures it. A reconciliation of Adjusted Segment Income to its most directly comparable U.S. GAAP measure of income (loss) before income tax provision can be found in this footnote.
Fee Related Earnings
Fee Related Earnings (“FRE”) is a component of Adjusted Segment Income that is used to assess the performance of the Asset Management segment. FRE is the sum of (i) management fees, (ii) capital solutions and other related fees, (iii) fee-related performance fees from indefinite term vehicles, that are measured and received on a recurring basis and not dependent on realization events of the underlying investments and (iv) other income, net, less (a) fee-related compensation, excluding equity-based compensation, (b) non-compensation expenses incurred in the normal course of business, (c) placement fees and (d) non-controlling interests in the management companies of certain funds the Company manages.
Spread Related Earnings
Spread Related Earnings (“SRE”) is a component of Adjusted Segment Income that is used to assess the performance of the Retirement Services segment, excluding certain market volatility and certain expenses related to integration, restructuring, equity-based compensation, and other expenses. For the Retirement Services segment, SRE equals the sum of (i) the net investment earnings on Athene’s net invested assets and (ii) management fees received on business managed for others, primarily the ADIP portion of Athene’s business ceded to ACRA, less (x) cost of funds, (y) operating expenses excluding
214
equity-based compensation and (z) financing costs, including interest expense and preferred dividends, if any, paid to Athene preferred stockholders.
Principal Investing Income
Principal Investing Income (“PII”) is a component of Adjusted Segment Income that is used to assess the performance of the Principal Investing segment. For the Principal Investing segment, PII is the sum of (i) realized performance fees, excluding realizations received in the form of shares, and (ii) realized investment income, less (x) realized principal investing compensation expense, excluding expense related to equity-based compensation, and (y) certain corporate compensation and non-compensation expenses.
The following presents financial data for the Company’s reportable segments.
| Years ended December 31, | |||||||||||||||||
| (In millions) | 2022 | 2021 | 2020 | ||||||||||||||
Asset Management |
|||||||||||||||||
Management fees1
|
$ | $ | $ | ||||||||||||||
| Capital solutions fees and other, net | |||||||||||||||||
| Fee-related performance fees | |||||||||||||||||
| Fee-related compensation | ( |
( |
( |
||||||||||||||
| Other operating expenses | ( |
( |
( |
||||||||||||||
| Fee Related Earnings | |||||||||||||||||
| Retirement Services | |||||||||||||||||
| Fixed income and other investment income, net | |||||||||||||||||
| Alternative investment income, net | |||||||||||||||||
| Strategic capital management fees | |||||||||||||||||
| Cost of funds | ( |
||||||||||||||||
| Other operating expenses | ( |
||||||||||||||||
| Interest and other financing costs | ( |
||||||||||||||||
| Spread Related Earnings | |||||||||||||||||
| Principal Investing | |||||||||||||||||
| Realized performance fees | |||||||||||||||||
| Realized investment income | |||||||||||||||||
| Principal investing compensation | ( |
( |
( |
||||||||||||||
| Other operating expenses | ( |
( |
( |
||||||||||||||
| Principal Investing Income | |||||||||||||||||
| Adjusted Segment Income | $ | $ | $ | ||||||||||||||
| Segment Assets: | |||||||||||||||||
| Asset Management | $ | ||||||||||||||||
| Retirement Services | |||||||||||||||||
| Principal Investing | |||||||||||||||||
Total Assets2
|
$ | ||||||||||||||||
1 Includes intersegment management fees from Retirement Services of $ | |||||||||||||||||
2 Refer below for a reconciliation of total assets for Apollo’s total reportable segments to total consolidated assets.
| |||||||||||||||||
215
The following reconciles total consolidated revenues to total asset management fee related revenues:
| Years ended December 31, | |||||||||||||||||
| (In millions) | 2022 | 2021 | 2020 | ||||||||||||||
| Total Consolidated Revenues | $ | $ | $ | ||||||||||||||
| Retirement services GAAP revenue | ( |
||||||||||||||||
Equity awards granted by unconsolidated related parties, reimbursable expenses and other1
|
( |
( |
( |
||||||||||||||
Adjustments related to consolidated funds and VIEs1
|
|||||||||||||||||
| Performance fees | ( |
( |
( |
||||||||||||||
| Principal investment income | ( |
( |
( |
||||||||||||||
| Retirement services management fees | |||||||||||||||||
| Total Asset Management Fee Related Revenues | $ | $ | $ | ||||||||||||||
1 Represents advisory fees, management fees and performance fees earned from consolidated VIEs which are eliminated in consolidation. Includes non-cash revenues related to equity awards granted by unconsolidated related parties to employees of the Company and certain compensation and administrative related expense reimbursements.
| |||||||||||||||||
The following presents the reconciliation of income before income tax provision reported in the consolidated statements of operations to Adjusted Segment Income:
| Years ended December 31, | |||||||||||||||||
| (In millions) | 2022 | 2021 | 2020 | ||||||||||||||
| Income (loss) before income tax provision (benefit) | $ | ( |
$ | $ | |||||||||||||
Asset Management Adjustments: |
|||||||||||||||||
Equity-based profit sharing expense and other1
|
|||||||||||||||||
| Equity-based compensation | |||||||||||||||||
| Preferred dividends | ( |
( |
|||||||||||||||
Transaction-related charges2
|
( |
||||||||||||||||
Merger-related transaction and integration costs3
|
|||||||||||||||||
| Changes associated with corporate conversion | |||||||||||||||||
| (Gains) losses from change in tax receivable agreement liability | ( |
( |
|||||||||||||||
| Net (income) loss attributable to non-controlling interests in consolidated entities | ( |
( |
|||||||||||||||
| Unrealized performance fees | ( |
( |
( |
||||||||||||||
| Unrealized profit sharing expense | |||||||||||||||||
One-time equity-based compensation and other charges5
|
|||||||||||||||||
HoldCo interest and other financing costs4
|
|||||||||||||||||
| Unrealized principal investment income (loss) | ( |
( |
|||||||||||||||
| Unrealized net (gains) losses from investment activities and other | ( |
( |
|||||||||||||||
| Retirement Services Adjustments: | |||||||||||||||||
| Investment (gains) losses, net of offsets | |||||||||||||||||
| Non-operating change in insurance liabilities and related derivatives, net of offsets | |||||||||||||||||
| Integration, restructuring and other non-operating expenses | |||||||||||||||||
| Equity-based compensation | |||||||||||||||||
| Adjusted Segment Income | $ | $ | $ | ||||||||||||||
1 Equity-based profit sharing expense and other includes certain profit sharing arrangements in which a portion of performance fees distributed to the general partner are required to be used by employees of Apollo to purchase restricted shares of common stock or is delivered in the form of RSUs, which are granted under the Equity Plan. Equity-based profit sharing expense and other also includes performance grants which are tied to the Company’s receipt of performance fees, within prescribed periods, sufficient to cover the associated equity-based compensation expense.
| |||||||||||||||||
2 Transaction-related charges include contingent consideration, equity-based compensation charges and the amortization of intangible assets and certain other charges associated with acquisitions, and restructuring charges.
| |||||||||||||||||
3 Merger-related transaction and integration costs includes advisory services, technology integration, equity-based compensation charges and other costs associated with the Mergers.
| |||||||||||||||||
4 Represents interest and other financing costs related to AGM not attributable to any specific segment.
| |||||||||||||||||
5 Includes one-time equity-based compensation expense and associated taxes related to the Company’s compensation reset.
| |||||||||||||||||
216
The following table presents the reconciliation of the Company’s total reportable segment assets to total assets:
| (In millions) | December 31, 2022 | December 31, 2021 | |||||||||
| Total reportable segment assets | $ | $ | |||||||||
Adjustments1
|
|||||||||||
| Total assets | $ | $ | |||||||||
1 Represents the addition of assets of consolidated funds and VIEs and consolidation elimination adjustments.
| |||||||||||
21. Subsequent Events
Dividends
On February 9, 2023, the Company declared a cash dividend of $0.40 per share of common stock, which will be paid on February 28, 2023 to holders of record at the close of business on February 21, 2023.
Share repurchase program reallocation
217
ITEM 8A. UNAUDITED SUPPLEMENTAL PRESENTATION OF STATEMENTS OF FINANCIAL CONDITION
| December 31, 2022 | |||||||||||||||||||||||
| (In millions) | Apollo Global Management, Inc. and Consolidated Subsidiaries | Consolidated Funds and VIEs | Eliminations | Consolidated | |||||||||||||||||||
| Assets | |||||||||||||||||||||||
| Asset Management | |||||||||||||||||||||||
| Cash and cash equivalents | $ | 1,201 | $ | — | $ | — | $ | 1,201 | |||||||||||||||
| Restricted cash and cash equivalents | 2 | 1,046 | — | 1,048 | |||||||||||||||||||
| Investments | 5,713 | — | (131) | 5,582 | |||||||||||||||||||
| Assets of consolidated variable interest entities | |||||||||||||||||||||||
| Cash and cash equivalents | — | 110 | — | 110 | |||||||||||||||||||
| Investments | — | 2,371 | (2) | 2,369 | |||||||||||||||||||
| Other assets | — | 88 | (58) | 30 | |||||||||||||||||||
| Due from related parties | 504 | 1 | (40) | 465 | |||||||||||||||||||
| Goodwill | 264 | — | — | 264 | |||||||||||||||||||
| Other assets | 2,321 | 12 | — | 2,333 | |||||||||||||||||||
| 10,005 | 3,628 | (231) | 13,402 | ||||||||||||||||||||
| Retirement Services | |||||||||||||||||||||||
| Cash and cash equivalents | 7,779 | — | — | 7,779 | |||||||||||||||||||
| Restricted cash and cash equivalents | 628 | — | — | 628 | |||||||||||||||||||
| Investments | 172,488 | — | — | 172,488 | |||||||||||||||||||
| Investments in related parties | 35,286 | — | (11,326) | 23,960 | |||||||||||||||||||
| Assets of consolidated variable interest entities | |||||||||||||||||||||||
| Cash and cash equivalents | — | 362 | — | 362 | |||||||||||||||||||
| Investments | 1,492 | 14,207 | — | 15,699 | |||||||||||||||||||
| Other assets | 8 | 104 | — | 112 | |||||||||||||||||||
| Reinsurance recoverable | 4,367 | — | — | 4,367 | |||||||||||||||||||
| Deferred acquisition costs, deferred sales inducements and value of business acquired | 5,576 | — | — | 5,576 | |||||||||||||||||||
| Goodwill | 4,058 | — | — | 4,058 | |||||||||||||||||||
| Other assets | 10,917 | — | (15) | 10,902 | |||||||||||||||||||
| 242,599 | 14,673 | (11,341) | 245,931 | ||||||||||||||||||||
| Total Assets | $ | 252,604 | $ | 18,301 | $ | (11,572) | $ | 259,333 | |||||||||||||||
| (Continued) | |||||||||||||||||||||||
218
| December 31, 2022 | |||||||||||||||||||||||
| (In millions) | Apollo Global Management, Inc. and Consolidated Subsidiaries | Consolidated Funds and VIEs | Eliminations | Consolidated | |||||||||||||||||||
| Liabilities, Redeemable non-controlling interests and Equity | |||||||||||||||||||||||
| Liabilities | |||||||||||||||||||||||
| Asset Management | |||||||||||||||||||||||
| Accounts payable, accrued expenses, and other liabilities | $ | 2,915 | $ | 61 | $ | (1) | $ | 2,975 | |||||||||||||||
| Due to related parties | 1,056 | 8 | (66) | 998 | |||||||||||||||||||
| Debt | 2,814 | — | — | 2,814 | |||||||||||||||||||
| Liabilities of consolidated variable interest entities | |||||||||||||||||||||||
| Notes payable | — | 50 | — | 50 | |||||||||||||||||||
| Other liabilities | — | 1,899 | — | 1,899 | |||||||||||||||||||
| 6,785 | 2,018 | (67) | 8,736 | ||||||||||||||||||||
| Retirement Services | |||||||||||||||||||||||
| Interest sensitive contract liabilities | 173,653 | — | — | 173,653 | |||||||||||||||||||
| Future policy benefits | 55,328 | — | — | 55,328 | |||||||||||||||||||
| Debt | 3,658 | — | — | 3,658 | |||||||||||||||||||
| Payables for collateral on derivatives and securities to repurchase | 6,707 | — | — | 6,707 | |||||||||||||||||||
| Other liabilities | 3,213 | — | — | 3,213 | |||||||||||||||||||
| Liabilities of consolidated variable interest entities | |||||||||||||||||||||||
| Other liabilities | 124 | 691 | (6) | 809 | |||||||||||||||||||
| 242,683 | 691 | (6) | 243,368 | ||||||||||||||||||||
| Total Liabilities | 249,468 | 2,709 | (73) | 252,104 | |||||||||||||||||||
Commitments and Contingencies (note 18) |
|||||||||||||||||||||||
| Redeemable non-controlling interests: | |||||||||||||||||||||||
| Redeemable non-controlling interests | — | 1,027 | 5 | 1,032 | |||||||||||||||||||
| Equity | |||||||||||||||||||||||
| Additional paid in capital | 15,040 | (72) | 14 | 14,982 | |||||||||||||||||||
| Retained earnings (accumulated deficit) | (2,254) | 11,734 | (11,739) | (2,259) | |||||||||||||||||||
| Accumulated other comprehensive income (loss) | (12,327) | (34) | 35 | (12,326) | |||||||||||||||||||
| Total AGM Stockholders’ Equity | 459 | 11,628 | (11,690) | 397 | |||||||||||||||||||
| Non-controlling interests | 2,677 | 2,937 | 186 | 5,800 | |||||||||||||||||||
| Total Equity | 3,136 | 14,565 | (11,504) | 6,197 | |||||||||||||||||||
| Total Liabilities, Redeemable non-controlling interests and Equity | $ | 252,604 | $ | 18,301 | $ | (11,572) | $ | 259,333 | |||||||||||||||
| (Concluded) | |||||||||||||||||||||||
219
| December 31, 2021 | |||||||||||||||||||||||
| (In millions) | Apollo Global Management, Inc. and Consolidated Subsidiaries | Consolidated Funds and VIEs | Eliminations | Consolidated | |||||||||||||||||||
| Assets | |||||||||||||||||||||||
| Cash and cash equivalents | $ | 915 | $ | 2 | $ | — | $ | 917 | |||||||||||||||
| Restricted cash and cash equivalents | 18 | 690 | — | 708 | |||||||||||||||||||
| Investments | 10,474 | 1,162 | (282) | 11,354 | |||||||||||||||||||
| Assets of consolidated variable interest entities | |||||||||||||||||||||||
| Cash and cash equivalents | — | 463 | — | 463 | |||||||||||||||||||
| Investments | — | 15,133 | (396) | 14,737 | |||||||||||||||||||
| Other assets | — | 253 | (1) | 252 | |||||||||||||||||||
| Due from related parties | 587 | (9) | (88) | 490 | |||||||||||||||||||
| Goodwill | 117 | — | — | 117 | |||||||||||||||||||
| Other assets | 1,462 | 3 | (1) | 1,464 | |||||||||||||||||||
| Total Assets | $ | 13,573 | $ | 17,697 | $ | (768) | $ | 30,502 | |||||||||||||||
| Liabilities, Redeemable non-controlling interests and Equity | |||||||||||||||||||||||
| Liabilities | |||||||||||||||||||||||
| Accounts payable, accrued expenses, and other liabilities | $ | 2,731 | $ | 146 | $ | (30) | $ | 2,847 | |||||||||||||||
| Due to related parties | 1,231 | 10 | (19) | 1,222 | |||||||||||||||||||
| Debt | 3,134 | — | — | 3,134 | |||||||||||||||||||
| Liabilities of consolidated variable interest entities | |||||||||||||||||||||||
| Debt, at fair value | — | 8,068 | (125) | 7,943 | |||||||||||||||||||
| Notes payable | — | 2,714 | (103) | 2,611 | |||||||||||||||||||
| Other liabilities | — | 867 | (86) | 781 | |||||||||||||||||||
| Total Liabilities | 7,096 | 11,805 | (363) | 18,538 | |||||||||||||||||||
Commitments and Contingencies (note 18) |
|||||||||||||||||||||||
| Redeemable non-controlling interests: | |||||||||||||||||||||||
| Redeemable non-controlling interests | — | 1,762 | 8 | 1,770 | |||||||||||||||||||
| Equity | |||||||||||||||||||||||
| Series A Preferred Stock | 264 | — | — | 264 | |||||||||||||||||||
| Series B Preferred Stock | 290 | — | — | 290 | |||||||||||||||||||
| Additional paid in capital | 2,166 | (98) | 28 | 2,096 | |||||||||||||||||||
| Retained earnings | 1,165 | 433 | (454) | 1,144 | |||||||||||||||||||
| Accumulated other comprehensive income (loss) | (5) | (13) | 13 | (5) | |||||||||||||||||||
| Total AGM Stockholders’ Equity | 3,880 | 322 | (413) | 3,789 | |||||||||||||||||||
| Non-controlling interests | 2,597 | 3,808 | — | 6,405 | |||||||||||||||||||
| Total Equity | 6,477 | 4,130 | (413) | 10,194 | |||||||||||||||||||
| Total Liabilities, Redeemable non-controlling interests and Equity | $ | 13,573 | $ | 17,697 | $ | (768) | $ | 30,502 | |||||||||||||||
220
ITEM 9. CHANGES IN AND DISAGREEMENTS WITH ACCOUNTANTS ON ACCOUNTING AND FINANCIAL DISCLOSURES
None.
ITEM 9A. CONTROLS AND PROCEDURES
We maintain “disclosure controls and procedures”, as such term is defined in Rules 13a-15(e) and 15d-15(e) under the Exchange Act, that are designed to ensure that information required to be disclosed by us in reports that we file or submit under the Exchange Act is recorded, processed, summarized and reported within the time periods specified in SEC rules and forms, and that such information is accumulated and communicated to our management, including our Chief Executive Officer and Chief Financial Officer, as appropriate, to allow timely decisions regarding required disclosure. In designing disclosure controls and procedures, our management necessarily was required to apply its judgment in evaluating the cost-benefit relationship of possible disclosure controls and procedures. The design of any disclosure controls and procedures also is based in part upon certain assumptions about the likelihood of future events, and there can be no assurance that any design will succeed in achieving its stated goals under all potential future conditions. Any controls and procedures, no matter how well designed and operated, can provide only reasonable assurance of achieving the desired objectives.
Our management, including our Chief Executive Officer and Chief Financial Officer, evaluated the effectiveness of our disclosure controls and procedures pursuant to Rule 13a-15 under the Exchange Act as of the end of the period covered by this report. Based on that evaluation, our Chief Executive Officer and Chief Financial Officer have concluded that, as of the end of the period covered by this report, our disclosure controls and procedures (as defined in Rule 13a-15(e) under the Exchange Act) are effective at the reasonable assurance level to accomplish their objectives of ensuring that information we are required to disclose in reports that we file or submit under the Exchange Act is recorded, processed, summarized and reported within the time periods specified in SEC rules and forms, and that such information is accumulated and communicated to our management, including our Chief Executive Officer and Chief Financial Officer as appropriate, to allow timely decisions regarding required disclosure.
No changes in our internal control over financial reporting (as such term is defined in Rules 13a–15(f) and 15d–15(f) under the Exchange Act) occurred during our most recent quarter, that have materially affected, or are reasonably likely to materially affect, our internal control over financial reporting.
Management’s Report on Internal Control Over Financial Reporting
Management of Apollo is responsible for establishing and maintaining adequate internal control over financial reporting. Apollo’s internal control over financial reporting is a process designed under the supervision of its principal executive and principal financial officers to provide reasonable assurance regarding the reliability of financial reporting and the preparation of its consolidated financial statements for external reporting purposes in accordance with accounting principles generally accepted in the United States of America.
Apollo’s internal control over financial reporting includes policies and procedures that pertain to the maintenance of records that, in reasonable detail, accurately and fairly reflect transactions and dispositions of assets, provide reasonable assurances that transactions are recorded as necessary to permit preparation of financial statements in accordance with generally accepted accounting principles, and that receipts and expenditures are being made only in accordance with authorizations of management and the directors, and provide reasonable assurance regarding prevention or timely detection of unauthorized acquisition, use or disposition of Apollo’s assets that could have a material effect on its financial statements.
Because of its inherent limitations, internal control over financial reporting may not prevent or detect misstatements. In addition, projections of any evaluation of effectiveness to future periods are subject to the risk that controls may become inadequate because of changes in conditions or that the degree of compliance with the policies or procedures may deteriorate.
Management conducted an assessment of the effectiveness of Apollo’s internal control over financial reporting as of December 31, 2022 based on the framework established in Internal Control - Integrated Framework (2013) issued by the Committee of Sponsoring Organizations of the Treadway Commission. Based on this assessment, management has determined that Apollo’s internal control over financial reporting as of December 31, 2022 was effective.
221
Deloitte & Touche LLP, an independent registered public accounting firm, has audited Apollo’s financial statements included in this annual report on Form 10-K and issued its report on the effectiveness of Apollo’s internal control over financial reporting as of December 31, 2022, which is included herein.
ITEM 9B. OTHER INFORMATION
Not applicable.
ITEM 9C. DISCLOSURE REGARDING FOREIGN JURISDICTIONS THAT PREVENT INSPECTIONS
Not applicable.
222
PART III
ITEM 10. DIRECTORS, EXECUTIVE OFFICERS AND CORPORATE GOVERNANCE
Directors and Executive Officers
The following table presents certain information concerning our board of directors and executive officers. There are no family relationships among any of our directors or executive officers.
| Name | Age | Position(s) | ||||||||||||
| Marc Rowan | 60 | Chief Executive Officer and Director | ||||||||||||
| James Belardi | 65 | Chief Executive Officer of AHL and Director | ||||||||||||
| Scott Kleinman | 50 | Co-President of AAM and Director | ||||||||||||
| James Zelter | 60 | Co-President of AAM and Director | ||||||||||||
| Walter (Jay) Clayton | 56 | Non-Executive Chair and Director | ||||||||||||
| Marc Beilinson | 64 | Director | ||||||||||||
| Jessica Bibliowicz | 63 | Director | ||||||||||||
| Michael Ducey | 74 | Director | ||||||||||||
| Richard Emerson | 61 | Director | ||||||||||||
| Kerry Murphy Healey | 62 | Director | ||||||||||||
| Mitra Hormozi | 53 | Director | ||||||||||||
| Pamela Joyner | 64 | Director | ||||||||||||
| A.B. Krongard | 86 | Director | ||||||||||||
| Pauline Richards | 74 | Director | ||||||||||||
| David Simon | 61 | Director | ||||||||||||
| Lynn Swann | 70 | Director | ||||||||||||
| Patrick Toomey | 61 | Director Appointee* | ||||||||||||
| Martin Kelly | 55 | Chief Financial Officer | ||||||||||||
| John Suydam | 63 | Chief Legal Officer | ||||||||||||
*On February 21, 2022, the AGM board of directors appointed Senator Patrick Toomey to the AGM board of directors, effective March 15, 2023.
The following are brief biographies describing the backgrounds of our directors and executive officers.
Marc Rowan is the Chief Executive Officer of AGM, a member of AGM’s board of directors, and a member of the executive committee of AGM’s board of directors. He was elected to the AGM board of directors in January 2022. Mr. Rowan currently serves on the boards of directors of, inter alia, AHL and Athora Holding, and is a member of AHL’s executive committee. Mr. Rowan co-founded Apollo in 1990. Mr. Rowan is Chair of the Board of Advisors of The Wharton School and a member of the University of Pennsylvania’s Board of Trustees. He has previously served on the boards of directors of numerous entities affiliated with Apollo, portfolio companies held by Apollo-managed funds, and other entities. In addition, he is involved in public policy and is an initial funder and contributor to the development of the Penn Wharton Budget Model, a nonpartisan research initiative which provides analysis of public policy’s fiscal impact. An active philanthropist, Mr. Rowan is a founding member and Chair of the Youth Renewal Fund and Vice Chair of Darca, Israel’s top educational network operating 40 schools with over 22,000 students throughout Israel’s most diverse and underserved communities. Mr. Rowan also serves on the board of directors of, inter alia, OpenDor Media, a digital media company centered on engaging Jewish and Israeli content. He is an Executive Committee member of the Civil Society Fellowship, a partnership of ADL and the Aspen Institute, designed to empower the next generation of community leaders and problem solvers from across the political spectrum. He also serves on the boards of, inter alia, several technology-oriented venture companies. Mr. Rowan graduated summa cum laude from the University of Pennsylvania’s Wharton School of Business with a B.S. and an M.B.A. in Finance. Mr. Rowan has significant experience making and managing investments, particularly financial services investing, on behalf of Apollo and has over 36 years’ experience financing, analyzing and investing in public and private companies. Mr. Rowan’s extensive financial background and expertise in private equity investments enhance the breadth of experience of AGM’s board of directors.
223
James Belardi is a member of AGM’s board of directors and a member of the executive committee of AGM’s board of directors. He was elected to the AGM board of directors in January 2022. Mr. Belardi is co-founder of AHL, and has served as AHL’s Chairman, Chief Executive Officer and Chief Investment Officer since May 2009. In addition, Mr. Belardi is the founder, Chairman and Chief Executive Officer of ISG, AHL’s investment manager. He is a member of AHL’s executive committee and ISG’s executive committee. Mr. Belardi is responsible for AHL’s overall strategic direction and management and the day-to-day management of its investment portfolio. Prior to founding AHL and ISG, Mr. Belardi was President of SunAmerica Life Insurance Company and was also Executive Vice President and Chief Investment Officer of AIG Retirement Services, Inc., where he had responsibility for an invested-asset portfolio of $250 billion. He currently serves on the board of directors of ISG, Paulist Productions, where he chairs the investment committee, and Southern California Aquatics. Mr. Belardi swam in the 1976 and 1980 Olympic Swimming Trials and is a nine-time Masters Swimming World Record Holder. Mr. Belardi has a B.A. in economics from Stanford University and an M.B.A. from the University of California, Los Angeles. Mr. Belardi’s demonstrated track record in and deep knowledge of the financial services business, including having founded both AHL and ISG, and his extensive experience in the insurance industry provides immense value to AGM’s and AHL’s board of directors.
Scott Kleinman is a member of AGM’s board of directors and a member of the executive committee of AGM’s board of directors. He was elected to the AGM board of directors in January 2022. Mr. Kleinman also serves as Co-Chair of the AAM Board of Directors. Mr. Kleinman joined the AAM board of directors effective March 2021, and he became Co-Chair in January 2022. Mr. Kleinman also serves on the AHL board of directors, which he joined in December 2018. Mr. Kleinman is Co-President of AAM, co-leading AAM’s day-to-day operations, including all of AAM’s revenue-generating businesses and enterprise solutions across its integrated alternative investment platform. Mr. Kleinman joined Apollo six years after its inception in 1996, and he was named Lead Partner for Private Equity in 2009 prior to being named Co-President in 2018. Prior to joining Apollo, Mr. Kleinman was a member of the Investment Banking division at Smith Barney Inc. Mr. Kleinman also currently serves on the board of directors of Athora Holding, Ltd. and Apollo Strategic Growth Capital II and previously served on the board of directors of Apollo Strategic Growth Capital. In 2014, Mr. Kleinman founded the Kleinman Center for Energy Policy at the University of Pennsylvania. He is a member of the Board of Advisors at the University of Pennsylvania Stuart Weitzman School of Design. He is also a member of the Board of Advisors of Nature Conservancy New York as well as the Board of Directors of White Plains Hospital, where he co-chaired the COVID-19 Relief Campaign. Mr. Kleinman received a B.A. and B.S. from the University of Pennsylvania and the Wharton School of Business, respectively, graduating magna cum laude, Phi Beta Kappa. Mr. Kleinman’s extensive knowledge of Apollo’s business and expertise in private equity investments enhance the breadth of experience of AGM’s and AAM’s boards of directors.
James Zelter is a member of AGM’s board of directors and a member of the executive committee of AGM’s board of directors. He was elected to the AGM board of directors in January 2022. Mr. Zelter also serves as Co-Chair of AAM’s board of directors. Mr. Zelter joined the AAM board of directors effective March 2021, and he became Co-Chair in January 2022. Mr. Zelter is Co-President of AAM, co-leading AAM’s day-to-day operations, including all of AAM’s revenue-generating businesses and enterprise solutions across its integrated alternative investment platform. Mr. Zelter joined Apollo in 2006, and served as the Chief Investment Officer of Apollo’s credit business from 2006 and became Co-President in January 2018. Since 2006, Mr. Zelter has also served in several senior roles at MidCap Financial Investment Corporation (f/k/a Apollo Investment Corporation), a publicly traded vehicle managed by Apollo, and served as a director on its board of directors from 2006 to 2020. Prior to joining Apollo, Mr. Zelter was with Citigroup Inc. and its predecessor companies from 1994 to 2006. From 2003 to 2005, Mr. Zelter was Chief Investment Officer of Citigroup Alternative Investments, and prior to that he was responsible for Citigroup’s Global High Yield franchise. Prior to joining Citigroup in 1994, Mr. Zelter was a High Yield Trader at Goldman, Sachs & Co. Mr. Zelter has significant experience in global credit markets and has overseen the broad expansion of Apollo’s credit platform. He is a member of the Duke University Board of Trustees and a board member of DUMAC, Inc., the investment management company that oversees the Duke University endowment. Mr. Zelter also serves on the board of directors of the Robert Toigo Foundation, the Partnership for New York City, and The Bridge Golf Foundation, as well as the Board of Fellows of Weill Cornell Medicine. Mr. Zelter has a B.A. in Economics from Duke University. Mr. Zelter’s extensive knowledge of Apollo’s business and expertise in credit investments enhances the breadth of experience of AGM’s and AAM’s boards of directors.
Jay Clayton (Walter J. Clayton III) is non-executive Chair, Chair of the executive committee and a member of the nominating and corporate governance committee of AGM’s Board of Directors. He was elected to the AGM board of directors in January 2022. Mr. Clayton previously served as non-executive Chair of the board of directors of AAM, from March 21, 2021 through December 2021, and, prior to that time, served as Lead Independent Director of the board of directors of AAM effective March 1, 2021. Mr. Clayton served as Chair of the SEC from May 2017 through December 2020. In addition to chairing the SEC, he was a member of the President’s Working Group on Financial Markets, the Financial Stability Oversight Council and the
224
Financial Stability Board. Mr. Clayton also participated on the Board of the International Organization of Securities Commissions. In addition to financial stability matters, Mr. Clayton’s participation in these domestic and international bodies focused on cybersecurity, climate risk and digital assets. Prior to joining the SEC, Mr. Clayton was a partner at Sullivan & Cromwell LLP, where he was a member of the firm’s Management Committee and co-head of the firm’s corporate practice and co-head of the cybersecurity group. From 2009 to 2017, Mr. Clayton was a Lecturer in Law and Adjunct Professor at the University of Pennsylvania Law School and since July 2021 has been an Adjunct Professor at both the Wharton School and the Carey Law School of the University of Pennsylvania. Mr. Clayton currently serves on the board of directors of the American Express Company, a position he has held since October 2022. Mr. Clayton also is a Senior Policy Advisor and Of Counsel to Sullivan & Cromwell LLP, and he has advisory roles with several private companies and non-profit organizations, including the Board of Trustees of Lehigh University and the National Association of Securities Professionals. Mr. Clayton is also a member of the Federal Deposit Insurance Corporation’s Systemic Resolution Advisory Committee. He also serves as an advisor to several firms in the cloud computing, Web3 and digital asset spaces. Mr. Clayton earned a B.S. in Engineering from the University of Pennsylvania, a B.A. and M.A. in Economics from the University of Cambridge, and a J.D. from the University of Pennsylvania Law School. Mr. Clayton’s breadth of professional and management experience, as well as his deep knowledge and understanding of the operation and regulation of private and public capital markets, make him a valuable member of AGM’s board of directors.
Marc Beilinson is as an independent director and Chair of the compensation committee of AGM’s board of directors. He was elected to the AGM board of directors in January 2022. Mr. Beilinson has also served as an independent director of AHL since 2013, and he is the lead independent director and a member of AHL’s conflicts committee and legal and regulatory committee. Mr. Beilinson served on the AHL compensation committee from August 2013 until December 2021. Since August 2011, Mr. Beilinson has been the Managing Director of Beilinson Advisory Group, a financial restructuring and hospitality advisory group that specializes in assisting distressed companies. Most recently, Mr. Beilinson served as Chief Restructuring Officer of Newbury Common Associates LLC (and certain affiliates) from December 2016 to June 2017. Mr. Beilinson previously served as Chief Restructuring Officer of Fisker Automotive from November 2013 to August 2014 and as Chief Restructuring Officer and Chief Executive Officer of Eagle Hospitality Properties Trust, Inc. from August 2011 to December 2014 and Innkeepers USA Trust from November 2008 to March 2012. Mr. Beilinson oversaw the Chapter 11 reorganization of Innkeepers USA, Fisker Automotive and Newbury Common Associates in his interim management roles as the Chief Restructuring Officer of those companies. Mr. Beilinson currently serves on the boards of directors of Exela Technologies and Playtika, as well as several privately held companies. Mr. Beilinson has previously served on the boards of directors and audit committees of a number of public and privately held companies, including Westinghouse Electric, Caesars Acquisition Company, Wyndham International, Inc., Apollo Commercial Real Estate Finance, Inc., Innkeepers USA Trust and Gastar Inc. Mr. Beilinson has a B.A. in political science from the University of California, Los Angeles and a J.D. from the University of California Davis Law School. Mr. Beilinson’s over thirty years of service to the boards of both public and private companies, and his extensive knowledge of legal and compliance issues, including the Sarbanes-Oxley Act of 2002 enhances AGM’s board of directors.
Jessica Bibliowicz is as an independent director and a member of the audit committee of AGM’s board of directors. She was elected to the AGM board of directors in March 2022. Ms. Bibliowicz has also served as an independent director and a member of the audit committee of the AAM board of directors since March 2022. Ms. Bibliowicz is a successful entrepreneur and organizational leader within financial services with more than 30 years of experience with public and private companies. Notably, she became president and CEO of National Financial Partners (“NFP”), a leading provider of benefits, insurance and asset management services, in 1999 and Chairman of the company’s Board in 2003 and took the company public later that year. She continued to serve in both roles until NFP was acquired in 2013. Earlier in her career, Ms. Bibliowicz held senior management positions at Prudential Mutual Funds and Smith Barney Mutual Funds. She is a member of the Board of Prudential Insurance Funds and previously served on the Board of Directors for Sotheby’s until it went private in 2019. Ms. Bibliowicz has served on the Board of Fellows of Weill Cornell Medicine for more than 15 years and is currently Chair and also serves on the Board of Trustees of Cornell University and the Board of Trustees of New York-Presbyterian. Ms. Bibliowicz has a B.S. in government from Cornell University. Ms. Bibliowicz’s extensive business experience and leadership roles at both public and private companies makes her a valuable member of AGM’s and AAM’s boards of directors.
Michael Ducey is an independent director and a member of the audit committee of AGM’s board of directors. He was elected to the AGM board of directors in January 2022. Mr. Ducey has also served as an independent director and a member of the audit committee of AAM’s board of directors since 2011. Mr. Ducey also served as Chair of the conflicts committee of AAM’s board of directors from 2011 through December 2021. Mr. Ducey was with Compass Minerals International, Inc., from March 2002 to May 2006, where he served in a variety of roles, including as President, Chief Executive Officer and Director prior to his retirement in May 2006. Prior to joining Compass Minerals International, Inc., Mr. Ducey worked for nearly 30 years at Borden Chemical, Inc., in various management, sales, marketing, planning and commercial development positions, and
225
ultimately as President, Chief Executive Officer and Director. Mr. Ducey joined Sisescam Resource Partners LLC (formerly Ciner Resources Corporation and prior to that OCI Resources LP) as an independent member of the board of directors in September 2014, where he serves on the audit committee and the conflicts committee. From September 2009 to December 2012, Mr. Ducey was the non-executive Chairman of TPC Group, Inc. and served on the audit committee and the environmental health and safety committee. He served on the board of Fenner, PLC from January 2017 to June 2018 and served on the Audit, Governance and Remunerations Committees. Mr. Ducey has significant prior experience on public company boards, including Verso Paper Holdings, UAP Holdings Corporation, Smurfit Stone Container Corporation and HaloSource, Inc. He graduated from Otterbein University with a degree in Economics and an M.B.A. in finance from the University of Dayton. Mr. Ducey’s comprehensive corporate background and his experience serving on various boards and committees adds significant value to AGM’s and AAM’s boards of directors.
Richard Emerson is an independent director and a member of the compensation committee of AGM’s board of directors. He was elected to the AGM board of directors in January 2022. Mr. Emerson served as an independent director of AAM’s board of directors from March 2021 through December 2021. Mr. Emerson has spent his entire career in investment banking and corporate finance. He currently serves as president of Pendral Capital, where he both invests and advises technology clients on strategic transactions. From 2004 through 2008, he was Senior Managing Director of Evercore Partners Inc., a public investment banking advisory firm, where he established and ran the San Francisco office. Prior to Evercore, Mr. Emerson served as Senior Vice President, Corporate Development and Strategy, of Microsoft Corporation, reporting directly to the Chief Executive Officer and serving on the executive leadership team, with responsibility for all acquisitions, investments, strategic partnerships and corporate strategy. Mr. Emerson joined Microsoft from investment bank Lazard Ltd., where as a Senior Managing Director, he established and ran the west coast office, and advised clients on industry defining mergers, acquisitions and related financial transactions. Prior to Lazard, Mr. Emerson held senior roles with The Blackstone Group and Morgan Stanley & Co. Mr. Emerson has a B.A. and M.A. in Economics and a J.D. from Stanford University, and an MBA from Dartmouth College. Mr. Emerson’s investment banking and corporate finance background adds significant value to AGM’s board of directors.
Kerry Murphy Healey is an independent director and Chair of the sustainability and corporate responsibility committee of AGM’s board of directors. She was elected to the AGM board of directors in January 2022. Dr. Healey served as an independent director of AAM’s board of directors from March 2021 through December 2021. Dr. Healey was the inaugural president of the Milken Center for Advancing the American Dream in Washington, DC, a position which she held from 2019-2022. Dr. Healey served as the President of Babson College from 2013-2019 and was elected President Emerita by the trustees of Babson College in 2021. Before coming to Babson, she served with distinction as the 70th lieutenant governor of Massachusetts from 2003 to 2007, where she worked to lead, enact, and implement a wide range of policy and legislative initiatives for the Romney-Healey Administration. In 2008, Dr. Healey was appointed by Secretary of State Condoleezza Rice as a founding member of the Executive Committee of the U.S. State Department’s Public-Private Partnership for Justice Reform in Afghanistan (PJRA), a position to which she was later reappointed by Secretary of State Hillary Clinton. Prior to her public service, Dr. Healey worked for more than a decade as a public policy consultant to the United States Department of Justice for Cambridge-based think tank Abt Associates. Dr. Healey holds an A.B. in government from Harvard College and a Ph.D. in political science and law from Trinity College, Dublin. She has been a fellow at the Harvard Kennedy School’s Institute of Politics and Harvard’s Center for Public Leadership. She is a member of the Council on Foreign Relations and the Trilateral Commission, and a trustee of the American University of Afghanistan, the American University of Bahrain and Western Governors University. Dr. Healey’s public service experience and her role in government makes her a valuable member of AGM’s board of directors.
Mitra Hormozi is an independent director and a member of the nominating and corporate governance and sustainability and corporate responsibility committees of AGM’s board of directors. She was elected to the AGM board of directors in January 2022. Ms. Hormozi has served as an independent director of AHL since December 2018 and is the chair of AHL’s legal and regulatory committee. Ms. Hormozi is also a director of a number of AHL’s U.S. subsidiaries. Ms. Hormozi previously served on AHL’s compensation committee from 2019 until 2022. Ms. Hormozi has been a partner at Walden Macht & Haran LLP since January 2020. Ms. Hormozi was Executive Vice President and General Counsel of Revlon, Inc. from April 2015 to July 2019, where she was responsible for overseeing Revlon’s legal affairs worldwide. Earlier in her career, Ms. Hormozi was a federal prosecutor in the Eastern District of New York. She also previously served on the board of directors of Revlon from November 2019 until July 2020. Ms. Hormozi received a B.A. in history from the University of Michigan and a J.D. from the New York University School of Law. Ms. Hormozi’s extensive legal counsel experience provides value to AGM’s board of directors.
226
Pamela Joyner is an independent director and a member of the nominating and corporate governance committee of AGM’s board of directors. She was elected to the AGM board of directors in January 2022. Ms. Joyner served as an independent director of AAM’s board of directors from March 2021 through December 2021. Ms. Joyner is a founding partner of Avid Partners LLC, a strategic marketing consulting firm. Previously, she held senior positions at Bowman Capital Management LLC and Capital Guardian Trust Company. Ms. Joyner is an independent director of First Republic Bank, a position she has held for over 17 years. In that time, Ms. Joyner has served as chair of First Republic Bank’s investment and compensation committee, and as a member of its governance committee. She is a trustee emeritus of Dartmouth College, Chair Emeritus of the Tate Americas Foundation, and a trustee of the Art Institute of Chicago and J. Paul Getty Trust. She was previously Co-Chair of the San Francisco Ballet Association. Ms. Joyner holds a B.A. from Dartmouth College, an M.B.A. from Harvard University and an Honorary Degree from Dartmouth College. Ms. Joyner’s extensive business experience and her service on the board of a regulated company makes her a valuable member of AGM’s board of directors.
A.B. Krongard is an independent director, Chair of the nominating and corporate governance committee, and a member of the audit committee of AGM’s board of directors. He was elected to the AGM board of directors in January 2022. Mr. Krongard has also served as an independent director and a member of the audit committee of AAM’s board of directors since 2011. Mr. Krongard also served as a member of the conflicts committee of AAM’s board of directors from January 2019 through December 2021. From 2001 to 2004, Mr. Krongard served as Executive Director of the Central Intelligence Agency. From 1998 to 2001, Mr. Krongard served as Counselor to the Director of Central Intelligence. Prior to 1998, Mr. Krongard served in various capacities at Alex Brown, Incorporated, including serving as Chief Executive Officer beginning in 1991 and assuming additional duties as Chairman of the board of directors in 1994. Upon the merger of Alex Brown, Incorporated with Bankers Trust Corporation in 1997, Mr. Krongard served as Vice-Chairman of the Board of Bankers Trust Corporation and served in such capacity until assuming his position at the Central Intelligence Agency. Mr. Krongard served as the Lead Director of Under Armour, Inc. from 2006 to 2020. Mr. Krongard serves as Chair of the nominating and corporate governance committee and a member of the compensation committee of Iridium Communications Inc. and as a member of the audit committee of Icahn Enterprises L.P. Mr. Krongard served on the board of trustees of In-Q-Tel, Inc. from 2007 to 2022. Mr. Krongard graduated with honors from Princeton University and received a J.D. from the University of Maryland School of Law, where he also graduated with honors. Mr. Krongard’s comprehensive corporate background contributes to the range of experience of AGM’s and AAM’s boards of directors.
Pauline Richards is an independent director, Chair of the audit committee, and member of the sustainability and corporate responsibility committee of AGM’s board of directors. She was elected to the AGM board of directors in January 2022. Ms. Richards has also served as an independent director and chair of the audit committee of AAM’s board of directors since 2011. Ms. Richards also served as a member of the conflicts committee of AAM’s board of directors from October 2020 to December 2021. Ms. Richards currently serves as Chief Operating Officer of Trebuchet Group Holdings Limited, a position she has held since 2008. Ms. Richards also serves as a member of the Audit and Governance Committees of the board of directors of Wyndham Hotels and Resorts. Ms. Richards is also a director of Hamilton Insurance Group, serving on the audit and investment committees, a position she has held since 2013. Ms. Richards previously served on the board of Wyndham Worldwide from 2006 to 2018. Prior to 2008, Ms. Richards served as Director of Development of Saltus Grammar School from 2003 to 2008, as Chief Financial Officer of Lombard Odier Darier Hentsch (Bermuda) Limited from 2001 to 2003, and as Treasurer of Gulf Stream Financial Limited from 1999 to 2000. Ms. Richards also served as a member of the Audit Committee and chair of the Corporate Governance Committee of the board of directors of Butterfield Bank from 2006 to 2013. Ms. Richards graduated from Queen’s University, Ontario, Canada, with a B.A. in psychology and has obtained certification as a CPA, CMA. Ms. Richards’ extensive finance experience and her service on the boards of other public companies adds significant value to AGM’s and AAM’s boards of directors.
David Simon is an independent director of AGM’s board of directors. He was elected to the AGM board of directors in January 2022. Mr. Simon served as an independent director of AAM’s board of directors from June 2021 through December 2021. Mr. Simon is currently Chairman of the Board, CEO and President of Simon Property Group. Mr. Simon has been the CEO of Simon Property Group or its predecessor since 1995 and President of Simon Property Group since February 2019. He served as President of Simon Property Group’s predecessor from 1993 to 1996, and he has served as a director of Simon Property Group or its predecessor since the company’s incorporation in 1993, beginning his role as Chairman in 2007. Previously, Mr. Simon was Vice President of Wasserstein Perella & Company from 1988 to 1990, and an Associate at First Boston Corp. from 1985 to 1988. He is a member and former chairman of the National Association of Real Estate Investment Trusts. He also serves as Chairman of the Supervisory Board of Klépierre S.A., a publicly traded Paris-based European leader in shopping malls. Mr. Simon previously served as Chairman of the Board of Simon Property Group Acquisition Holdings, Inc., a special purpose acquisition company launched by Simon Property Group, from January 2021 through August 5, 2022. Mr. Simon earned a B.S. from the Indiana University Kelley School of Business and an M.B.A. from Columbia University. Mr. Simon’s decades of
227
experience in financing, deal-making, and real estate, as well as his extensive business experience through his roles as Chairman of the Board, CEO and President of a regulated company, contribute immense value to AGM’s board of directors.
Lynn Swann is an independent director and a member of the compensation committee of AGM’s board of directors. He was elected to the AGM board of directors in January 2022. Mr. Swann has also served as an independent director of AHL since September 2020. Mr. Swann is president of Swann, Inc., a marketing and consulting firm he founded in 1976. From 2016 to 2019, Mr. Swann served as the Athletic Director of the University of Southern California, where he was responsible for overall administration of 21 women’s and men’s Division I athletic programs at the university. Mr. Swann currently serves on the boards of directors of Evoqua Water Technologies and American Homes 4 Rent, and he has previously served on the boards of a number of publicly-traded, privately-held and non-profit entities, such as Fluor Corporation and the Professional Golfers’ Association (PGA) of America. In addition to his extensive executive and board experience, Mr. Swann played nine seasons for the Pittsburgh Steelers and was elected to the Pro Football Hall of Fame in 2001. He also previously worked on-air as a host, reporter and analyst for the American Broadcast Company (ABC-TV) for nearly 30 years and served as chairman of the national board of Big Brothers Big Sisters of America. President George W. Bush appointed Mr. Swann as the Chairman of the President’s Council on Fitness, Sports and Nutrition, where he served from 2002 to 2005. Mr. Swann received a B.A. from the University of Southern California. Mr. Swann’s experience serving on the board of directors of public, private and non-profit entities provides value to AGM’s board of directors.
Patrick Toomey was appointed to AGM’s board of directors on February 21, 2023 to serve as an independent director, effective March 15, 2023. Senator Toomey represented Pennsylvania in the U.S. Senate from 2011 to 2023, serving on the Senate Banking, Housing, and Urban Affairs; Budget; and Finance Committees, as well as the Joint Economic Committee and the Joint Select Committee on Deficit Reduction. He also chaired the Subcommittee on Financial Institutions and Consumer Protection. Senator Toomey previously served in the U.S. House of Representatives from 1999 to 2005, where he was a member of the House Budget Committee. He began his career in financial services at Chemical Bank and then Morgan, Grenfell & Co. Senator Toomey has a B.A. in political science from Harvard University. Senator Toomey’s experience with economic and tax policy, financial regulation, and budgetary issues, as well his experience in the financial services industry, will make him a valuable member of AGM’s board of directors.
Martin Kelly joined Apollo in 2012 and serves as the Chief Financial Officer of AGM. Mr. Kelly served as Chief Financial Officer of AAM from September 2012 through February 2022. From January 2019 through December 2021, Mr. Kelly also served as our Co-Chief Operating Officer. From 2008 to 2012, Mr. Kelly was with Barclays Capital and, from 2000 to 2008, Mr. Kelly was with Lehman Brothers Holdings Inc. Prior to departing Barclays Capital, Mr. Kelly served as Managing Director, CFO of the Americas, and Global Head of Financial Control for their Corporate and Investment Bank. Prior to joining Lehman Brothers in 2000, Mr. Kelly spent 13 years with PricewaterhouseCoopers LLP, including serving in the Financial Services Group in New York from 1994 to 2000. Mr. Kelly was appointed a Partner of the firm in 1999. Mr. Kelly received a degree in Commerce, majoring in Finance and Accounting, from the University of New South Wales in 1989.
John Suydam joined Apollo in 2006 and serves as AGM’s Chief Legal Officer. From 2002 to 2006, Mr. Suydam was a partner at O’Melveny & Myers LLP where he served as head of Mergers and Acquisitions and co-head of the Corporate Department. Prior to that time, Mr. Suydam served as Chairman of the law firm O’Sullivan, LLP which specialized in representing private equity investors. Mr. Suydam serves on the boards of The Legal Action Center, Environmental Solutions Worldwide, Inc. and New York University School of Law. Additionally, Mr. Suydam serves on the board of trustees of The College of the Holy Cross. Mr. Suydam received his J.D. from New York University and graduated magna cum laude with a B.A. in History from the State University of New York at Albany.
Audit Committee of the Board of Directors
Our board of directors established an audit committee. The primary purpose of our audit committee is to assist our board of directors in overseeing and monitoring (i) the integrity of the financial statements and other financial information provided to our stockholders, the public, any stock exchange and others, (ii) our compliance with legal and regulatory requirements, (iii) the qualifications, independence and performance of our independent auditor, (iv) the performance of our internal audit function and our system of internal controls, and (v) such other matters as are assigned to the audit committee pursuant to our audit committee charter or as mandated under applicable laws, rules and regulations
The current members of our audit committee are Mses. Bibliowicz and Richards and Messrs. Ducey and Krongard. Ms. Richards currently serves as Chair of the committee. Each of the members of our audit committee meets the independence standards and financial literacy requirements for service on an audit committee of a board of directors pursuant to the Exchange
228
Act and NYSE rules applicable to audit committees. Furthermore, our board of directors has determined that each of Mses. Bibliowicz and Richards and Messrs. Ducey and Krongard is an “audit committee financial expert” within the meaning of Item 407(d)(5) of Regulation S-K. Our audit committee has a charter that complies with current SEC and NYSE rules, which is available on our website at www.apollo.com under the “Investors, Apollo Global Management, Inc., Governance, Committees & Documents” section.
Code of Business Conduct and Ethics
We have a Code of Business Conduct and Ethics, which applies to, among others, our Board of Directors, our principal executive officer, principal financial officer, principal accounting officer and controller. A copy of our Code of Business Conduct and Ethics is available on our website at www.apollo.com under the “Investors, Apollo Global Management, Inc., Governance, Committees & Documents” section. We intend to disclose any amendment to or waiver of the Code of Business Conduct and Ethics on behalf of an executive officer or director either on our website or in a Form 8-K filing.
Delinquent Section 16(a) Reports
Section 16(a) of the Exchange Act requires our officers and directors, and persons who own more than ten percent of a registered class of AGM’s equity securities to file initial reports of ownership and reports of changes in ownership with the SEC and furnish us with copies of all Section 16(a) forms they file. To our knowledge, and other than as previously disclosed, based solely on our review of the copies of such reports furnished to us or written representations from such persons that they were not required to file a Form 5 to report previously unreported ownership or changes in ownership, we believe that, with respect to the fiscal year ended December 31, 2022, such persons complied with all such filing requirements, except that in February 2022, a Form 4 for Mr. Kelly reporting one transaction involving an award of restricted stock units under the Equity Plan was inadvertently filed late through no fault of the reporting person.
ITEM 11. EXECUTIVE COMPENSATION
Compensation Discussion and Analysis
Background
The following Compensation Discussion and Analysis (“CD&A”) reports on the compensation of our “named executive officers” or “NEOs” during 2022. This includes our CEO, CFO and our three most highly compensated executive officers, as follows:
| Name | Title | |||||||
| Marc Rowan | Chief Executive Officer | |||||||
| Martin Kelly | Chief Financial Officer | |||||||
| Scott Kleinman | Co-President of AAM | |||||||
| James Belardi | Chairman and Chief Executive Officer of AHL | |||||||
| John Suydam* | Chief Legal Officer | |||||||
*Mr. Suydam has informed us of his intention to transition to the role of partner and senior advisor at the end of 2023.
2022 was a transformative year for our company. The Mergers became effective on January 1, 2022, and, as a result of the Mergers, we became the parent company to Apollo Asset Management (“AAM”) and Athene (“AHL”) and the successor issuer of Apollo’s listed common stock. Accordingly, in this “Executive Compensation” section, “we,” “us,” “our,” and the “Company” refer to AAM for items that occurred prior to 2022.
Following the Mergers, we are no longer a controlled company, and in 2021, we implemented a reset of our compensation programs across a significant part of our employee base, including for the Co-Presidents of AAM, to more closely align pay to stockholder performance. Our compensation committee is composed solely of independent directors.
The design of our compensation program is intended to support our business objectives as well as align pay with performance and attract and retain the most qualified and energized talent to spend the entirety of their careers at Apollo.
229
| What We Do | What We Don’t Do | ||||||||||
☑ |
Align pay with performance, including with limited base salary, an emphasis on variable compensation and long-term stock ownership
|
☒ |
No new compensation to AAM Co-President Scott Kleinman, other than base salary
|
||||||||
☑ |
Align NEOs with stockholders through:
|
☒ |
No excessive perquisites
|
||||||||
–Equity ownership
|
☒ |
No significant retirement or pension benefits
|
|||||||||
–Significant personal investments in AGM common stock and Apollo funds
|
☒ |
No single-trigger change in control severance payments
|
|||||||||
–Non-compete and non-solicit covenants
|
☒ |
No hedging transactions or short sales of our common stock permitted for any executive officer
|
|||||||||
☑ |
Meaningful share ownership guidelines covering all NEOs were adopted in 2022
|
☒ |
No excise tax gross-ups
|
||||||||
☑ |
Adopted a recoupment policy in 2022 (covering all NEOs) that provides for the recovery of incentive compensation if an employee engages in a detrimental activity and as otherwise required by law
|
||||||||||
☑ |
Engage proactively with shareholders and other stakeholders
|
||||||||||
☑ |
Include only independent directors on the compensation committee
|
||||||||||
☑ |
Utilize an independent compensation consultant
|
||||||||||
Other highlights of 2022 include the following:
Corporate Structure/Governance
•As of January 1, 2022, compensation decisions for the named executive officers came under the purview and authority of a newly formed independent compensation committee. The compensation committee is composed exclusively of independent directors, meets at least quarterly each year, operates pursuant to a written Compensation Committee Charter, and receives briefings from an outside compensation consultant and outside counsel, as appropriate.
Leadership
•On January 1, 2022, Marc Rowan, CEO of AGM, assumed oversight responsibilities of AHL’s insurance businesses in addition to AAM’s asset management business. Mr. Rowan’s close alignment with stockholders is evidenced by his significant equity ownership and his annual base salary of $100,000. See “Item 12. Security Ownership of Certain Beneficial Owners and Management and Related Stockholder Matters.”
•On January 1, 2022, Martin Kelly commenced his role as CFO of AGM, after previously being CFO of AAM.
•Scott Kleinman assumed increased responsibilities as the co-principal executive officer and Co-President of AAM as of January 1, 2022, and began receiving his reduced annual base salary of $100,000, down from his $1.2 million 2021 base salary. He has received no new compensation except for distributions in respect of vested carry awards (i.e., owned partnership interests) that were awarded before 2022 (RSUs intended to cover five years were awarded in December 2021).
•James Belardi, Chairman and CEO of AHL, joined our Board of Directors on January 1, 2022 and entered into an amended and restated employment agreement with AHL on June 16, 2022, with no change to his base salary or annual incentive bonus opportunity. We discuss below modifications that were made to his ISG partnership interest at that time.
Other Compensation-Related Changes
•In connection with the Mergers, we rolled out a broadly based compensation reset, whereby we realigned executive officer compensation more closely with stockholders through increased direct equity ownership, particularly for AAM’s two Co-Presidents.
•The compensation committee adopted a peer group that includes Ares, BlackRock, Blackstone, Brookfield Asset Management, Carlyle, Goldman Sachs, KKR, Morgan Stanley, T. Rowe Price and TPG. The group was determined in consultation with Semler Brossy Consulting Group, LLC (“Semler Brossy”), the independent compensation consultant that advises our compensation committee, after considering factors such as industry, assets under management and
230
market capitalization. The group provides a helpful reference when reviewing our compensation and benefits programs.
General Compensation Philosophy
Alignment of Interests with Investors and Stockholders. Our principal compensation philosophy is to align the long-term interests of our named executive officers and other key employees with those of our stockholders and investors in the funds we manage. This alignment, which we believe is a key driver of our success, has been achieved principally by our professionals’ direct beneficial ownership of common stock, their rights to receive a portion of the performance fees earned from the funds we manage or to receive compensation based on the level of performance fees earned, the direct investment by our professionals in the funds we manage and our practice of paying annual compensation partly in the form of equity-based grants that are subject to vesting.
Long-Term Performance and Commitment. Most of our professionals (including Messrs. Kelly, Belardi and Suydam) are issued RSUs, as part of their year-end variable compensation, which provide rights to receive shares of common stock and, in some instances, dividend equivalents on those shares. The portion of the variable compensation paid as RSUs increases as the employee’s total compensation increases. The vesting, delayed liquidity and restrictive covenants (including forfeiture upon competition) features of these awards, and, for certain executives (including all named executive officers), the application of the executive share ownership guidelines to these awards, contribute to our professionals’ focus on long-term performance while enhancing retention of these professionals. Certain of the RSUs granted to our named executive officers and professionals vest based on both continued service and Apollo’s receipt of performance fees, within prescribed periods, sufficient to cover the associated equity-based compensation expense. We believe these performance measures help to promote the interests of our stockholders and investors in the funds we manage by making RSU vesting contingent on the realization and distribution of profits on such funds. By requiring our named executive officers to be subject to non-competition, confidentiality and other limitations on behavior described below under “Potential Payments upon Termination or Change in Control,” we further reinforce our culture of fiduciary protection of the investors in the funds Apollo manages and our stockholders.
Significant Personal Investment. Our named executive officers and other professionals generally make significant personal investments in the funds we manage (as more fully described under “Item 13. Certain Relationships and Related Transactions, and Director Independence”), directly or indirectly, and our named executive officers and other professionals who receive rights to performance fees (excluding rights in respect of non-drawdown-style funds and certain pooled performance fee vehicles) from the funds we manage are generally required to invest their own capital in the funds on which they work in amounts that are proportionate to the size of their participation in performance fees. We believe that these investments help to ensure that our professionals have capital at risk and reinforce the linkage between the success of the funds we manage, the success of the Company and the amounts earned by our professionals. Our eligible professionals are generally permitted to invest in the funds we manage free of management fees and, in certain instances, performance fees. These opportunities further align our employees with the investors in the funds we manage and our stockholders, encourage our professionals to work across the integrated asset management platform and bolster links among our various businesses.
Discouragement of Excessive Risk-Taking. Our compensation program includes significant elements that discourage excessive risk-taking while aligning the compensation of our professionals with our long-term performance. For example, a portion of our employees’ annual incentive compensation is paid in the form of RSUs that are subject to vesting, which reinforces employee focus on the Company’s long-term performance and enhances alignment with our stockholders. With regard to carried interest, we generally make payments in respect of performance fee allocations to our employees only after profitable investments have actually been realized. Similarly, for the funds that pay incentive fees, employees receive distributions of such fees only after the fund has appreciated in value (typically above a specified level) during the applicable period. This helps to ensure that our professionals take a long-term view that is consistent with the interests of the Company, our stockholders and the investors in the funds we manage. Moreover, if a drawdown-style fund fails to achieve specified investment returns due to diminished performance of later investments, our performance fee program relating to that fund generally permits, for the benefit of the limited partner investors in that fund, the return of performance fee distributions (generally net of tax) previously made to us or our employees. These provisions discourage excessive risk-taking and promote a long-term view that is consistent with the interests of the fund investors and our stockholders. In addition, our recoupment policy encourages compliance with our policies and discourages activities detrimental to the Company. Our general requirement that our professionals who hold direct performance fee rights in our drawdown-style funds invest in those funds further aligns the interests of our professionals, fund investors and stockholders. Finally, the minimum retained ownership requirements prescribed under the executive share ownership guidelines applicable to certain executives, and the delayed liquidity of certain RSUs, discourage excessive risk-
231
taking because the value is tied directly to the long-term performance of shares of common stock. Although investments in alternative assets can pose risks, we believe that these features help to mitigate those risks.
Compensation Elements for Named Executive Officers
Consistent with our emphasis on alignment of interests with our stockholders, our clients and fund investors, compensation elements tied to the performance of shares of our common stock, the profitability of our different businesses and the profitability of the funds that we manage are the primary means of compensating our named executive officers. The key elements of the compensation of our named executive officers during fiscal year 2022 are described below.
Annual Salary. Each of our named executive officers receives an annual salary. The 2022 base salaries of our named executive officers are set forth in the Summary Compensation Table below and were payable in accordance with their employment agreements, which were entered into before 2022 (except for Mr. Belardi, whose employment agreement was entered into in 2022, but his annual salary was unchanged from 2021). Mr. Rowan receives no compensation other than his annual base salary of $100,000.
RSUs. We award RSUs to our named executive officers (excluding Messrs. Rowan and Kleinman) to enhance their alignment with our stockholders. In early 2022, the compensation committee approved awards of RSUs to Messrs. Belardi, Kelly and Suydam, all of which are subject to service-based vesting. Mr. Suydam’s annual incentive RSUs were granted in accordance with the terms of his employment agreement and related to service in 2022.
Mr. Belardi receives RSUs both as part of his annual incentive bonus award and as a long-term incentive. Mr. Belardi’s annual incentive bonus RSUs vest in two equal annual installments and his long-term incentive RSUs vest in three equal annual installments. In February 2022, the compensation committee approved the financial, operational and other performance objectives that apply to determine his annual incentive bonus RSUs granted in consideration for 2022 services as further described below under “Determination of Compensation of Named Executive Officers.” All of the NEOs’ RSU awards discussed here are reflected in the Stock Awards column of the Summary Compensation Table.
Performance Fees. Performance fee entitlements with respect to the funds we manage confer rights to participate in distributions made to investors following the realization of an investment or receipt of operating profit from an investment by the fund, provided the fund has attained a specified performance return. Distributions of performance fees from limited life funds generally are subject to contingent repayment (generally net of tax) if the fund fails to achieve specified investment returns due to diminished performance of later investments, while distributions of operating profit earned from funds that are not designed to have a limited life are generally not subject to contingent repayment. The actual gross amount of performance fees available for distribution is a function of the performance of the applicable fund. For these reasons, we believe that participation in performance fees generated by the funds we manage aligns the interests of our participating named executive officers with those of our stockholders and fund investors. We currently have two principal types of performance fee programs, which we refer to as “dedicated” and “incentive pool.”
Performance Fees: Dedicated. Messrs. Kelly, Kleinman, Belardi and Suydam have historically been awarded rights to participate in a dedicated percentage of the performance fee income earned by the general partners of certain of the funds we manage, and in 2022, Messrs. Kelly, Kleinman and Suydam received distributions on vested dedicated performance fee rights granted to them in prior years. Dedicated performance fee rights in the private equity funds we manage are typically subject to vesting, which rewards long-term commitment to the Company and thereby enhances the alignment of participants’ interests with the Company. Messrs. Kelly and Suydam also received additional performance fee rights in 2022. In 2022, Messrs. Kelly and Suydam began participating in a program in which performance fees that accrue may be notionally invested by participants in a fund we manage until paid. Rights to payments under the program vest after three years, subject to continued employment, with the first payment to be made in 2025. As with other amounts distributed in respect of other performance fees, our financial statements characterize performance fee income allocated to participating professionals in respect of their dedicated performance fee rights as compensation. Amounts paid in respect of dedicated performance fees are included in the “All Other Compensation” column of the Summary Compensation Table.
A portion of the performance fees distributed by certain of the legacy investment funds we manage is required to be used by our employees who have dedicated rights to participate in those amounts to purchase restricted shares of common stock. This practice further promotes alignment with our stockholders and motivates participating professionals to maximize the success of the Company as a whole. Messrs. Kelly, Kleinman and Suydam have received grants of restricted shares of common stock as a result of their participation in legacy performance fee programs that require that a portion of the performance fee amounts be
232
used to purchase restricted shares of common stock. The restricted shares vest in three equal annual installments from a vesting date specified at the time of the award. The restricted shares participate in any distributions made on shares of common stock. The number of restricted shares that was granted in 2022 was determined pursuant to the formula prescribed by the applicable performance fee program, which converts the specified portion of the performance fee income to be paid or distributed into a number of shares based on the volume-weighted average price as of a prescribed date in the applicable calendar quarter. In accordance with applicable rules, the Summary Compensation Table and Grants of Plan-Based Awards Table include the restricted shares acquired by our named executive officers in 2022 in respect of performance fee amounts received.
Performance Fees: Incentive Pool. Our performance-based incentive arrangement, referred to as the incentive pool, further aligns the overall compensation of certain of our professionals to the realized performance of our business. The incentive pool provides for compensation based on realized performance fees and enhances our capacity to offer competitive compensation opportunities to our professionals. “Realized performance fees” means performance fees earned by the general partners of the funds we manage under the applicable fund limited partnership agreements based upon transactions that have closed or other rights to incentive income cash that have become fixed in the applicable calendar year period. Under this arrangement, Mr. Kelly, among other of our professionals, received incentive pool performance fees earned during 2022. During 2022, the Company determined the amount of the realized performance fees to place into the incentive pool in its discretion after considering various factors, including Company profitability, management company cash requirements and anticipated future costs, provided that the incentive pool consists of an amount equal to at least 1% of the realized performance fees attributable to profits generated after creation of the incentive pool that were taxable in the applicable year and not allocable to dedicated performance fee entitlements. Each participant in the incentive pool is entitled to receive, as a mandatory component of participation in the incentive pool, his or her pro rata share of this 1% amount each year, provided the participant remains employed by us at the time of allocation.
Annual Cash Partner Benefits Stipend. Messrs. Kelly and Suydam receive a supplemental annual cash partner benefits stipend of $250,000 that may be used for benefits or for other purposes.
Partnership Interest Revenue Sharing. Mr. Belardi owns a partnership interest in the parent of ISG, an indirect subsidiary of AGM that manages investments for Athene, which he has held since he founded ISG in 2009. This partnership interest provided Mr. Belardi 5% of the profit of ISG. On June 16, 2022, Mr. Belardi’s partnership interest was amended such that he receives quarterly distributions equal to 3.35% of base management fees and 4.5% of subadvisory fees earned by that partnership. This formulation was intended to be substantially equivalent in value to the ISG partnership interest’s previous 5% profit participation under the partnership agreement. This revenue sharing provides long-term alignment to invest in the ISG business to support future growth. The compensation committee does not have discretion over the amount of the distributions arising from Mr. Belardi’s ownership of this partnership interest. For additional discussion, please see “—Employment and Partnership Interest Agreements with AHL Chairman and Chief Executive Officer, James R. Belardi,” below. This partnership interest results in distributions, which, unlike dividends on common stock, are reported in the All Other Compensation column of the Summary Compensation Table pursuant to SEC rules.
Determination of Compensation of Named Executive Officers
As of January 1, 2022, the compensation committee assumed decision-making authority for named executive officer compensation.
2022 compensation for Messrs. Rowan, Kleinman and Suydam was set by their employment arrangements, which were put in place prior to 2022. Please note that under SEC technical reporting rules, distributions on existing vested partnership interests that were granted before 2022 are reported in the Summary Compensation Table below; these distributions do not relate to new grants.
For Messrs. Kelly and Belardi, factors that the compensation committee considered in making its determinations in respect of their annual incentive awards include the type, scope and level of responsibilities, corporate citizenship, enterprise-wide financial performance, and the named executive officer’s overall contributions to our success. For Mr. Kelly, the compensation committee also considered prior year compensation, the appropriate balance between incentives for long-term and short-term performance, competitive market dynamics and the compensation paid to his peers within AGM.
We believe that the compensation of our professionals should primarily be tied to our stock performance and the profitability of our different businesses and managed funds. The compensation committee determined that Mr. Kelly’s annual distribution from
233
the incentive pool would include an allocation that was based on the company’s performance and the compensation committee’s determination of his individual contributions to the company’s performance.
In early 2022, the compensation committee approved the annual RSU award grants to Messrs. Suydam and Kelly. Each of these RSU awards was consistent with the NEO’s prior year award.
The compensation committee also approved the grant to Mr. Belardi in early 2022 of a long term incentive RSU award, consistent with past practice, that vests in three equal annual installments. Mr. Belardi’s entry in the Stock Award column of the Summary Compensation Table reflects both this award and the following performance-based annual bonus or incentive award granted solely in the form of RSUs.
In February 2022, the compensation committee established an annual incentive bonus RSU opportunity of $1,850,000 for Mr. Belardi, consistent with his employment agreement and unchanged from his 2021 award opportunity.
In December 2022, following a review of performance in 2022, the compensation committee approved a payout of Mr. Belardi’s annual incentive bonus RSU award representing an overall award level at 110% of target, based on three factors. For 2022 and consistent with prior years, the compensation committee established that 25% of Mr. Belardi’s target annual incentive bonus RSU award would be based on a combination of five AHL corporate financial and operational goals consistent with the goals applicable to other executive officers of AHL, with the remaining portion based 25% on absolute and relative investment portfolio total return goals and 50% on the compensation committee’s review of overall AHL performance. The annual incentive bonus RSUs will appear in the Summary Compensation Table for 2023, as they were granted in February 2023.
The first investment portfolio total return performance objective, weighted 12.5%, compared AHL’s non-alternative investment performance to the Barclays US Aggregate Bond Index over a trailing 33-month period. The second investment portfolio total return performance objective, also weighted at 12.5%, compared AHL’s alternative investment performance relative to a 50-50 blended index of the S&P 500 and the BofA Merrill Lynch US High Yield Index over a 33-month period, subject to maintaining a minimum return on alternative investment performance since the inception of AHL.
The five AHL corporate performance measurements, their respective weightings and 2022 performance and achievement with respect to these measurements, as of the date of the compensation committee’s December 2022 meeting, are set forth below. The targets for the corporate financial and operational measures were determined in relation to AHL’s internal business plan for the year.
| Objectives | Weight | Measurement |
Target6
|
2022 Performance (Estimate) | ||||||||||
| Overall profitability | 35% |
Spread related earnings1
|
$2.055B | $2.349B | ||||||||||
| Expense management | 15% |
Expense targets2
|
— | Exceeded | ||||||||||
| Organic growth | 10% |
Organic deposits3
|
$36 - 38B | $46.9B | ||||||||||
| New business profitability | 15% |
Underwritten returns4
|
— | Exceeded | ||||||||||
| Capital | 25% |
Excess equity capital generation5
|
— | Target | ||||||||||
1 Spread related earnings is a pre-tax non-GAAP measure used to evaluate AHL’s financial performance excluding market volatility and expenses related to integration, restructuring, stock compensation and other expenses. Our spread related earnings equals net income (loss) available to AGM, eliminating the impact of investment gains (losses), net of offsets; non-operating change in insurance liabilities and related derivatives, net of offsets; integration, restructuring, and other non-operating expenses; stock compensation expenses; and income tax (expense) benefit.
| ||||||||||||||
2 Represents consolidated operating expenses included in operating income, including the impact of ACRA’s non-controlling interest, taking into account M&A, long-term incentive program, bonus accrual variances in relation to target, and the impact of any material transactions undertaken.
| ||||||||||||||
3 Organic deposits include retail independent marketing organization (IMO), retail financial institution, funding agreements, pension group annuities and flow reinsurance.
| ||||||||||||||
4 Underwritten returns on retail IMO, retail financial institution, funding agreements, pension risk transfer and flow reinsurance.
| ||||||||||||||
5 Increase in excess equity capital, with adjustments including, but not limited to, variance to AHL’s 2022 financial plan for the impact of former Apollo Operating Group units, preferred stock issuances, debt issuances, inorganic transactions, and certain other uses.
| ||||||||||||||
6 We believe that the targets were designed to be reasonably achievable with strong management performance and the coordinated, cross-functional focus and effort of the NEOs, and did not reflect unrealistic targets that may encourage excessive risk-taking.
| ||||||||||||||
AHL’s 2022 performance based on the five corporate objectives described above, would have resulted in a payout level equal to 114% of the corporate target opportunity based on actual performance of each metric limited by performance caps. The compensation committee, in consultation with management, approved an actual payout level equal to 130%, based on not having such caps apply to the organic deposit and new business profitability measures, deeming excess equity capital met at
234
target and then reducing the resulting payout from 140% to 130%. This was in recognition of extraordinary performance in 2022 for organic volumes, and high performance in the face of market conditions causing AHL to use more capital than expected and given the inability to access the capital markets at attractive financing terms.
The investment portfolio total return performance objectives are assessed based on a prescribed formula. For the investment portfolio total return performance objective based on AHL’s non-alternative investment performance, the compensation committee compared AHL’s results of (0.64)% for the 33-month period ending September 30, 2022 to (1.19)% for the Barclays US Aggregate Bond Index , which pursuant to the formula resulted in payout of 100% of the award for this objective. For the investment portfolio total return performance objective based on AHL’s alternative investment performance, the compensation committee compared AHL’s results of 13.30% for the 33-month period ending September 30, 2022 to 3.35% for the 50-50 blended index described above, which pursuant to the formula resulted in payout of 120% of the award.
The annual incentive bonus RSU awards vest in two equal annual installments, consistent with past practice for Mr. Belardi.
Employment Agreements
Our NEOs are party to employment, non-competition and non-solicitation agreements, as summarized below. All such agreements were entered into before 2022 (except for Mr. Belardi, whose employment agreement was entered into in 2022).
Employment, Non-Competition and Non-Solicitation Agreements with Chief Executive Officer, Marc Rowan
On December 31, 2021, we renewed the employment, non-competition and non-solicitation agreement with our Chief Executive Officer, Marc Rowan, who ceased to be the chief executive officer of AAM on that date and upon the closing of the Mergers became the Chief Executive Officer of AGM. The agreement is similar to his previous agreements and was extended by two years, to the end of 2023. Mr. Rowan’s annual base salary under the agreement remains $100,000 per year.
Employment, Non-Competition and Non-Solicitation Agreement with Chief Financial Officer, Martin Kelly
On July 2, 2012, we entered into an employment, non-competition and non-solicitation agreement with Martin Kelly, our Chief
Financial Officer. Mr. Kelly’s annual base salary is $1,000,000 and he is eligible for an annual allocation from the incentive pool in an amount to be determined by the compensation committee in its discretion.
Employment, Non-Competition and Non-Solicitation Agreement with Co-President, Scott Kleinman
On November 30, 2021, an ad hoc compensation committee (that preceded the formation of the compensation committee)approved a new employment agreement for Scott Kleinman, a Co-President of AAM. This new agreement governs his compensation for five years as he co-leads AAM following the Mergers. Under this agreement, he gave up all existing cash incentive compensation arrangements to the extent unvested and agreed to forgo all future entitlements in respect of bonus, unvested carry and other forms of compensation. In return, he earns the equivalent of one million shares per year for five years, plus the opportunity to earn an additional one million shares for meeting the fee-related earnings and spread-related earnings per share targets that AAM established in materials it shared with its public stockholders on October 19, 2021, in connection with its Investor Day. None of the shares underlying this one-time grant of six million RSUs will be delivered or transferable until five years after grant. Consistent with Apollo’s compensation philosophy of encouraging and rewarding extended periods of outstanding service, three million shares were vested at grant (subject to certain restrictive covenants) and the remainder are eligible to vest at the end of five years. We believe this arrangement drives complete alignment with the Company’s stockholders.
Under his employment agreement, effective January 1, 2022, Mr. Kleinman receives an annual base salary of $100,000 per year and receives no further bonuses, allocations of performance fees or other forms of new compensation. As required by the terms of his current performance fee arrangements, Mr. Kleinman has made investments of his own capital in various funds we manage, which investments continue.
235
Employment and Partnership Interest Agreements with AHL Chairman and Chief Executive Officer, James R. Belardi
In 2009, Mr. Belardi founded ISG and prior to 2022, was party to two separate employment agreements with AHL and ISG (together, the “Prior Agreements”). Since its inception, Mr. Belardi has served as chief executive officer of ISG, which is an indirect subsidiary of AGM that manages investments for Athene. On June 16, 2022, following approval by the compensation committee, AHL and Mr. Belardi entered into an amended and restated employment agreement, which superseded the Prior Agreements, with no change to his annual base salary or annual incentive bonus opportunity.
Under his current agreement, Mr. Belardi is employed by AHL and continues to serve as both AHL’s chief executive officer and ISG’s chief executive officer. Mr. Belardi’s annual base salary of $1,875,000 and target annual incentive bonus opportunity of $1,850,000 are the same aggregate amounts as were payable under the Prior Agreements. Any annual incentive bonus may be paid in the form of cash or publicly tradeable securities that vest in annual installments (such amount was paid in February 2023 in the form of RSUs for services performed in 2022). The current term of the agreement will expire on December 31, 2023, and will automatically extend for subsequent one-year terms unless Mr. Belardi gives or receives notice of non-renewal prior to expiration of the then current term.
In 2009, when Mr. Belardi founded ISG, he was granted a partnership interest in ISG’s parent. This partnership interest provided Mr. Belardi 5% of the profit of ISG. On June 16, 2022, the partnership agreement of AISG Holdings LP was amended such that the ISG partnership interest provides quarterly distributions equal to 3.35% of base management fees and 4.5% of subadvisory fees, consistent with the fee agreement by and between ISG and AHL, and the fee agreement by and between ISG and ACRA, each as in effect from time to time. This formulation was intended to be substantially equivalent in value to Mr. Belardi’s previous 5% profit participation in ISG. The move to revenue sharing provides long-term alignment to invest in the ISG business to support future growth. This partnership interest results in distributions which, unlike dividends on common stock, are reported in the All Other Compensation column of the Summary Compensation Table pursuant to SEC rules.
Additionally, under his current agreement, Mr. Belardi receives an additional annual amount equal to 3% of the profits of ISGI, subject to Mr. Belardi’s continued employment with AHL through the date it pays its annual bonuses for the applicable year.
Employment, Non-Competition and Non-Solicitation Agreement with Chief Legal Officer, John Suydam
On July 19, 2017, we entered into an employment, non-competition and non-solicitation agreement with John Suydam, our chief legal officer, which we amended on December 20, 2019. Pursuant to his agreement, Mr. Suydam is entitled to an annual base salary of $2,500,000 and an annual incentive award in the form of RSUs that have an aggregate value of $3,750,000 and vest in four equal quarterly installments, subject to the Company’s receipt of performance fees sufficient to cover the associated equity-based compensation expense.
Shareholder Advisory Vote
In 2020, our stockholders approved a triennial schedule for the say-on-pay advisory vote, which we adopted as our practice. In the last say-on-pay advisory vote in 2020, we received 97.55% approval by stockholders represented in person or by proxy at the meeting in 2020. Our next say-on-pay advisory vote will occur in connection with our 2023 Annual Meeting.
Executive Share Ownership Guidelines
The compensation committee adopted the executive share ownership guidelines, effective as of November 1, 2022, pursuant to which all executive officers of AGM, as well as certain members of senior management of AAM and AHL, are subject to minimum stock ownership requirements in connection with their service. The executive share ownership guidelines are consistent with good governance and enhance alignment with stockholders. The named executive officers are required to hold shares of common stock with the following aggregate values: Mr. Rowan, $15 million; each of Messrs. Kleinman and Belardi, $10 million; and each of Messrs. Kelly and Suydam, three times his annual base salary. All of the named executive officers are in compliance with their respective requirements under the executive share ownership guidelines.
Compensation Consultant
The compensation committee utilizes Semler Brossy as a third-party compensation consultant to provide independent advice, research and evaluation in connection with the design of our compensation for our executive officers and directors.
236
Tax and Accounting Considerations
We consider the tax and accounting impact of compensation alongside the objectives of the executive compensation programs and our compensation philosophy.
Section 162(m) of the Internal Revenue Code (“Section 162(m)”) generally disallows, absent a “grandfathering” or other available exemption, a tax deduction to public companies for compensation paid in excess of $1 million to “covered employees” under Section 162(m) (generally, such company’s chief executive officer, its chief financial officer, its three other highest paid executive officers and certain individuals who were covered employees in years other than the then-current taxable year).
Under final regulations released in December 2020 that reversed a long-standing position of the Internal Revenue Service, Section 162(m) applies to corporations, such as the Company, in respect of the compensation of covered employees of an operating partnership for which the compensation deduction is allocable to the corporation based on its interest in the partnership. While we consider the deductibility of compensation as a factor in making compensation decisions, we retain the flexibility to provide compensation that is consistent with the Company’s goals for its executive compensation program, even if such compensation is not tax deductible.
Compensation Committee Interlocks and Insider Participation
No member of the compensation committee is or has been an officer or employee of the Company. No member of the compensation committee is, or was in 2022, an executive officer of another entity at which one of our executive officers serves, or served in 2022, on either the board of directors or the compensation committee. Messrs. Kleinman and Zelter, who serve as executive officers and directors of AGM, also serve as directors and executive officers of AAM, our controlled subsidiary that does not have a board committee overseeing compensation. In addition, our CEO, Mr. Rowan, serves on the executive committee of the board of directors of AHL. The AHL executive committee is responsible for the compensation of the named executive officers of AHL other than Mr. Belardi, who is AHL’s chief executive officer and serves on our board. For information about related person transactions involving members of our Board of Directors, see “Item 13. Certain Relationships and Related Transactions and Director Independence.”
Compensation Committee Report
The compensation committee has reviewed and discussed with management the foregoing Compensation Discussion and Analysis and, based on such review and discussion, has determined that the Compensation Discussion and Analysis should be included in this Annual Report on Form 10-K.
Marc Beilinson
Richard Emerson
Lynn Swann
237
Summary Compensation Table
The following Summary Compensation Table sets forth information concerning the compensation earned by, awarded or paid to our principal executive officer, our principal financial officer and our three other most highly compensated executive officers for the fiscal year ended December 31, 2022. For Mr. Kleinman, 2022 amounts in the “Stock Awards” column relate to legacy performance fee programs in which he had vested before 2022 that require that a portion of the performance fee amounts be used to purchase restricted shares of common stock. Similarly, awards reported under the “All Other Compensation” column for Messrs. Kleinman and Belardi are distributions with respect to vested partnership interests that were awarded prior to 2022.
| Name and Principal Position | Year | Salary ($) |
Bonus ($) |
Stock Awards
($)1
|
All Other Compensation
($)2
|
Total ($) |
||||||||||||||||||||||||||||||||
|
Marc Rowan,
Chief Executive Officer
|
2022 | 100,000 | — | — | 210,011 | 310,011 | ||||||||||||||||||||||||||||||||
| 2021 | 100,000 | — | — | 202,310 | 302,310 | |||||||||||||||||||||||||||||||||
| 2020 | 100,000 | — | — | 180,340 | 280,340 | |||||||||||||||||||||||||||||||||
|
Martin Kelly,
Chief Financial Officer
|
2022 | 1,000,000 | — | 1,082,082 | 1,491,637 | 3,573,719 | ||||||||||||||||||||||||||||||||
| 2021 | 1,000,000 | — | 19,160,680 | 4,135,828 | 24,296,508 | |||||||||||||||||||||||||||||||||
| 2020 | 1,000,000 | — | 7,396,975 | 1,109,528 | 9,506,503 | |||||||||||||||||||||||||||||||||
|
Scott Kleinman,
Co-President of AAM
|
2022 | 100,000 | — | 3,976,560 | 8,081,234 | 12,157,794 | ||||||||||||||||||||||||||||||||
| 2021 | 1,200,000 | — | 392,478,845 | 43,308,266 | 436,987,111 | |||||||||||||||||||||||||||||||||
| 2020 | 1,200,000 | — | 3,453,704 | 3,014,797 | 7,668,501 | |||||||||||||||||||||||||||||||||
|
James Belardi,
Chairman and Chief Executive Officer of AHL
|
2022 | 1,741,141 | 3 |
209,326 | 4 |
6,428,865 | 36,316,113 | 44,695,445 | ||||||||||||||||||||||||||||||
|
John Suydam,
Chief Legal Officer of AGM
|
2022 | 2,500,000 | — | 3,961,338 | 1,928,714 | 8,390,052 | ||||||||||||||||||||||||||||||||
1 Represents the aggregate grant date fair value of stock awards granted, as applicable, computed in accordance with FASB ASC Topic 718. For Mr. Belardi, includes both the annual incentive bonus RSUs and the long-term incentive RSUs granted to him in 2022. For Mr. Kleinman, amounts shown relate to legacy performance fee programs in which he had vested before 2022 that require that a portion of the performance fee amounts be used to purchase restricted shares of common stock. The amounts shown in this column do not reflect compensation actually received by the named executive officers, but instead represent the aggregate grant date fair value of the awards. See note 14 to our consolidated financial statements for further information concerning the assumptions made in valuing our RSU awards.
| ||||||||||||||||||||||||||||||||||||||
2 Amounts included for 2022 represent, in part, actual incentive pool cash distributions of $1,175,000 for Mr. Kelly, realized carry cash distributions of $66,637 for Mr. Kelly, $8,081,234 for Mr. Kleinman and $1,678,714 for Mr. Suydam and partner benefits stipends of $250,000 for each of Messrs. Kelly and Suydam. For Mr. Belardi, the amount includes distributions on his ISG partnership interest totaling $35,292,707 and amounts in respect of his ISGI profits entitlement ($885,191), fees paid by AHL for financial and estate planning services ($133,859), primarily to assist Mr. Belardi with estate planning with respect to his equity holdings, and fees paid by AHL for UK tax preparation services ($4,356). AHL maintains a corporate aircraft for efficiency and business planning purposes. Mr. Belardi used the corporate aircraft for one personal flight in 2022 and fully reimbursed AHL for this personal use. Accordingly, no amount is reflected for such use. Personal use of the AHL corporate aircraft is subject to a formal policy that was approved by the compensation committee in 2022 that sets forth the criteria and procedures applicable to its use. Mr. Belardi and AHL have entered into a time-sharing agreement, pursuant to which Mr. Belardi may use the corporate aircraft for up to 25 flight hours per year, provided that the number of flight hours and other incidentals under such agreement shall be further limited so that the amount of payments from Mr. Belardi pursuant to such agreement (including such tax payments) shall not exceed $120,000 in any AHL fiscal year. Occasionally, a guest may accompany Mr. Belardi on AHL corporate aircraft when the aircraft is already scheduled for business purposes and can accommodate additional passengers. In those cases, there is no additional aggregate incremental cost to AHL and, as a result, no amount would be reflected in the Summary Compensation Table for the applicable year. The “All Other Compensation” column for 2022 also includes costs relating to Company-provided cars and drivers for the business and personal use of Mr. Rowan. We provide this benefit because we believe that its cost is outweighed by the convenience, increased efficiency and added security and confidentiality that it offers. Mr. Rowan’s personal use cost was approximately $193,140 and includes both fixed and variable costs, including lease costs, driver compensation, driver meals, fuel, parking, tolls, repairs, maintenance and insurance. Except as discussed in this paragraph, no 2022 perquisites or personal benefits individually exceeded the greater of $25,000 or 10% of the total amount of all perquisites and other personal benefits reported for the named executive officer. The 2022 cost of excess liability insurance provided to our named executive officers falls below this threshold. Messrs. Kelly, Kleinman and Suydam did not receive perquisites or personal benefits in 2022, except for incidental benefits having an aggregate value of less than $10,000. Our named executive officers also receive secretarial support with respect to personal matters, for which we incur no incremental cost. Accordingly, no such amounts are included in the Summary Compensation Table.
| ||||||||||||||||||||||||||||||||||||||
3 The amount reported in the salary column for Mr. Belardi for 2022 represents his annualized base salary of $1,875,000, reduced by $133,859 that was deducted from his salary in respect of fees for financial and estate planning services prior to entry into his amended and restated employment agreement, as described in footnote 2 above.
| ||||||||||||||||||||||||||||||||||||||
4 This amount represents the January 2022 payout of the supplemental cash bonus that had been awarded to Mr. Belardi by the AHL compensation committee in February 2021. This is the second of two installments that were payable under that legacy AHL cash bonus award.
| ||||||||||||||||||||||||||||||||||||||
238
Grants of Plan-Based Awards
The following table presents information regarding RSUs and restricted shares granted to our named executive officers under our 2019 Omnibus Equity Incentive Plans in 2022. No options were granted to a named executive officer in 2022.
| Name | Grant Date |
All Other Stock Awards:
Number of Shares of Stock or Units (#)1
|
Grant Date Fair Value or Modification Date Incremental Fair Value of Stock and Option Awards ($)2
|
|||||||||||||||||
| Marc Rowan | — | — | — | |||||||||||||||||
| Martin Kelly | February 17, 2022 | 17,006 | 1,069,677 | |||||||||||||||||
| February 15, 2022 | 162 | 11,181 | ||||||||||||||||||
| August 16, 2022 | 9 | 531 | ||||||||||||||||||
| November 15, 2022 | 11 | 692 | ||||||||||||||||||
| Scott Kleinman | February 15, 2022 | 22,051 | 1,521,960 | |||||||||||||||||
| February 15, 2022 | 22,190 | 1,531,554 | ||||||||||||||||||
| May 16, 2022 | 9,082 | 473,758 | ||||||||||||||||||
| August 16, 2022 | 457 | 26,959 | ||||||||||||||||||
| August 16, 2022 | 2,792 | 164,701 | ||||||||||||||||||
| November 15, 2022 | 725 | 45,612 | ||||||||||||||||||
| November 15, 2022 | 3,370 | 212,016 | ||||||||||||||||||
| James Belardi | February 23, 2022 | 17,149 | 3 |
1,029,111 | ||||||||||||||||
| February 23, 2022 | 17,150 | 3 |
1,029,172 | |||||||||||||||||
| February 23, 2022 | 36,495 | 4 |
2,185,321 | |||||||||||||||||
| February 23, 2022 | 36,494 | 4 |
2,185,261 | |||||||||||||||||
| John Suydam | February 17, 2022 | 54,741 | 3,373,140 | |||||||||||||||||
| February 15, 2022 | 2,334 | 161,092 | ||||||||||||||||||
| February 15, 2022 | 4,718 | 325,635 | ||||||||||||||||||
| May 16, 2022 | 804 | 41,940 | ||||||||||||||||||
| August 16, 2022 | 48 | 2,832 | ||||||||||||||||||
| August 16, 2022 | 317 | 18,700 | ||||||||||||||||||
| November 15, 2022 | 57 | 3,586 | ||||||||||||||||||
| November 15, 2022 | 547 | 34,413 | ||||||||||||||||||
1 Represents the number of RSUs and restricted shares granted, as applicable. RSUs and restricted shares are discussed above under “—Compensation Elements for Named Executive Officers—RSUs” and “Compensation Elements for Named Executive Officers—Performance Fees: Dedicated,” respectively. Except for the RSUs (which awards were all granted on February 17 or 23, 2022), all awards were restricted shares granted in respect of performance fee entitlements entered into prior to 2022.
| ||||||||||||||||||||
2 Represents the aggregate grant date fair value of the RSUs and restricted shares granted in 2022, computed in accordance with FASB ASC Topic 718. The amounts shown do not reflect compensation actually received, but instead represent the aggregate grant date fair value of the award.
| ||||||||||||||||||||
3 Represents the grant made in respect of Mr. Belardi’s annual incentive award.
| ||||||||||||||||||||
4 Represents the grant made in respect of Mr. Belardi’s long-term award.
| ||||||||||||||||||||
239
Outstanding Equity Awards at Fiscal Year-End
The following table presents information regarding unvested RSU and restricted share awards made by us to our named executive officers under the equity plans that were outstanding at December 31, 2022. Mr. Belardi is our only named executive officer who held options at fiscal year-end, which options were granted before 2022.
| Name | Grant Date | Grant Type | Number of Shares, Units or Other Rights That Have Not Vested (#) |
Market or Payout Value of Shares, Units or Other Rights That Have Not Vested
($)1
|
Equity Incentive Plan Awards: Number of Unearned Shares, Units or Other Rights That Have Not Vested (#) |
Equity Incentive Plan Awards: Market or Payout Value of Unearned Shares, Units or Other Rights That Have Not Vested ($)2
|
||||||||||||||||||||||||||||||||
| Marc Rowan | — | — | — | — | — | — | ||||||||||||||||||||||||||||||||
| Martin Kelly | November 15, 2022 | Restricted Shares | 11 | 3 |
702 | — | — | |||||||||||||||||||||||||||||||
| August 16, 2022 | Restricted Shares | 9 | 4 |
574 | — | — | ||||||||||||||||||||||||||||||||
| February 17, 2022 | RSUs | 11,338 | 5 |
723,251 | — | — | ||||||||||||||||||||||||||||||||
| February 15, 2022 | Restricted Shares | 108 | 6 |
6,889 | — | — | ||||||||||||||||||||||||||||||||
| November 17, 2021 | Restricted Shares | 134 | 7 |
8,548 | — | — | ||||||||||||||||||||||||||||||||
| August 17, 2021 | Restricted Shares | 811 | 8 |
51,734 | — | — | ||||||||||||||||||||||||||||||||
| February 19, 2021 | RSUs | 3,788 | 9 |
241,637 | — | — | ||||||||||||||||||||||||||||||||
| February 19, 2021 | RSUs | 46,823 | 10 |
2,986,839 | — | — | ||||||||||||||||||||||||||||||||
| February 19, 2021 | RSUs | 3,902 | 11 |
248,909 | — | — | ||||||||||||||||||||||||||||||||
| February 11, 2020 | RSUs | 94,692 | 12 |
6,040,403 | — | — | ||||||||||||||||||||||||||||||||
| January 10, 2019 | RSUs | 40,097 | 13 |
2,557,788 | — | — | ||||||||||||||||||||||||||||||||
| Scott Kleinman | November 15, 2022 | Restricted Shares | 3,370 | 3 |
214,972 | — | — | |||||||||||||||||||||||||||||||
| November 15, 2022 | Restricted Shares | 725 | 3 |
46,248 | — | — | ||||||||||||||||||||||||||||||||
| August 16, 2022 | Restricted Shares | 2,792 | 4 |
178,102 | — | — | ||||||||||||||||||||||||||||||||
| August 16, 2022 | Restricted Shares | 457 | 4 |
29,152 | — | — | ||||||||||||||||||||||||||||||||
| May 16, 2022 | Restricted Shares | 9,082 | 14 |
579,341 | — | — | ||||||||||||||||||||||||||||||||
| February 15, 2022 | Restricted Shares | 14,794 | 15 |
943,709 | — | — | ||||||||||||||||||||||||||||||||
| February 15, 2022 | Restricted Shares | 14,701 | 16 |
937,777 | — | — | ||||||||||||||||||||||||||||||||
| December 1, 2021 | RSUs | — | — | 1,000,000 | 17 |
63,790,001 | ||||||||||||||||||||||||||||||||
| December 1, 2021 | RSUs | 2,000,000 | 18 |
127,580,002 | — | — | ||||||||||||||||||||||||||||||||
| November 17, 2021 | Restricted Shares | 19,563 | 7 |
1,247,924 | — | — | ||||||||||||||||||||||||||||||||
| November 17, 2021 | Restricted Shares | 27,784 | 7 |
1,772,341 | — | — | ||||||||||||||||||||||||||||||||
| August 17, 2021 | Restricted Shares | 45,844 | 8 |
2,924,389 | — | — | ||||||||||||||||||||||||||||||||
| February 19, 2021 | RSUs | 1,400 | 23 |
89,306 | — | — | ||||||||||||||||||||||||||||||||
| January 8, 2018 | RSUs | 160,000 | 19 |
10,206,400 | — | — | ||||||||||||||||||||||||||||||||
| James Belardi | February 23, 2022 | RSUs | 24,330 | 5 |
1,552,011 | — | — | |||||||||||||||||||||||||||||||
| February 23, 2022 | RSUs | 24,330 | 5 |
1,552,011 | — | — | ||||||||||||||||||||||||||||||||
| February 23, 2022 | RSUs | 8,575 | 22 |
546,999 | — | — | ||||||||||||||||||||||||||||||||
| February 23, 2022 | RSUs | 8,575 | 22 |
546,999 | — | — | ||||||||||||||||||||||||||||||||
| May 18, 2021 | RSUs | 14,590 | 22 |
930,696 | — | — | ||||||||||||||||||||||||||||||||
| February 22, 2021 | RSUs | 10,265 | 9 |
654,804 | — | — | ||||||||||||||||||||||||||||||||
| February 22, 2021 | RSUs | 10,265 | 9 |
654,804 | — | — | ||||||||||||||||||||||||||||||||
| February 22, 2021 | Restricted Shares | 12,101 | 24 |
771,923 | — | — | ||||||||||||||||||||||||||||||||
| February 21, 2020 | RSUs | 4,816 | 24 |
307,213 | — | — | ||||||||||||||||||||||||||||||||
| February 21, 2020 | RSUs | 28,892 | 24 |
1,843,020 | — | — | ||||||||||||||||||||||||||||||||
240
| John Suydam | November 15, 2022 | Restricted Shares | 195 | 3 |
12,439 | — | — | |||||||||||||||||||||||||||||||
| November 15, 2022 | Restricted Shares | 352 | 3 |
22,454 | — | — | ||||||||||||||||||||||||||||||||
| November 15, 2022 | Restricted Shares | 57 | 3 |
3,636 | — | — | ||||||||||||||||||||||||||||||||
| August 16, 2022 | Restricted Shares | 317 | 4 |
20,221 | — | — | ||||||||||||||||||||||||||||||||
| August 16, 2022 | Restricted Shares | 48 | 4 |
3,062 | — | — | ||||||||||||||||||||||||||||||||
| May 16, 2022 | Restricted Shares | 804 | 14 |
51,287 | — | — | ||||||||||||||||||||||||||||||||
| February 17, 2022 | RSUs | 13,686 | 19 |
873,030 | — | — | ||||||||||||||||||||||||||||||||
| February 15, 2022 | Restricted Shares | 3,146 | 6 |
200,683 | — | — | ||||||||||||||||||||||||||||||||
| February 15, 2022 | Restricted Shares | 1,556 | 6 |
99,257 | — | — | ||||||||||||||||||||||||||||||||
| November 17, 2021 | Restricted Shares | 3,010 | 7 |
192,008 | — | — | ||||||||||||||||||||||||||||||||
| November 17, 2021 | Restricted Shares | 2,072 | 7 |
132,173 | — | — | ||||||||||||||||||||||||||||||||
| August 17, 2021 | Restricted Shares | 3,185 | 8 |
203,171 | — | — | ||||||||||||||||||||||||||||||||
| Name | Grant Date | Grant Type | Number of Securities Underlying Unexercised Options (#) Exerciseable | Number of Securities Underlying Unexercised Options (#) (Unexercisable) |
Option Exercise Price ($) |
Option Expiration Date | ||||||||||||||||||||||||||||||||
| James Belardi | February 22, 2021 | Options | 22,476 | 44,954 | 20 |
40.60 | February 22, 2031 | |||||||||||||||||||||||||||||||
| February 28, 2020 | Options | 44,658 | 22,332 | 21 |
43.27 | February 21, 2030 | ||||||||||||||||||||||||||||||||
| April 3, 2019 | Options | 74,033 | — | 36.94 | April 3, 2029 | |||||||||||||||||||||||||||||||||
| February 27, 2018 | Options | 76,153 | — | 41.82 | February 27, 2028 | |||||||||||||||||||||||||||||||||
| March 21, 2017 | Options | 76,153 | — | 44.10 | March 21, 2027 | |||||||||||||||||||||||||||||||||
| June 6, 2016 | Options | 147,813 | — | 29.55 | June 6, 2026 | |||||||||||||||||||||||||||||||||
1 The dollar amounts shown in this column are determined by multiplying the number of shares or units reported in the “Number of Shares, Units or Other Rights That Have Not Vested” column by $63.79, the closing price of a share of common stock on the last trading day of 2022.
| ||||||||||||||||||||||||||||||||||||||
2 The dollar amounts shown in this column are determined by multiplying the number of shares or units reported in the “Equity Incentive Plan Awards: Number of Unearned Shares, Units or Other Rights That Have Not Vested” column by $63.79, the closing price of a share of common stock on the last trading day of 2022.
| ||||||||||||||||||||||||||||||||||||||
3 Restricted shares that vest in substantially equal annual installments on August 15 of each of 2023, 2024 and 2025.
| ||||||||||||||||||||||||||||||||||||||
4 Restricted shares that vest in substantially equal annual installments on May 15 of each of 2023, 2024 and 2025.
| ||||||||||||||||||||||||||||||||||||||
5 RSUs that vest in substantially equal annual installments on December 31 of each of 2023 and 2024.
| ||||||||||||||||||||||||||||||||||||||
6 Restricted shares that vest in substantially equal annual installments on November 15 of each of 2023 and 2024.
| ||||||||||||||||||||||||||||||||||||||
7 Restricted shares that vest in substantially equal annual installments on August 15 of each of 2023 and 2024.
| ||||||||||||||||||||||||||||||||||||||
8 Restricted shares that vest in substantially equal annual installments on May 15 of each of 2023 and 2024.
| ||||||||||||||||||||||||||||||||||||||
9 RSUs that vest in substantially equal annual installments on January 1 of each of 2023 and 2024.
| ||||||||||||||||||||||||||||||||||||||
10 RSUs that vest in substantially equal annual installments on January 1 of each of 2023, 2024, 2025 and 2026, subject to the Company’s receipt of performance fees, within prescribed periods, sufficient to cover the associated equity-based compensation expense as of such date.
| ||||||||||||||||||||||||||||||||||||||
11 RSUs that vest in substantially equal annual installments on January 1, 2023 and 2024, subject to the Company’s receipt of performance fees, within prescribed periods, sufficient to cover the associated equity-based compensation expense as of such date.
| ||||||||||||||||||||||||||||||||||||||
12 RSUs that vest in substantially equal annual installments on January 1 of each of 2023, 2024 and 2025, subject to the Company’s receipt of performance fees, within prescribed periods, sufficient to cover the associated equity-based compensation expense as of such date.
| ||||||||||||||||||||||||||||||||||||||
13 RSUs that vest in substantially equal annual installments on January 1 of each of 2023 and 2024, subject to the Company’s receipt of performance fees, within prescribed periods, sufficient to cover the associated equity-based compensation expense as of such date.
| ||||||||||||||||||||||||||||||||||||||
14 Restricted shares that vest in substantially equal annual installments on February 15 of each of 2023, 2024 and 2025.
| ||||||||||||||||||||||||||||||||||||||
15 Restricted shares that vest in substantially equal annual installments on November 15 of each of 2023 and 2024.
| ||||||||||||||||||||||||||||||||||||||
16 Restricted shares that vest in substantially equal annual installments on November 15 of each of 2023 and 2024.
| ||||||||||||||||||||||||||||||||||||||
17 RSUs that vest on April 1, 2027, subject to achievement of fee-related and spread-related earnings targets.
| ||||||||||||||||||||||||||||||||||||||
18 RSUs that vest on January 1, 2027.
| ||||||||||||||||||||||||||||||||||||||
19 RSUs that vest on January 1, 2023, subject to the Company’s receipt of performance fees, within prescribed periods, sufficient to cover the associated equity-based compensation expense as of such date.
| ||||||||||||||||||||||||||||||||||||||
20 Options that vest in substantially equal annual installments on January 1 of each of 2023 and 2024.
| ||||||||||||||||||||||||||||||||||||||
21 Options that vest on January 1, 2023.
| ||||||||||||||||||||||||||||||||||||||
22 RSUs that vest on December 31, 2023.
| ||||||||||||||||||||||||||||||||||||||
23 Restricted shares that vest on January 1, 2023.
| ||||||||||||||||||||||||||||||||||||||
24 RSUs that vest on January 1, 2023.
| ||||||||||||||||||||||||||||||||||||||
241
Option Exercises and Stock Vested
The following table presents information regarding the number of outstanding initially unvested RSUs and restricted shares held by our named executive officers that vested during 2022 and the number of vested RSUs that were granted during 2022. The amounts shown below do not reflect compensation actually received by the named executive officers, but instead are calculations of the number of RSUs and restricted shares that vested (or that were vested at grant) during 2022 based on the closing price of a share of common stock on the date of vesting. Shares received by our named executive officers in respect of vested RSUs are subject to our retained ownership requirements prescribed under the executive share ownership guidelines. No options were exercised by our named executive officers in 2022.
| Name | Type of Award | Number of Shares Acquired on Vesting (#) |
Value Realized on Vesting
($)1
|
|||||||||||||||||
| Marc Rowan | — | — | — | |||||||||||||||||
| Martin Kelly | RSUs | 78,809 | 5,532,393 | |||||||||||||||||
| Restricted Shares | 1,168 | 70,597 | ||||||||||||||||||
| Scott Kleinman | RSUs | 161,399 | 11,534,042 | |||||||||||||||||
| Restricted Shares | 97,559 | 5,957,056 | ||||||||||||||||||
| James Belardi | RSUs | 99,912 | 6,509,531 | |||||||||||||||||
| Restricted Shares | 77,513 | 5,210,289 | ||||||||||||||||||
| John Suydam | RSUs | 62,852 | 3,848,182 | |||||||||||||||||
| Restricted Shares | 8,328 | 512,157 | ||||||||||||||||||
1 Amounts calculated by multiplying the number of RSUs or restricted shares held by the named executive officer that vested on each applicable vesting date in 2022 by the closing price per share on that date. Except for RSUs that were vested at grant, for which the associated shares are not scheduled to be delivered until 2027, shares underlying the vested RSUs were issued to the named executive officer shortly after they vested.
| ||||||||||||||||||||
Potential Payments upon Termination or Change in Control
None of the named executive officers, except for Mr. Belardi, is entitled to payment or other benefits in connection with a change in control.
Mr. Rowan is not entitled to severance or other payments or benefits in the event of a termination of employment with AGM. Mr. Rowan is required to protect the confidential information of Apollo both during and after his employment. In addition, until two years after the termination, he is required to refrain from soliciting employees or interfering with our relationships with investors and, for 18 months to refrain from competing with us in a business that involves primarily (i.e., more than 50%) third-party capital.
If Mr. Kelly’s employment is terminated by us without cause or he resigns for good reason, he will be entitled to severance of six months’ base pay and reimbursement of health insurance premiums paid in the six months following his employment termination. If his employment is terminated by us without cause, he will vest in 50% of any unvested portion of his restricted shares. If Mr. Kelly’s employment is terminated by reason of death or disability, he will vest in 50% or more of any unvested portion of his RSUs, restricted shares and dedicated performance fee rights that are subject to vesting. All additional vesting of RSUs subject to the receipt of performance fees within prescribed periods remains subject to those requirements. If Mr. Kelly’s employment is terminated without cause, or he resigns, he will be entitled to retain his dedicated performance fee rights that are subject to vesting to the extent then vested. We may terminate Mr. Kelly’s employment with or without cause, and we will provide 90 days’ notice (or payment in lieu of such period of notice) prior to a termination without cause. Mr. Kelly is required to give us 90 days’ notice prior to a resignation for any reason. He is required to protect the confidential information of Apollo both during and after employment. In addition, Mr. Kelly is obligated to refrain from soliciting our employees until 18 months after employment, from soliciting our investors or other business relations until 12 months after employment and from competing with us until nine months after employment.
We may terminate Mr. Kleinman’s employment with or without cause, and we must provide 90 days’ notice (or payment in lieu of such period of notice) prior to a termination without cause. Mr. Kleinman is required to provide 90 days’ notice prior to a resignation for any reason. If his employment is terminated by us without cause, he will vest in 50% of any unvested portion of his restricted shares, and upon such a termination or a resignation with good reason, Mr. Kleinman will vest in 100% of the time-vesting RSUs granted to him in December 2021. Upon his termination of employment by reason of death or disability, Mr.
242
Kleinman will vest in 50% or more of his then-unvested RSUs and restricted shares. All additional vesting of RSUs subject to the Company’s receipt of performance fees within prescribed periods remains subject to those requirements. If Mr. Kleinman’s employment is terminated without cause, or he resigns for any reason, he will be entitled to retain his vested dedicated performance fee rights. Mr. Kleinman is required to protect the confidential information of Apollo both during and after employment. In addition, during employment and for 24 months after employment, he is obligated to refrain from soliciting our employees, investors or other business relations, and, during employment and for 18 months thereafter, from competing with us.
We may terminate Mr. Belardi’s employment with or without cause, and he will provide at least 90 days’ notice of his resignation without good reason. Severance is payable to Mr. Belardi on a termination of employment by AHL without cause or by reason of nonrenewal of the term of his employment agreement, by Mr. Belardi for good reason, or due to Mr. Belardi’s death or disability (each, an “involuntary termination”), equal to his annual base salary and a pro rata bonus for the year of termination based, in part, on the bonus and annual salary paid to him in the year preceding his termination. Upon an involuntary termination other than due to death or disability, Mr. Belardi is also entitled to additional severance equal to his target annual incentive bonus multiplied by a fraction, the numerator of which is his annual incentive bonus for the previous fiscal year and the denominator of which is his annual base salary for the previous fiscal year. In addition, upon an involuntary termination, Mr. Belardi will be entitled to the reimbursement of the cost of continued medical coverage at active employee rates for up to 18 months, any outstanding and unvested time vesting profits units that are scheduled to vested during the one-year period immediately following the termination date will immediately vest, and any outstanding and unvested equity awards granted as a component of an annual incentive bonus will immediately vest, based on target performance with respect to any performance-vesting awards.
Mr. Belardi’s employment agreement contains customary restrictive covenants, including confidentiality and nondisclosure covenants, covenants not to compete or solicit customers for 12 months following the date on which he ceases to own or control his ISG partnership interest, and a covenant not to solicit employees for 24 months following termination.
To the extent that any payment, benefit or distribution of any type to or for the benefit of Mr. Belardi would be subject to the excise tax imposed under Section 4999 of the Code, then such payments, benefits or distributions will be reduced (but not below zero) so that the maximum amount of such payments, benefits or distributions will be one dollar less than the amount which would cause them to be subject to such excise tax, unless Mr. Belardi makes the Company and its affiliates whole on an after-tax basis for any adverse tax consequences imposed on the Company and its affiliates under Section 280G of the Code as a result of not reducing such payments, benefits or distributions.
Under the ISG partnership agreement, on an involuntary termination or a resignation that satisfies the partnership agreement’s notice and other requirements, on or after December 31, 2023, Mr. Belardi’s ISG partnership interest will be redeemable for an amount equal to five times the average annual distributions on the ISG partnership interest for the preceding two years. His ISG partnership interest will also be redeemable for a prorated amount following an earlier involuntary termination, based on the number of days that precede such termination during the three-year period ending December 31, 2023. Any redemption of the ISG partnership interest is subject to Mr. Belardi’s continued compliance with all applicable restrictive covenants, and may be settled in cash or stock at our option. Mr. Belardi is obligated to protect our confidential information both during and after employment. He is also obligated to refrain from competing or soliciting customers until 12 months after he ceases to own or control his ISG partnership interest, and from soliciting employees until 24 months after such cessation.
We may terminate Mr. Suydam’s employment with or without cause, and we will provide 90 days’ notice (or payment in lieu of such period of notice) prior to a termination without cause. If Mr. Suydam’s employment is terminated by us without cause or he resigns for good reason, he will be entitled to severance of six months’ base pay and reimbursement of health insurance premiums paid in the six months following his employment termination. If his employment is terminated by reason of death or disability, he will vest in 50% of his then unvested RSUs, restricted shares and dedicated performance fee rights that are subject to vesting. If Mr. Suydam’s employment is terminated without cause, or he resigns, he will be entitled to retain his dedicated performance fee rights that are subject to vesting to the extent then vested. Upon his termination of employment, Mr. Suydam will vest in 100% of his then unvested restricted shares, subject to his continued compliance with his noncompetition obligations and his agreement to be available to consult with us from time to time for two years. Mr. Suydam is required to protect the confidential information of Apollo both during and after employment. In addition, to the extent consistent with appliable rules, he is obligated to refrain from soliciting our employees until 18 months after employment, from soliciting our investors or other business relations until 12 months after employment and from competing with us until nine months after employment.
243
The following table lists the estimated amounts that would have been payable to each of our named executive officers under his employment arrangements and outstanding equity awards in connection with a termination that occurred on the last day of our last completed fiscal year and the value of any additional equity that would vest upon such termination, assuming that the applicable triggering event occurred on December 31, 2022, and that the price per share was $63.79, which was the closing price of a share of common stock on the last trading day of the year. As described above and in footnote 4 below, Mr. Belardi also would have been eligible to receive an amount in redemption of his ISG partnership interest in connection with certain terminations of his employment.
| Name | Reason for Employment Termination |
Estimated Value of Cash Payments
($)1
|
Estimated Value of Equity Acceleration
($)2
|
|||||||||||||||||
| Marc Rowan | Cause | — | — | |||||||||||||||||
| Death, disability | — | — | ||||||||||||||||||
| Martin Kelly | Without cause | 512,553 | 34,223 | |||||||||||||||||
| By executive for good reason | 512,553 | — | ||||||||||||||||||
| Death, disability | — | 6,433,636 | ||||||||||||||||||
| Scott Kleinman |
Without cause3
|
— | 132,016,979 | |||||||||||||||||
| Death, disability | — | 105,269,832 | ||||||||||||||||||
| James Belardi |
Without cause or by executive for good reason4
|
6,566,693 | 1,865,922 | |||||||||||||||||
Without cause or by executive for good reason in connection with a Change in Control4
|
6,566,693 | 9,515,180 | ||||||||||||||||||
Death, disability4
|
4,193,156 | 9,980,528 | ||||||||||||||||||
| John Suydam |
Without cause3
|
1,262,553 | 470,196 | |||||||||||||||||
| By executive for good reason | 1,262,553 | — | ||||||||||||||||||
| Death, disability | — | 906,711 | ||||||||||||||||||
1 This amount would have been payable to the named executive officer had his employment been terminated by the Company without cause (and other than by reason of death or disability) or for good reason on December 31, 2022.
| ||||||||||||||||||||
2 This amount represents the additional equity vesting that the named executive officer would have received had his employment terminated in the circumstances described in the column “Reason for Employment Termination,” on December 31, 2022, based on the closing price of a share of common stock ($63.79) on the last trading day of the year. For this purpose, awards that are subject to performance vesting conditions have been treated as having attained such conditions. Please see our “Outstanding Equity Awards at Fiscal Year-End” table above for information regarding the named executive officer’s unvested equity as of December 31, 2022.
| ||||||||||||||||||||
3 Solely for the December 2021 time-vesting RSU awards, also includes a termination by the executive for good reason.
| ||||||||||||||||||||
4 In addition, in redemption of his ISG partnership interest, Mr. Belardi would have been eligible to receive $116,341,805 in connection with the applicable involuntary termination on December 31, 2022.
| ||||||||||||||||||||
CEO to Median Employee Pay Ratio
SEC rules require companies to disclose the ratio of the total annual compensation of the principal executive officer (“PEO”) to the total annual compensation of the median employee (calculated excluding the PEO), and our ratio is as follows:
Mr. Rowan’s total annual compensation as PEO: $310,011
Median employee total annual compensation: $170,035
Ratio of PEO to median employee total annual compensation: 1.8:1
In determining the median employee, we prepared a list of all employees as of December 31, 2022. Consistent with applicable rules, we used reasonable estimates in the methodology used to identify the median employee. We determined the median employee by reviewing the annualized base salary for 2022, the annual cash bonus paid in 2022 by employees other than the PEO. After we determined the median employee, we calculated the median employee’s total annual compensation in the same manner in which we calculated the total annual compensation of the PEO.
Director Compensation
We do not pay additional remuneration to our employee directors and did not pay any remuneration to former Managing Partner Joshua Harris for service on our Board of Directors.
244
Each independent director receives (i) a base annual director fee of $150,000, (ii) an additional annual director fee of $100,000 for serving as our Board of Directors’ Lead Independent Director or Non-Executive Chair, (iii) an annual director fee of $25,000 for each committee of the Board of Directors for which he or she served as a member and (iv) an additional annual director fee of $25,000 (incremental to the fee described in (iii) above) for each committee of the Board of Directors on which he or she served as the Chairperson. We also agreed to provide the Lead Independent Director or Non-Executive Chair with administrative assistance and office space as reasonably necessary to perform his or her duties. Walter Joseph (Jay) Clayton III currently serves as Non-Executive Chair of the Board of Directors.
Furthermore, each independent director initially elected to our Board of Directors received a one-time grant of RSUs with a value of $600,000 ($750,000 for the Lead Independent Director or Non-Executive Chair) that vests in equal annual installments on June 30 of each of the first, second and third years following the year that the grant is made. Incumbent independent directors who had fully vested in their initial RSU award received an annual RSU award with a value of $200,000 ($250,000 for the Lead Independent Director or Non-Executive Chair) that vests on June 30 of the year following the year that the grant is made.
Additionally, from time to time the Board of Directors forms ad hoc committees, whereby members are separately compensated at a rate of $25,000 per annum for their service, with the chair of any such committee receiving an additional $25,000 per annum. Non-employee directors who serve on the audit committee of AAM or the Board of Directors and committees of AHL also receive fees for such service, as further described in the annual reports for those companies and in a note to the below table.
We adopted director stock ownership guidelines in our Corporate Governance Guidelines to ensure that our independent directors maintain a meaningful equity stake in the Company and align their interests with those of our stockholders. Our director stock ownership guidelines provide that independent directors are expected to hold at least five times the director’s base annual cash retainer amount, currently $150,000, in Company stock. For purposes of satisfying these requirements, a director’s holdings in shares of common stock include, in addition to shares held outright, any vested RSUs granted to the director as compensation for board service and any shares or vested RSUs held under a deferral or similar plan. The only unvested awards counted for purposes of satisfying the guidelines are time-based RSUs granted to our independent directors as part of their compensation for board service. Independent directors of AGM are expected to achieve the guidelines within five years of the later of (i) the date they became subject to the guidelines, (ii) the date of a material change to the guidelines, or (iii) the date of any increase in their annual cash retainer to attain this ownership threshold. Whether a director meets the guidelines is determined at the beginning of each year by multiplying his or her share ownership by the average daily closing price per share of common stock on the New York Stock Exchange for the prior year. If a director is not in compliance with the stock ownership guidelines, then he or she is expected to retain all shares of common stock until the guidelines are met.
245
The following table provides the compensation for our independent directors during the year ended December 31, 2022.
| Name |
Fees Earned or Paid in Cash ($)1
|
Stock Awards ($)2
|
All Other Compensation ($)3
|
Total ($) | ||||||||||||||||||||||
| Walter (Jay) Clayton | 338,056 | — | — | 338,056 | ||||||||||||||||||||||
| Marc Beilinson | 224,722 | 536,870 | — | 761,592 | ||||||||||||||||||||||
| Jessica Bibliowicz | 131,250 | 536,870 | — | 668,120 | ||||||||||||||||||||||
| Michael Ducey | 175,000 | 183,924 | 2,500 | 361,424 | ||||||||||||||||||||||
| Richard Emerson | 175,000 | — | — | 175,000 | ||||||||||||||||||||||
| Kerry Murphy Healey | 200,000 | — | 2,500 | 202,500 | ||||||||||||||||||||||
| Mitra Hormozi | 213,056 | 536,870 | 2,500 | 752,426 | ||||||||||||||||||||||
| Pamela Joyner | 175,000 | — | — | 175,000 | ||||||||||||||||||||||
| A.B. Krongard | 225,000 | 183,924 | 2,500 | 411,424 | ||||||||||||||||||||||
| Pauline Richards | 225,000 | 183,924 | 2,500 | 411,424 | ||||||||||||||||||||||
| David Simon | 150,000 | — | — | 150,000 | ||||||||||||||||||||||
| Lynn Swann | 175,000 | 536,870 | — | 711,870 | ||||||||||||||||||||||
1 Represent cash amounts earned in 2022 for service on the Board of Directors and its committees, including, for Mr. Clayton, the fee for serving as Non-Executive Chair. These amounts were earned in 2022 and accordingly the above figures include amounts that were paid in 2023 but earned in 2022 and exclude amounts (having the same value) that were earned in 2021 and paid in 2022.
| ||||||||||||||||||||||||||
2 Represents the aggregate grant date fair value of stock awards granted, as applicable, computed in accordance with FASB ASC Topic 718. See note 14 to our consolidated financial statements for further information concerning the assumptions made in valuing our RSU awards. The amounts shown do not reflect compensation actually received by the independent directors, but instead represent the aggregate grant date fair value of the awards. Unvested director RSUs are not entitled to dividends or dividend equivalents. As of December 31, 2022, each of our independent directors held RSUs that were unvested and outstanding.
| ||||||||||||||||||||||||||
|
3 (a) Matching charitable contributions made to a charity of the director’s choice by an affiliate of AGM.
(b) AHL, which is a public company subject to complex, multi-jurisdictional insurance industry regulation, has a robust majority independent board of directors that meets at least quarterly, has numerous active committees, and assists AHL in managing conflicts. Like other AHL non-employee directors, Mr. Beilinson, Ms. Hormozi and Mr. Swann received an annual retainer of $270,000 for their service on the AHL Board in 2022. Mr. Beilinson and Ms. Hormozi also received $21,000 in 2022 for their service on AHL standing committees. In light of his workload and broad responsibilities, Mr. Beilinson also received $36,750 in 2022 for his work as lead independent director of AHL. The AHL board of directors also forms special committees from time to time to evaluate and provide recommendations to the AHL board on potential significant transactions, including transactions involving AGM, AAM and their subsidiaries that are outside the ordinary responsibilities of the conflicts committee. Due to the extensive demands on special committee members as a result of the conflicts involved and the complexity of the underlying transactions, the AHL board of directors provides certain fixed fees to compensate special committee members for their additional service. In 2022, Mr. Beilinson served on an AHL special committee relating to the Mergers, for which he received compensation of $50,000 per month through September 2022, after which time the committee completed its work and disbanded in the fourth quarter of 2022. Mr. Beilinson also served on an AHL special litigation committee in 2022, for which he received $12,500 per month. In addition, Ms. Hormozi received $75,000 for her service on certain AHL subsidiary boards. Accordingly, aggregate fees for their service on the AHL board and its committees in 2022 were as follows: for Mr. Beilinson, $927,750; for Ms. Hormozi, $366,000; and for Mr. Swann, $270,000. The AAM board of directors does not compensate its board members except for their service on its audit committee. For their service on the AAM audit committee in 2022, Ms. Bibliowicz, Mr. Ducey, Mr. Krongard and Ms. Richards each received $25,000 (which for Ms. Bibliowicz was prorated to $18,750 to reflect that she joined the AAM audit committee on March 31, 2022), with Ms. Richards receiving an additional $25,000 for her service as chair of the AAM audit committee. The amounts described in this paragraph (b) are additional to those that appear in the above table.
| ||||||||||||||||||||||||||
ITEM 12. SECURITY OWNERSHIP OF CERTAIN BENEFICIAL OWNERS AND MANAGEMENT AND RELATED STOCKHOLDER MATTERS
The following table sets forth information regarding the beneficial ownership of our shares of Common Stock as of February 1, 2023 by (i) each person known to us to beneficially own more than 5% of the voting outstanding equity securities of AGM listed in the table below, (ii) each of our directors, (iii) persons chosen to become a director, (iv) each person who is a named executive officer for 2022 and (v) all directors and executive officers as a group.
The number of shares of Common Stock issued and outstanding and the percentages of beneficial ownership are based on 570,451,922 shares of Common Stock issued and outstanding as of February 1, 2023.
Beneficial ownership is determined in accordance with the rules of the SEC. To our knowledge, each person named in the table below has sole voting and investment power with respect to all of the shares of Common Stock shown as beneficially owned by such person, except as otherwise set forth in the notes to the table and pursuant to applicable community property laws. Unless otherwise indicated, the address of each person named in the table is c/o Apollo Global Management, Inc., 9 West 57th Street, 42nd Floor, New York, NY 10019.
246
| Common Stock Beneficially Owned | ||||||||||||||
Number1
|
Percentage |
|||||||||||||
| Directors and Executive Officers: | ||||||||||||||
| Marc Beilinson | 100,755 | * | ||||||||||||
James Belardi2
|
6,271,897 | 1.1 | % | |||||||||||
| Jessica Bibliowicz | — | — | ||||||||||||
| Walter (Jay) Clayton | 24,824 | * | ||||||||||||
Mike Ducey3
|
62,572 | * | ||||||||||||
| Richard Emerson | 3,512 | * | ||||||||||||
| Kerry Murphy Healey | 10,534 | * | ||||||||||||
Mitra Hormozi4
|
17,202 | * | ||||||||||||
| Pamela Joyner | 3,930 | * | ||||||||||||
| Martin Kelly | 184,991 | * | ||||||||||||
Scott Kleinman5
|
3,886,991 | * | ||||||||||||
A.B. Krongard6
|
433,581 | * | ||||||||||||
| Pauline Richards | 75,743 | * | ||||||||||||
Marc Rowan7
|
34,982,816 | 6.1 | % | |||||||||||
| David Simon | 3,372 | * | ||||||||||||
John Suydam8
|
221,238 | * | ||||||||||||
| Lynn Swann | 5,510 | * | ||||||||||||
Patrick Toomey9
|
— | — | ||||||||||||
James Zelter7,10
|
3,565,712 | * | ||||||||||||
All directors and executive officers as a group (nineteen persons)11
|
49,860,927 | 8.7 | % | |||||||||||
| 5% Stockholders: | ||||||||||||||
Leon Black12
|
51,735,773 | 9.1 | % | |||||||||||
Joshua Harris7,13
|
38,390,365 | 6.7 | % | |||||||||||
The Vanguard Group14
|
35,866,248 | 6.3 | % | |||||||||||
BlackRock, Inc.15
|
30,795,239 | 5.4 | % | |||||||||||
Capital World Investors16
|
30,545,388 | 5.4 | % | |||||||||||
| *Represents less than 1% | ||||||||||||||
1 The number of shares included in the table above includes the following underlying RSUs that will be delivered within 60 days of February 1, 2023: 84,324 for Mr. Belardi; 39,208 shares for Mr. Kelly; 161,649 shares for Mr. Kleinman; 17,193 shares for Mr. Suydam; and 522,319 shares for Mr. Zelter.
| ||||||||||||||
2 Includes 486,094 vested options to acquire Common Stock. The number of shares presented are directly and indirectly held by vehicles over which the named individual exercises voting and investment control. The number of shares also includes 373,219 shares held by the Belardi Family Irrevocable Trust, for which the named individual disclaims beneficial ownership.
| ||||||||||||||
3 Includes 2,616 shares held by two trusts in the aggregate for the benefit of the named individual’s grandchildren, for which the named individual and several of his immediate family members are trustees and have shared investment power. The named individual disclaims beneficial ownership of the shares held in the trusts, except to the extent of his pecuniary interest therein. Also includes 5 shares held by a trust, an entity for which the named individual and his spouse have shared voting and investment power.
| ||||||||||||||
4 Includes shares held by a third-party independently managed account that belongs to an entity controlled by the named individual’s spouse and over which the named individual’s spouse has a pecuniary interest.
| ||||||||||||||
5 The number of shares presented are directly and indirectly held by vehicles over which the named individual exercises voting and investment control. The number of shares also includes shares held by a vehicle owned by the named individual and a trust for the benefit of the named individual’s descendants and for which the named individual’s father acts as trustee; the named individual disclaims beneficial ownership of the securities held by this vehicle except to the extent of his direct or indirect pecuniary interest.
| ||||||||||||||
6 Includes 250,000 shares held by a trust for the benefit of the named individual’s children, for which the named individual’s children are the trustees. The named individual disclaims beneficial ownership with respect to such shares, except to the extent of his pecuniary interest therein. Also includes 113,043 shares held by a trust for the benefit of the named individual and for which the named individual’s children act as trustee; the named individual disclaims beneficial ownership of the securities held by this vehicle except to the extent of his pecuniary interest therein.
| ||||||||||||||
7 The number of shares presented are directly and indirectly held by vehicles over which the named individual exercises voting and investment control.
| ||||||||||||||
8 Includes 49,479 shares held by a trust for the benefit of the named individual’s spouse and children for which the named individual’s spouse is the trustee. The named individual disclaims beneficial ownership with respect to such shares, except to the extent of his pecuniary interest therein. Also includes 10,307 shares held by a vehicle in which the named individual owns 30% and 70% is owned by a trust for the benefit of the named individual’s grandchildren and for which the named individual’s spouse is trustee. The named individual disclaims beneficial ownership of the 70% owned by the trust.
| ||||||||||||||
9 On February 21, 2022, Senator Patrick Toomey was appointed to the AGM board of directors, effective March 15, 2023.
| ||||||||||||||
10 Includes 113,276 shares which were gifted to JVZ Foundation, an entity over which the named individual exercises voting and investment control but over which he retains no pecuniary interest.
| ||||||||||||||
11 The number of directors and executive officers as a group includes directors, director appointees, and current executive officers.
| ||||||||||||||
247
12 Based on a Form 5 filed with the SEC on January 27, 2023 by Mr. Black. The address of Mr. Black is c/o Elysium Management LLC, 445 Park Avenue, Suite 1401, New York, NY 10022. As disclosed on Amendment No. 2 to the Schedule 13D filed with the SEC on August 16, 2022 by Mr. Black, the number of shares presented includes a total of 24,115,000 shares held by the named individual in one or more margin accounts subject to a standard margin loan arrangement.
| ||||||||||||||
13 Based on the Schedule 13D filed with the SEC on January 11, 2022 by Mr. Harris. The address of Mr. Harris is HRS Management LLC, 600 Madison Avenue, New York, NY 10022.
| ||||||||||||||
14 Based on information set forth in the Schedule 13G that The Vanguard Group filed with the SEC on February 9, 2023. The Vanguard Group reported that, as of December 30, 2022, it had shared voting power over 345,626 shares, sole dispositive power over 34,812,123 shares, shared dispositive power over 1,054,125 shares and no sole voting power. The address of The Vanguard Group is 100 Vanguard Blvd., Malvern, PA 19355.
| ||||||||||||||
15 Based on information set forth in the Schedule 13G that BlackRock, Inc. filed with the SEC on February 3, 2023. BlackRock reported that, as of December 31, 2022, it and its subsidiaries listed on Exhibit A of the Schedule 13G had sole voting power over 28,303,419 shares, sole dispositive power over 30,795,239 shares and no shared voting and dispositive powers. The address of BlackRock, Inc. is 55 East 52nd Street, New York, NY 10055.
| ||||||||||||||
16 Based on information set forth in the Schedule 13G that Capital World Investors filed with the SEC on February 13, 2023. Capital World Investors reported that, as of December 30, 2022, it had sole voting power over 30,545,374 shares, sole dispositive power over 30,545,388 shares and no shared voting and dispositive powers. Capital World Investors also indicated it disclaims beneficial ownership over 30,545,388 shares pursuant to Rule 13d-4. The address of Capital World Investors is 333 South Hope Street, 55th floor, Los Angeles, California 90071.
| ||||||||||||||
Securities Authorized for Issuance under the Equity Plan
The following table sets forth information concerning the awards that could be issued under the Equity Plan as of December 31, 2022.
| Plan Category |
Number of Securities to be Issued Upon Exercise of Outstanding Options, Warrants and Rights1
|
Weighted-Average Exercise Price of Outstanding Options, Warrants and Rights |
Number of Securities Remaining Available for Future Issuance Under Equity Compensation Plans (excluding securities reflected in column (a))2
|
|||||||||||||||||
| (a) | (b) | (c) | ||||||||||||||||||
| Equity Compensation Plans Approved by Security Holders | 27,712,793 | $ | — | 36,576,125 | ||||||||||||||||
| Equity Compensation Plans Not Approved by Security Holders | — | — | — | |||||||||||||||||
| Total | 27,712,793 | $ | — | 36,576,125 | ||||||||||||||||
1 Reflects the aggregate number of outstanding RSUs granted under the Equity Plan as of December 31, 2022. Excludes RSUs and options assumed by AGM in the Mergers under the AHL 2014, 2016 and 2019 Share Incentive Plans. As of December 31, 2022, a total of 755,159 RSUs and options covering 2,403,536 shares remained outstanding under those assumed arrangements. The weighted average exercise price of those outstanding options is $39.04 per share.
| ||||||||||||||||||||
2 The shares of common stock reserved under the AGM 2019 Omnibus Equity Incentive Plan are increased on the first day of each fiscal year by (i) the amount (if any) by which (a) 15% of the number of outstanding shares of common stock or securities exchangeable for shares of common stock on a fully converted and diluted basis on the last day of the immediately preceding fiscal year exceeds (b) the number of shares then reserved and available for issuance under such plan or the AGM 2019 Omnibus Equity Incentive Plan for Estate Planning Vehicles, or (ii) such lesser amount by which the administrator may decide to increase the number of shares of common stock as of such date. The number of shares reserved under such plans is also subject to adjustment in the event of a share split, share dividend, or other change in our capitalization. Generally, employee shares that are forfeited, canceled, surrendered or exchanged from awards under such plans will be available for future awards.
| ||||||||||||||||||||
ITEM 13. CERTAIN RELATIONSHIPS AND RELATED TRANSACTIONS, AND DIRECTOR INDEPENDENCE
The following is a description of certain relationships and transactions since January 1, 2022, for which the amount involved exceeds $120,000 and our directors, executive officers, or shareholders that are known to us to beneficially own more than five percent of our common stock have a direct or indirect material interest as well as certain other transactions.
Stockholders Agreement
On January 1, 2022, we entered into the Stockholders Agreement with the Former Managing Partners and certain affiliates of the Former Managing Partners.
The Stockholders Agreement provides, among other things:
•AGM will nominate each Former Managing Partner (or his designee, as applicable) as part of the director slate of the board of directors, for so long as such Former Managing Partner, together with the members of his family group, beneficially owns at least $400 million in value or 10 million in number of shares of Common Stock (the “Ownership Threshold”);
248
•each Former Managing Partner (or his designee, as applicable), will, if requested by the board of directors, resign from the board of directors in the event that such Former Managing Partner no longer meets the Ownership Threshold;
•each Former Managing Partner, together with the members of his family group, agrees to vote all of his or their respective shares of Common Stock in favor of the election of the other Former Managing Partners (or their designees, as applicable);
•AGM will recommend that its stockholders vote in favor of the Former Managing Partners (or their designees, as applicable) and AGM will otherwise take reasonable action to support their nomination and election (including by filling vacancies on the board of directors, if necessary);
•each Former Managing Partner (but not his designee) will be entitled to a seat on the Executive Committee so long as such Former Managing Partner serves on the board of directors;
•AGM will not make any non-pro rata distributions or payments to any Former Managing Partners without the consent of the other Former Managing Partners;
•each Former Managing Partner and AGM agree not to take actions inconsistent with the terms of the Stockholders Agreement or in a manner that is discriminatory as to one or more of the Former Managing Partners, and will agree to oppose any such actions if proposed by others;
•each Former Managing Partner will have customary information rights regarding AGM’s business, so long as such Former Managing Partner, together with the members of his family group, meets an ownership threshold equal to 50% of the Ownership Threshold; and
•each Former Managing Partner will be entitled to the use of office space at AGM’s offices and administrative and logistics support provided by AGM; provided, that such Former Managing Partner continues to (a) provide services to AGM (other than as a member of the board of directors), (b) serve on the Executive Committee or (c) serve as the chairman of the board of directors or of any committee of the board of directors.
The Stockholders Agreement also grants to each Former Managing Partner (and his permitted transferees) the right, under certain circumstances and subject to certain restrictions, to require AGM to register under the Securities Act of 1933, as amended (the “Securities Act”), shares of Common Stock held or acquired by them. Under the Stockholders Agreement, each Former Managing Partner (and his permitted transferees) (i) has “demand” registration rights that require AGM to register under the Securities Act the shares of Common Stock that he (and his permitted transferees) holds or acquires, (ii) may require AGM to make available registration statements permitting sales of shares of Common Stock he holds or acquires in the market from time to time over an extended period and (iii) has the ability to exercise certain piggyback registration rights in connection with registered offerings requested by other registration rights holders or initiated by AGM. AGM has agreed to indemnify each Former Managing Partner (and his permitted transferees, together with certain related parties) against any losses or damages resulting from any untrue statement or omission of material fact in any registration statement or prospectus pursuant to which such holder sells shares of Common Stock, unless such liability arose from the holder’s misstatement or omission, and each Former Managing Partner (and his permitted transferees) has agreed to indemnify AGM against all losses caused by his (or their) misstatements or omissions.
Registration Rights Agreement
On January 1, 2022, AGM entered into a Registration Rights Agreement with Mr. James Zelter and Mr. Scott Kleinman (the “Registration Rights Agreement”). Pursuant to the Registration Rights Agreement, AGM has granted Messrs. Zelter and Kleinman and their permitted transferees the right, under certain circumstances and subject to certain restrictions, to require AGM to register under the Securities Act, shares of Common Stock held or acquired by them. Under the Registration Rights Agreement, the registration rights holders (i) have “demand” registration rights that require AGM to register under the Securities Act the shares of Common Stock that they hold or acquire, (ii) may require AGM to make available registration statements permitting sales of shares of Common Stock they hold or acquire in the market from time to time over an extended period and (iii) have the ability to exercise certain piggyback registration rights in connection with registered offerings requested by other registration rights holders or initiated by AGM. AGM has agreed to indemnify each registration rights holder and certain related parties against any losses or damages resulting from any untrue statement or omission of material fact in any registration statement or prospectus pursuant to which such holder sells shares of Common Stock, unless such liability arose from the holder’s misstatement or omission, and each registration rights holder has agreed to indemnify AGM against all losses caused by his misstatements or omissions.
Exchange Implementation Agreement
On December 31, 2021, in connection with the restructuring of AAM that occurred prior to the closing of the Mergers (the “AAM restructuring”), AGM and certain other persons entered into an Exchange Implementation Agreement (the “Exchange
249
Implementation Agreement”) with certain holders of Apollo Operating Group (as defined in the amended and restated certificate of incorporation of AGM) units (“AOG Units”). Pursuant to the Exchange Implementation Agreement, such holders of AOG Units exchanged a portion of such AOG Units for shares of Common Stock concurrently with the consummation of the Mergers. Additionally, under the Exchange Implementation Agreement, on December 31, 2021, the remainder of the AOG Units held by such holders were sold and transferred to APO Corp., a wholly-owned subsidiary of AAM, in exchange for an amount equal to $3.66 multiplied by the total number of AOG Units held by such holders as of immediately prior to the AAM restructuring. Such amount is payable over a period of three years in equal quarterly installments.
Roll-Up Agreements
Pursuant to the Roll-Up Agreements dated as of July 13, 2007, certain of AGM’s current and former employees (the “Contributing Partners”), including Messrs. Kleinman and Zelter received interests in AP Professional Holdings, L.P. (“Holdings”), which we refer to as AOG Units, in exchange for their contribution of assets to the limited partnerships and limited liability companies through which AAM operates its businesses. In connection with the closing of the Mergers, the Roll-Up Agreements were amended to remove all covenants and agreements contained therein other than provisions relating to certain previously consummated roll-up transactions and the litigation cooperation covenant and to add certain matters relating to AAM’s tax receivable agreement.
Amended and Restated Tax Receivable Agreement
Prior to the consummation of the AAM corporate reorganization on January 1, 2022, and subject to certain restrictions, each of the Former Managing Partners and Contributing Partners had the right to exchange the AOG Units that they held through their partnership interests in Holdings (together with the corresponding interest in AAM’s former share of Class B common stock) for AAM’s Class A shares in a taxable exchange. Each of the Apollo Operating Group entities having made an election under Section 754 of the Internal Revenue Code, any such taxable exchanges, as well as acquisitions of units from the Former Managing Partners or Contributing Partners, resulted in an adjustment to the tax basis of a portion of the assets owned by the Apollo Operating Group at the time of the exchange. These taxable exchanges resulted in increases in the tax depreciation and amortization deductions from depreciable and amortizable assets, as well as an increase in the tax basis of other assets, of the Apollo Operating Group that otherwise would not have been available. A portion of these increases in tax depreciation and amortization deductions, as well as the increase in the tax basis of such other assets, will reduce the amount of tax that AAM would otherwise be required to pay in the future.
AAM entered into a tax receivable agreement with the Former Managing Partners and Contributing Partners that provides for the payment by AMM to the Former Managing Partners or Contributing Partners of 85% of the amount of actual cash savings, if any, in U.S. Federal, state, local and foreign income tax that we realize (or are deemed to realize in the case of an early termination payment by us or a change of control) as a result of these increases in tax deductions and tax basis, and certain other tax benefits, including imputed interest expense, related to payments pursuant to the tax receivable agreement. AAM expects to benefit from the remaining 15% of actual cash savings, if any, in income tax that is realized. For purposes of the tax receivable agreement, cash savings in income tax will be computed by comparing AAM’s actual income tax liability to the amount of such taxes that it would have been required to pay had there been no increase to the tax basis of the tangible and intangible assets of the applicable Apollo Operating Group entity as a result of the transaction and had AAM not entered into the tax receivable agreement. The tax savings achieved may not ensure that AAM has sufficient cash available to pay its tax liability or generate additional distributions to stockholders. Also, we may need to incur additional debt to repay the tax receivable agreement if our cash flow needs are not met. The term of the tax receivable agreement will continue until all such tax benefits have been utilized or expired, unless AAM exercises the right to terminate the tax receivable agreement by paying an amount based on the present value of payments remaining to be made under the agreement with respect to units that have been exchanged or sold. In May 2022, AAM irrevocably waived its early termination right in the tax receivable agreement.
The Internal Revenue Service (the “IRS”) could challenge AAM’s claim to any increase in the tax basis of the assets owned by the Apollo Operating Group that resulted from the exchanges entered into by the Former Managing Partners or Contributing Partners. The IRS could also challenge any additional tax depreciation and amortization deductions or other tax benefits (including deductions for imputed interest expense associated with payments made under the tax receivable agreement) that AAM claimed as a result of, or in connection with, such increases in the tax basis of such assets. If the IRS were to successfully challenge a tax basis increase or tax benefits AAM previously claimed from a tax basis increase, the Former Managing Partners and Contributing Partners would not be obligated under the tax receivable agreement to reimburse AAM for any payments previously made to them (although any future payments would be adjusted to reflect the result of such challenge). As a result, in certain circumstances, payments could be made to the Former Managing Partners and Contributing Partners under the tax
250
receivable agreement in excess of 85% of AAM’s actual aggregate cash tax savings. In general, estimating the amount of payments that may be made to the Former Managing Partners and Contributing Partners under the tax receivable agreement is by its nature, imprecise, in the absence of an actual transaction, insofar as the calculation of amounts payable depends on a variety of factors. The actual increase in tax basis and the amount and timing of any payments under the tax receivable agreement will vary depending upon a number of factors, including, but not limited to, the timing and amount of our future income.
For the year ended December 31, 2022, AAM made payments totaling $46,448,460 to the Former Managing Partners and Contributing Partners who are executive officers (or to their estate planning vehicles) pursuant to the tax receivable agreement, related to tax benefits treated as realized thereunder by APO Corp. in 2021. Those payments included the following amounts: $12,742,800 for Mr. Black, $16,696,876 for Mr. Harris, $16,484,054 for Mr. Rowan, $348,903 for Mr. Kleinman, and $175,827 for Mr. Zelter.
Employment Arrangements
Please see the section entitled “Executive Compensation—Employment Agreements” and “—Potential Payments upon Termination or Change in Control” for a description of the employment agreements of our named executive officers who have employment agreements.
In addition, Joshua Black, a son of Leon Black, is currently employed as a Partner in AAM’s financial institutions group. He is entitled to receive a base salary, incentive compensation and employee benefits comparable to those offered to similarly situated employees of AAM. He is also eligible to receive an annual performance-based bonus in an amount determined by AAM in its discretion.
Firm Use of Private Aircraft
In the normal course of business, our personnel made use of aircraft owned as personal assets by entities controlled by Messrs. Rowan and Harris. Messrs. Rowan and Harris paid for their respective purchases of the aircraft and bear all operating, personnel and maintenance costs associated with their operation for personal use. Payments by us for the business use of these aircraft by Messrs. Rowan and Harris and other of our personnel are determined based on a specified hourly rate. In 2022, AAM made payments of $4,555,936 and $94,631 for the use of such aircraft owned by entities controlled by Messrs. Rowan and Harris, respectively.
Apollo Management Holdings, L.P. (“AMH”), a subsidiary of AGM, leases an aircraft from time to time for business use from Bank of Utah, not in its individual capacity but solely as owner trustee (“BOU”), of an aircraft beneficially owned by MarCar 5000 LLC (“MarCar”), a company beneficially owned by Marc Rowan. For its flights under the lease, AMH pays rent to BOU and pays the costs to hire flight crew and operate the aircraft. The agreements were approved by the Conflicts Committee of the AAM Board based on Apollo’s interest in ensuring the safety and security of Mr. Rowan for his business flights for Apollo. AMH also receives a waiver of liability claims from Mr. Rowan, MarCar and BOU. In 2022, AMH paid rent of $1,224,276 under the lease and paid additional costs of $777,030 for flight crew, fuel and operational expenses for its business use of the aircraft.
Investments in Apollo Funds
Our directors and executive officers are generally permitted to invest their own capital (or capital of estate planning vehicles controlled by them or their immediate family members) directly in the funds we manage and affiliated entities. In general, such investments are not subject to management fees, and in certain instances, may not be subject to performance fees. In addition, from time to time, our directors and executive officers are offered an opportunity to invest their own capital in vehicles managed by third-party sponsors with which we or AGM have a strategic relationship (such investments with third-party sponsors, “Third-Party Sponsored Fund Investments”). Such investment opportunities may not be subject to management fees and/or performance fees. The opportunity to invest in the funds we manage and such third-party sponsored vehicles in this manner is available to our directors, executive officers and those of our employees whom we have determined to have a status that reasonably permits us to offer them these types of investments in compliance with applicable laws. As of December 31, 2022, our professionals have committed or invested approximately $2.2 billion of their own capital to such funds.
The amount invested in our investment funds and in Third-Party Sponsored Fund Investments by our directors, executive officers and Messrs. Black and Harris (and their immediate family members or estate planning vehicles controlled by them or
251
their immediate family members) during 2022 was $1,668,940, $5,903,163, $365,040, $305,936, $17,273,252, $1,244,077, $5,729,022, $23,198,718, $2,397,653, $8,546,645, $2,184,986, $1,390,530 and $138,416 for Messrs. Beilinson, Belardi, Black, Ducey, Harris, Kelly, Kleinman, Rowan, Simon, Suydam, and Zelter and Messes. Hormozi and Richards, respectively. The amount of distributions on their fund investments, including profits and return of capital to our directors and executive officers (and, in some cases, their immediate family members or certain estate planning vehicles controlled by them or their immediate family members) during 2022 was $850, $2,916,226, $3,070,580, $310,684, $14,276,660, $680,602, $9,768,077, $6,142,084, $1,700, $3,305,576, $2,790,446 and $66,448 for Messrs. Beilinson, Belardi, Black, Ducey, Harris, Kelly, Kleinman, Rowan, Simon, Suydam, and Zelter, and Ms. Richards, respectively.
Sub-Advisory Arrangements and Strategic Investment Accounts
From time to time, we have entered into sub-advisory arrangements with, or established strategic investment accounts for, certain of our directors and executive officers or vehicles they manage. Such arrangements have been approved in advance in accordance with our policy regarding transactions with related persons. In addition, such sub-advisory arrangements or strategic investment accounts have been entered into with, or advised by, an Apollo entity serving as investment advisor registered under the Investment Advisers Act of 1940, as amended, and any fee arrangements, if applicable, have been on an arms-length basis. The amount of such fees paid by our directors and executive officers or vehicles they manage to us during 2022 was $461,064 for Mr. Harris and $42,626 for Mr. Rowan.
Indemnification of Directors, Officers and Others
Under our certificate of incorporation, in most circumstances we will be obligated to indemnify the following persons, to the fullest extent permitted by applicable law, from and against all losses, claims, damages, liabilities, joint or several, expenses (including legal fees and expenses), judgments, fines, penalties, interest, settlements or other amounts: AAM’s Former Manager; any Affiliate of AAM’s Former Manager; any member, partner, Tax Matters Partner, Partnership Representative, officer, director, employee, agent, fiduciary or trustee of any Corporate Group Member (each as defined in our certificate of incorporation), AAM’s Former Manager or any of its respective Affiliates; any Person who was serving at the request of AAM’s Former Manager or any of its respective Affiliates as an officer, director, employee, member, partner, Tax Matters Partner, Partnership Representative, agent, fiduciary or trustee of another Person; provided, that a Person shall not be included by reason of providing, on a fee-for-services basis, trustee, fiduciary or custodial services; and any person that our board of directors in its sole discretion designates as an “Indemnified Person” as permitted by applicable law.
We have agreed to provide this indemnification unless there has been a final and non-appealable judgment by a court of competent jurisdiction determining that these persons acted in bad faith or engaged in fraud or willful misconduct. We have also agreed to provide this indemnification for criminal proceedings. Any indemnification under these provisions will only be out of our assets. We may purchase insurance against liabilities asserted against and expenses incurred by persons for our activities, regardless of whether we would have the power to indemnify the person against liabilities under our certificate of incorporation.
We have entered into indemnification agreements with each of our directors, executive officers and certain of our employees which set forth the obligations described above.
We have also agreed to indemnify each of the Former Managing Partners and certain Contributing Partners, including Messrs. Kleinman and Zelter, against certain amounts that they are required to pay in connection with a general partner obligation for the return of previously made performance fee distributions in respect of Apollo Investment Fund IV, L.P. and its parallel fund, Apollo Investment Fund V, L.P. and its parallel funds and alternative investment vehicles, and Apollo Investment Fund VI, L.P. and its parallel funds and alternative investment vehicles.
We also currently maintain liability insurance for our directors and officers.
Statement of Policy Regarding Transactions with Related Persons
We have adopted a written Related Person Transactions Policy (the “policy”), which sets forth our policy with respect to the review, approval, ratification and disclosure of all material related person transactions by the Audit Committee. In accordance with the policy, the Audit Committee has overall responsibility for implementation of and compliance with the policy.
252
For purposes of the policy, a “related person transaction” is a transaction, arrangement or relationship (or any series of similar transactions, arrangements or relationships) in which we were, are or will be a participant and the amount involved exceeded, exceeds or will exceed $120,000 and in which any related person (as defined in the policy) had, has or will have a direct or indirect material interest.
The policy requires that notice of a proposed related person transaction be provided to AGM’s Chief Legal Officer prior to entry into such transaction. If the Chief Legal Officer determines that such transaction is a related person transaction and does not fall within certain categories of pre-approved transactions listed in our policy, the proposed transaction will be submitted to our Audit Committee for consideration or in certain instances, to the Audit Committee Chairperson. Under the policy, our Audit Committee or the Audit Committee Chairperson may approve only those related person transactions that are in, or not inconsistent with, AGM’s best interests. In the event that we become aware of a related person transaction that has not been previously reviewed, approved or ratified under the policy and that is ongoing or is completed, the transaction will be submitted to the Audit Committee so that it may determine whether to ratify, rescind or terminate the related person transaction (provided that a interested director is required to be recused from such determination). The policy provides that no member of the Audit Committee shall participate in any review, consideration, or approval of any related person transaction with respect to which such member or any of his or her immediate family members is the related person.
The policy also provides that the Audit Committee monitor certain previously approved or ratified related person transactions that are ongoing to assess whether amending or terminating the related person transaction would be in our best interests and the best interests of our stockholders. Additionally, we make periodic inquiries of directors and executive officers with respect to any potential related person transaction of which they may be a party or of which they may be aware.
Independence and Composition of Our Board of Directors
Our board of directors currently consists of 16 directors. Our Nominating and Corporate Governance Committee recommended, and our board of directors determined that twelve of our directors, Messrs. Beilinson, Clayton, Ducey, Emerson, Krongard, Simon and Swann, Mses. Bibliowicz, Hormozi, Joyner and Richards, and Dr. Healey, are independent under the NYSE rules relating to corporate governance matters and the independence standards described in our Corporate Governance Guidelines. All committee members on the Audit Committee, Compensation Committee, Nominating and Corporate Governance, and Sustainability and Corporate Responsibility Committee are independent. Under our Corporate Governance Guidelines, directors are expected to satisfy the following criteria: (i) dedicate sufficient time, energy and attention to ensure the diligent performance of their duties; (ii) comply with the duties and responsibilities set forth herein and in the bylaws of AGM; (iii) comply with all duties of care, loyalty and confidentiality applicable to directors of publicly traded corporations organized in our jurisdiction of incorporation; and (iv) adhere to AGM’s Code of Business Conduct and Ethics, including, but not limited to, the policies on conflicts of interest expressed therein and any other Company policies that apply to directors.
The board of directors includes five members who identify as women, two of whom identify as African American or Black and one of whom identifies as Asian Mideast/Persian. The board of directors also includes a member who identifies as African American or Black and Alaskan Native or American Indian. The board of directors also includes a member who is a veteran. Two of our directors who identify as women serve in board leadership roles: Pauline Richards serves as Chair of the Audit Committee and Dr. Kerry Murphy Healey serves as Chair of the Sustainability and Corporate Responsibility Committee. Our director who is a veteran, A.B. Krongard, serves as Chair of the Nominating and Corporate Governance Committee.
253
ITEM 14. PRINCIPAL ACCOUNTANT FEES AND SERVICES
The following table summarizes the aggregate fees for professional services provided by Deloitte & Touche LLP, the member firms of Deloitte Touche Tohmatsu, and their respective affiliates (collectively, the "Deloitte Entities").
For the Year Ended December 31, 2022 |
|||||||||||||||||
| (in millions) | AGM |
AGM Funds1
|
Total | ||||||||||||||
Audit fees2
|
$ | 28 | $ | 34 | $ | 62 | |||||||||||
Audit-related fees3
|
1 | 1 | 2 | ||||||||||||||
| Tax fees | |||||||||||||||||
| Tax compliance fees | 8 | 42 | 50 | ||||||||||||||
| Tax advisory fees | 3 | 4 | 7 | ||||||||||||||
| Total tax fees | 11 | 46 | 57 | ||||||||||||||
| Total fees | $ | 40 | $ | 81 | $ | 121 | |||||||||||
For the Year Ended December 31, 2021 |
|||||||||||||||||
| (in millions) | AGM |
AGM Funds1
|
Total | ||||||||||||||
Audit fees2
|
$ | 7 | 24 | $ | 31 | ||||||||||||
Audit-related fees3
|
2 | 1 | 3 | ||||||||||||||
| Tax fees | |||||||||||||||||
| Tax compliance fees | 7 | 34 | 41 | ||||||||||||||
| Tax advisory fees | 4 | 2 | 6 | ||||||||||||||
| Total tax fees | 11 | 36 | 47 | ||||||||||||||
| Total fees | $ | 20 | $ | 61 | $ | 81 | |||||||||||
1 Audit and Tax fees for Apollo fund entities consisted of services to investment funds managed by Apollo in its capacity as the general partner and/or manager of such entities.
| |||||||||||||||||
2 Audit fees consisted of fees for (a) the audits of our consolidated financial statements in our Annual Report on Form 10-K and services attendant to, or required by, statute or regulation; (b) reviews of the interim condensed consolidated financial statements included in our quarterly reports on Form 10-Q.
| |||||||||||||||||
3 Audit-related fees consisted of comfort letters, consents and other services related to SEC and other regulatory filings.
| |||||||||||||||||
Our audit committee charter requires the audit committee of our board of directors to approve in advance all audit and non-audit related services to be provided by our independent registered public accounting firm. All services reported in the Audit, Audit-related and Tax categories above were approved by the committee.
254
PART IV
ITEM 15. EXHIBITS, FINANCIAL STATEMENT SCHEDULES
The following documents are filed as part of this report:
| 1. | ||||||||
| 2. | Financial Statement Schedules | |||||||
| Any remaining schedules are omitted because they are inapplicable. | ||||||||
| 3. | ||||||||
255
APOLLO GLOBAL MANAGEMENT, INC.
Schedule I—Condensed Financial Information of Registrant (Parent Company Only) - Balance Sheets
| (In millions, except share data) | As of December 31, 2022 |
As of December 31, 2021 |
|||||||||
| Assets | |||||||||||
| Investments | $ | $ | |||||||||
| Due from subsidiaries | |||||||||||
| Goodwill | |||||||||||
| Other assets | |||||||||||
| Total Assets | $ |
|
$ |
|
|||||||
| Liabilities and Equity | |||||||||||
| Liabilities | |||||||||||
| Accounts payable, accrued expenses, and other liabilities | $ | $ | |||||||||
| Due to subsidiaries | |||||||||||
| Total Liabilities | $ |
|
$ |
|
|||||||
| Equity | |||||||||||
Series A Preferred Stock, 0 and 11,000,000 shares issued and outstanding as of December 31, 2022 and December 31, 2021, respectively |
|||||||||||
Series B Preferred Stock, 0 and 12,000,000 shares issued and outstanding as of December 31, 2022 and December 31, 2021, respectively |
|||||||||||
Class A Common Stock, $0.00001 par value, 0 and 90,000,000,000 shares authorized, 0 and 248,896,649 shares issued and outstanding as of December 31, 2022 and December 31, 2021, respectively |
|||||||||||
Class B Common Stock, $0.00001 par value, 0 and 999,999,999 shares authorized, 0 shares issued and outstanding as of December 31, 2022 and December 31, 2021, respectively |
|||||||||||
Class C Common Stock, $0.00001 par value, 0 and 1 share authorized, 0 shares issued and outstanding as of December 31, 2022 and December 31, 2021, respectively |
|||||||||||
Common Stock, $0.00001 par value, 90,000,000,000 shares authorized, 570,276,188 shares issued and outstanding as of December 31, 2022 |
|||||||||||
| Additional paid in capital | |||||||||||
| Retained earnings (accumulated deficit) | ( |
||||||||||
| Accumulated other comprehensive income (loss) | ( |
( |
|||||||||
| Total Equity |
|
|
|||||||||
| Total Liabilities and Equity | $ |
|
$ |
|
|||||||
| See accompanying notes to condensed financial information of registrant (parent company only) | |||||||||||
256
APOLLO GLOBAL MANAGEMENT, INC.
Schedule I—Condensed Financial Information of Registrant (Parent Company Only) - Income Statements
| Years ended December 31, | |||||||||||||||||
| (In millions) | 2022 | 2021 | 2020 | ||||||||||||||
| Revenues | |||||||||||||||||
| Investment income (loss) | $ | ( |
$ | $ | |||||||||||||
| Total Revenues | ( |
||||||||||||||||
| Expenses | |||||||||||||||||
| Interest expense | |||||||||||||||||
| General, administrative and other | |||||||||||||||||
| Total Expenses | |||||||||||||||||
| Other income (loss) | |||||||||||||||||
| Other income (loss), net | |||||||||||||||||
| Total Other income (loss) | |||||||||||||||||
| Income (loss) before income tax (provision) benefit | ( |
||||||||||||||||
| Income tax (provision) benefit | ( |
||||||||||||||||
| Net income (loss) attributable to Apollo Global Management, Inc. | ( |
||||||||||||||||
| Preferred stock dividends | ( |
( |
|||||||||||||||
| Net income (loss) attributable to Apollo Global Management, Inc. common stockholders | $ | ( |
$ | $ | |||||||||||||
| See accompanying notes to condensed financial information of registrant (parent company only) | |||||||||||||||||
257
APOLLO GLOBAL MANAGEMENT, INC.
Schedule I—Condensed Financial Information of Registrant (Parent Company Only) - Cash Flows
| Years ended December 31, | |||||||||||||||||
| (In millions) | 2022 | 2021 | 2020 | ||||||||||||||
| Cash Flows from Operating Activities | |||||||||||||||||
| Net cash provided by (used in) operating activities | $ | $ | ( |
$ | ( |
||||||||||||
| Cash Flows from Investing Activities | |||||||||||||||||
| Distributions from subsidiaries | $ | $ | $ | ||||||||||||||
| Due from subsidiaries, net | ( |
||||||||||||||||
| Net cash provided by investing activities | $ | $ | $ | ||||||||||||||
| Cash Flows from Financing Activities | |||||||||||||||||
| Preferred stock dividends | $ | $ | ( |
$ | ( |
||||||||||||
| Dividends | ( |
( |
( |
||||||||||||||
| Repurchase of common stock | ( |
( |
( |
||||||||||||||
| Due to subsidiaries, net | |||||||||||||||||
| Net cash used in financing activities | $ | ( |
$ | ( |
$ | ( |
|||||||||||
| Net Increase (Decrease) in Cash and Cash Equivalents | |||||||||||||||||
| Cash and Cash Equivalents, Beginning of Period | |||||||||||||||||
| Cash and Cash Equivalents, End of Period | $ | $ | $ | ||||||||||||||
| Supplemental Disclosure of Cash Flow Information | |||||||||||||||||
| Income taxes paid | $ | $ | $ | ||||||||||||||
| See accompanying notes to condensed financial information of registrant (parent company only) | |||||||||||||||||
258
APOLLO GLOBAL MANAGEMENT, INC.
Schedule I—Condensed Financial Information of Registrant (Parent Company Only) - Notes
1. Basis of Presentation
The accompanying condensed financial statements of Apollo Global Management Inc. (“AGM”) should be read in conjunction with the consolidated financial statements and notes of AGM and its subsidiaries (“consolidated financial statements”).
For purposes of these condensed financial statements, AGM’s wholly owned and majority owned subsidiaries are presented under the equity method of accounting. Under this method, the assets and liabilities of subsidiaries are not consolidated. The investments in subsidiaries are recorded on the condensed balance sheets. The income from subsidiaries is reported on a net basis as equity earnings of subsidiaries on the condensed statements of income.
In this report, references to “AGM” and the “Company” for periods (i) on or before December 31, 2021 refer to Apollo Asset Management, Inc. (f/k/a Apollo Global Management, Inc.) (“AAM”) and (ii) subsequent to December 31, 2021, refer to Apollo Global Management, Inc. (f/k/a Tango Holdings, Inc.). Subsequent to December 31, 2021, AAM is a consolidated subsidiary of AGM.
2. Intercompany Transactions
Unsecured Revolving Notes Receivable – AGM has unsecured revolving notes receivable from its subsidiaries Apollo Asset Management (“AAM”) and Athene Holding Ltd. (“AHL”). The note from AAM accrues interest at a fixed rate of 0.33 % per annum, and the balance is due at AGM’s request. The note had an outstanding net receivable balance of $579 million as of December 31, 2022. The note had an outstanding net payable balance of $12 million as of December 31, 2021. The note from AHL has a borrowing capacity of $500 million. Interest accrues at a rate per annum, equal to the U.S. mid-term applicable federal rate, and the balance is due on December 13, 2025, or earlier at AGM’s request. There was no outstanding balance on the notes receivable as of December 31, 2022.
Unsecured Revolving Note Payable – In addition to the unsecured revolving notes receivable described above, AGM has an unsecured revolving note payable to its subsidiary AHL. The note to AHL has a borrowing capacity of $500 million. Interest accrues at a rate per annum, equal to the U.S. mid-term applicable federal rate, and the balance is due on December 13, 2025, or earlier at AHL’s request. The note had an outstanding balance of $78 million as of December 31, 2022.
3. Dividends
During the years ended December 31, 2022, 2021 and 2020, AGM received $1,897 million, $500 million and $466 million, respectively, of dividends from its subsidiaries. See note 19 – Statutory Requirements to the consolidated financial statements for additional information on subsidiary dividend restrictions.
259
| (In millions) | Additions | ||||||||||||||||||||||||||||
| Description | Balance at beginning of year | Charged to costs and expenses | Assumed through acquisitions | Deductions | Balance at end of year | ||||||||||||||||||||||||
| Reserves deducted from assets to which they apply | |||||||||||||||||||||||||||||
| Year ended December 31, 2022 | |||||||||||||||||||||||||||||
| Valuation allowance on deferred tax assets | ( |
||||||||||||||||||||||||||||
260
| Exhibit Number |
Exhibit Description | |||||||
| 2.1 | ||||||||
| 3.1 | ||||||||
| 3.2 | ||||||||
| 3.3 | ||||||||
| *4.1 | ||||||||
| +10.1 | ||||||||
| +10.2 | ||||||||
| +10.3 | ||||||||
| +10.4 | ||||||||
| +10.5 | ||||||||
| +10.6 | ||||||||
| +10.7 | ||||||||
| +10.8 | ||||||||
261
| +10.9 | ||||||||
| +10.10 | ||||||||
| +10.11 | ||||||||
| +10.12 | ||||||||
| +10.13 | ||||||||
| +10.14 | ||||||||
| +10.15 | ||||||||
| +10.16 | ||||||||
| +10.17 | ||||||||
| +10.18 | ||||||||
| +10.19 | ||||||||
| *+10.20 | ||||||||
262
| *+10.21 | ||||||||
| +10.22 | ||||||||
| +10.23 | ||||||||
| +10.24 | ||||||||
| +10.25 | ||||||||
| +10.26 | ||||||||
| +10.27 | ||||||||
| +10.28 | ||||||||
| +10.29 | ||||||||
| +10.30 | ||||||||
| +10.31 | ||||||||
| +10.32 | ||||||||
| +10.33 | ||||||||
| +10.34 | ||||||||
263
| +10.35 | ||||||||
| +10.36 | ||||||||
| +10.37 | ||||||||
| +10.38 | ||||||||
| +10.39 | ||||||||
| +10.40 | ||||||||
| +10.41 | ||||||||
| +10.42 | ||||||||
| +10.43 | ||||||||
| +10.44 | ||||||||
| +10.45 | ||||||||
| +10.46 | ||||||||
264
| +10.47 | ||||||||
| +10.48 | ||||||||
| +10.49 | ||||||||
| +10.50 | ||||||||
| +10.51 | ||||||||
| +10.52 | ||||||||
| +10.53 | ||||||||
| +10.54 | ||||||||
| +10.55 | ||||||||
| +10.56 | ||||||||
| +10.57 | ||||||||
265
| +10.58 | ||||||||
| +10.59 | ||||||||
| †+10.60 | ||||||||
| †+10.61 | ||||||||
| +10.62 | ||||||||
| 10.63 | ||||||||
| 10.64 | ||||||||
| 10.65 | ||||||||
| 10.66 | ||||||||
| 10.67 | ||||||||
| 10.68 | ||||||||
| 10.69 | ||||||||
266
| 10.70 | ||||||||
| †10.71 | Revolving Credit Facility, among ACMP Holdings, LLC, Apollo Capital Markets Management, L.P., Sumitomo Mitsui Banking Corporation, Mizuho Bank Ltd. and the lenders from time to time party thereto, dated as of April 1, 2022 (incorporated by reference to Exhibit 10.1 to the Registrant's Form 8-K filed with the Securities and Exchange Commission on April 7, 2022 (File No. 001-41197)). |
|||||||
| 10.72 | ||||||||
| *21.1 | ||||||||
| *23.1 | ||||||||
| *23.2 | ||||||||
| *31.1 | ||||||||
| *31.2 | ||||||||
| *32.1 | ||||||||
| *32.2 | ||||||||
| 99.1 | ||||||||
| 101.INS | XBRL Instance Document - the instance document does not appear in the Interactive Data File because its XBRL tags are embedded within the Inline XBRL document | |||||||
| *101.SCH | XBRL Taxonomy Extension Schema Document | |||||||
| *101.CAL | XBRL Taxonomy Extension Calculation Linkbase Document | |||||||
| *101.DEF | XBRL Taxonomy Extension Definition Linkbase Document | |||||||
| *101.LAB | XBRL Taxonomy Extension Label Linkbase Document | |||||||
| *101.PRE | XBRL Taxonomy Extension Presentation Linkbase Document | |||||||
267
| 104 | Cover Page Interactive Data File (embedded within the Inline XBRL document). | |||||||
| * | Filed herewith. | ||||
| + | Management contract or compensatory plan or arrangement. | ||||
† |
Certain information contained in this exhibit has been omitted because it is not material and is the type that the registrant treats as private or confidential. |
||||
The agreements and other documents filed as exhibits to this report are not intended to provide factual information or other disclosure other than with respect to the terms of the agreements or other documents themselves, and you should not rely on them for that purpose. In particular, any representations and warranties made by us in these agreements or other documents were made solely within the specific context of the relevant agreement or document and may not describe the actual state of affairs as of the date they were made or at any other time.
268
ITEM 16. FORM 10-K SUMMARY
Not applicable.
269
SIGNATURES
Pursuant to the requirements of the Securities Exchange Act of 1934, the registrant has duly caused this report to be signed on its behalf by the undersigned, thereunto duly authorized.
| Apollo Global Management, Inc. | |||||||||||
| (Registrant) | |||||||||||
| Date: February 28, 2023 | By: | /s/ Martin Kelly | |||||||||
| Name: | Martin Kelly | ||||||||||
| Title: | Chief Financial Officer (principal financial officer and authorized signatory) |
||||||||||
270
Pursuant to the requirements of the Securities Exchange Act of 1934, this report has been signed below by the following persons on behalf of the registrant and in the capacities and on the dates indicated:
| Name | Title | Date | ||||||||||||
| /s/ Marc Rowan | Chief Executive Officer and Director | February 28, 2023 | ||||||||||||
| Marc Rowan | (principal executive officer) | |||||||||||||
| /s/ Martin Kelly | Chief Financial Officer | February 28, 2023 | ||||||||||||
| Martin Kelly | (principal financial officer) | |||||||||||||
| /s/ Louis-Jacques Tanguy | Chief Accounting Officer | February 28, 2023 | ||||||||||||
| Louis-Jacques Tanguy | (principal accounting officer) | |||||||||||||
| /s/ James Belardi | Director | February 28, 2023 | ||||||||||||
| James Belardi | CEO of AHL | |||||||||||||
| /s/ Scott Kleinman | Director | February 28, 2023 | ||||||||||||
| Scott Kleinman | Co-President of AAM | |||||||||||||
| /s/ James Zelter | Director | February 28, 2023 | ||||||||||||
| James Zelter | Co-President of AAM | |||||||||||||
| /s/ Walter (Jay) Clayton | Non-Executive Chair and Director | February 28, 2023 | ||||||||||||
| Walter (Jay) Clayton | ||||||||||||||
| /s/ Marc Beilinson | Director | February 28, 2023 | ||||||||||||
| Marc Beilinson | ||||||||||||||
| /s/ Jessica Bibliowicz | Director | February 28, 2023 | ||||||||||||
| Jessica Bibliowicz | ||||||||||||||
| /s/ Michael Ducey | Director | February 28, 2023 | ||||||||||||
| Michael Ducey | ||||||||||||||
| /s/ Richard Emerson | Director | February 28, 2023 | ||||||||||||
| Richard Emerson | ||||||||||||||
| /s/ Kerry Murphy Healey | Director | February 28, 2023 | ||||||||||||
| Kerry Murphy Healey | ||||||||||||||
| /s/ Mitra Hormozi | Director | February 28, 2023 | ||||||||||||
| Mitra Hormozi | ||||||||||||||
| /s/ Pamela Joyner | Director | February 28, 2023 | ||||||||||||
| Pamela Joyner | ||||||||||||||
271
| /s/ AB Krongard | Director | February 28, 2023 | ||||||||||||
| AB Krongard | ||||||||||||||
| /s/ Pauline Richards | Director | February 28, 2023 | ||||||||||||
| Pauline Richards | ||||||||||||||
| /s/ David Simon | Director | February 28, 2023 | ||||||||||||
| David Simon | ||||||||||||||
| /s/ Lynn Swann | Director | February 28, 2023 | ||||||||||||
| Lynn Swann | ||||||||||||||
272